1
Development of a hybrid system for a three-wheeled motor taxi T. Hofman Technische Universiteit Eindhoven Dept. of Mech. Engineering, Control Systems Technology Group, PO BOX 512, 5600 MB Eindhoven, The Netherlands Email:
[email protected]
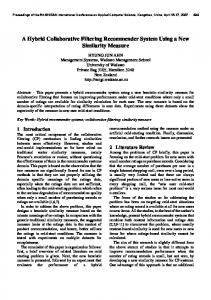
I. I NTRODUCTION Large cities in Asia and Africa millions of auto-rickshaws offer their taxi-services. At the same time these three-wheelers cause severe air-pollution and produce large amounts of green house gasses (CO2). The drivers of these vehicles constitute mainly the lower income groups in society who earn around Rs 75–125 per day, or 1.2–2 Euro per day. Auto-rickshaws are also known as ‘tuc-tucs’ in India (see, Figure 1). Within
Fig. 1.
Three-wheeled motor taxi equipped with a 2-stroke engine [1].
this framework the objective of the project [2] is to make this existing tuc-tuc more efficient through the use of an affordable add-on hybrid system. The fuel economy improvement objectives are 40%–60% without loss of vehicle performance. Moreover, the hybrid tuc-tuc project objectives are: • CO2-emission reduction of tuc-tucs; • Improve air quality in Asian cities; • Improve social and economic situation of tuc-tuc drivers (increase income); • Stimulate innovation and inspire young entrepreneurial people. In the year 2000 there were about 18 million petrol-enginepower two-wheelers and about 1.5 million petrol- and dieselpowered three wheelers. Since then the population is estimated to be grown at a rate of about 15% per annum [3]. If we assume that an auto-rickshaw runs approximately 50–60 Km/day with a fuel consumption of 25–30 Km/l, then the fuel consumption is approximately 2 l per day. The corresponding CO2-emissions are 2 l/day·2.5 Kg/l = 5 Kg per day. If a hybrid system added on to the conventional drive train would save fuel of at least 40%, then the total amount of CO2-reduction for 1 million tuc-tucs would be 2 million Kg per day. If the
CO2-reduction would be traded on the European market, then the saved CO2-emissions against 25 Euro/1000Kg [4] would be worth approximately 50 thousand Euro, and on a yearly basis (assume 300 days in operation per year) approximately 15 million Euros. A. Objectives and outline of the paper In literature [5], [6], [3] other design concepts for threewheeled vehicles can be found. In [3] a completely batterydriven rickshaw, which has been developed in India and is called Elecsha, is discussed. The electric vehicle has a zero emission range of 60–80 Km (60%–80% depth-of-discharge). The maximum speed is 30 Km/h. The electric motor size is 1.2 kW and the battery pack consists of a 3 lead-acid batteries with a total capacity of 100 Ah with a package mass of 96 Kg. The cost price of the rickshaw in mass production is estimated to be between 70000–100000 Rs, which is approximately equal to 1100–1600 Euro respectively. A conventional rickshaw equipped with a petrol or diesel engine costs between 75000 Rs and 100000 Rs, or 1200 Euro and 1600 Euro respectively. In this design study we are aiming at a fuel saving of at least 40% for a hybrid system with a cost price in mass production between 300–600 Euro. The additional cost in Euro per Kg CO2-emissions reduction per day would be approximately 450/2 = 225 Euro/Kg CO2 reduction. In comparison with the full-electric vehicle this would be 1350/5 = 270 Euro/Kg CO2 reduction. Using these assumptions the hybrid system could be more cost-effective while the vehicle performance is not compromised. In this study we present a concept design evaluation study for the innovative hybridization of a tuc-tuc. In this study different hybrid concepts are evaluated and compared by simulation using a quasistatic simulation method [7]. A conceptual design for the hybrid system will be presented. The outline of the paper will be as follows. The vehicle model is discussed in Section 2. Accordingly, the topology design options are discussed in Section 3. Finally, in Section 4 conclusion and future work is discussed. II. V EHICLE MODEL AND POWERTRAIN The vehicle is equipped with a two-stroke 145.45 cc single cilinder SI engine with a maximum crankshaft power of 5.15
2
Engine Value: Type Single cylinder, 2-stroke forced air cooler Displacement 145.45 cc Max. power, Pe,max 7.00 HP, 5.15 kW at 5000 rpm 12.1 Nm at 3500 rpm Max. torque, Te.max Transmission 4 forward and 1 reverse Gear ratios† , rt [0.20, 0.34, 0.54, 0.89] Primary ratio† , rp 0.88 Final drive ratio† , rd 0.24 Clutch type Wet multi-disc type Brakes Front & rear hydraulic break system Weights & Measures Gross vehicle weight, mv 610 Kg Kerb weight 272 Kg Monocoque Chassis type Dimensions Overall length 2625 mm Overall width, W 1300 mm Overall height, H 1710 mm Wheel base, L 2000 mm 180 mm Ground clearance Turning radius 2.88 m Tyres, rw 4.00-8, 4PR Roll resistance‡ , cr 0.015 Air drag coefficient‡ , cd 0.44 Frontal surface area‡ , Af 2.0 m2 Electric system System voltage 12 V Alternator output ‡ 13.5 V, 35 A at 3600 rpm Fuel economy Mileage within a city 18 to 20 Km/liter (45 mpg) Mileage on the highway 25 Km/liter (60 mpg) Average traveled distance 40 to 60 Km/day Maximum speed 56–80 Km/h (35–50 mph) Fuel tank capacity 8 liters (including 1.4 liters reserve) Gas tank travel distance 145 Km to 190 Km (90 mi to 120 mi) Oil must be added to every liter at 20 to 50 ml/liter (2.5 oz. 6.4 oz./ gal) † the values used are for a diesel engine (actual values are yet not available). ‡ these values are estimated.
fuel efficiency map is also yet not available. Therefore, the engine efficiency map of a 1.0 l SI engine is downsized to meet the specifications of the 145 cc 2-stroke engine. Thereby, the efficiency values of the 1.0-l engine are linearly down-scaled, where the maximum efficiency becomes 21% corresponding to the typical maximum value of a two-stroke engine. The transmission and the final drive efficiency are both average constant 95% assumed. A. Drive cycle and drive power demand In literature [3] is found that auto-rickshaws in the traffic conditions in inner-city areas run at only 15–20 Km/h. This cause a severe emission pollution, since the conventional powertrains are designed to run efficiently at 40–45 Km/h.
Tv (t) = mv · g · cr · rw +
1 3 · ρ · cd · Af · ωv (t)2 · rw , 2
(1)
with the wheel speed ωv (t) = v(t)/rw .
(2)
The drive power demand becomes, Pv (t) = Tv (t) · ωv (t)
(3)
In Figure 2, the modified FTP-75 and the drive power demand calculated with Equation (3) as a function of time is shown. The fuel economy using the drive power demand, the drive 50 Speed [km/h]
TABLE I S PECIFICATIONS : BAJAJ RE 2S P ETROL MOTOR TAXI
Furthermore, the pollution is increased more by frequently starting and stopping of the rickshaw in the dense traffic. Clearly, the drive cycle plays an important role in the design of the hybrid drive train, since it determines the operations points of the power source. Furthermore, on an average the auto-rickshaws travel about 50–60 Km per day. The Federal Test Procedure FTP-75 has been used to mimic the usage of the rickshaw, because of its more dynamic behavior compared to the mild European drive cycle (NEDC). In addition, the FTP-75 has been modified by reducing the top speed to 50 Km/h. The average drive cycle speed is 18.7 Km/h, which correspond to the average inner-city traffic situations. Using this drive cycle and the vehicle parameters as listed in Table I, the vehicle wheel torque can be calculated as follows:
40 30 20 10 0
0
500
1000
1500
2000
0
500
1000 Time [s]
1500
2000
6 Drive power [kW]
kW. The maximum engine efficiency is typically 21% and 23% for an optimized engine with a LPG kit [8]. The transmission consists of a four speed manual gearbox with a reverse gear, and a wet-plate clutch. The kerb mass of the vehicle is 277 Kg and the maximum payload is 333 Kg. Since, the actual vehicle data (roll and air drag resistance) is yet unknown, estimated values are used for the vehicle parameters. In Table I an overview of the vehicle specifications is listed. The actual
4 2 0 −2 −4
Fig. 2.
Drive cycle and power demand as a function of time.
cycle, and pre-scribed gear box shifts can be calculated. In addition, the maximum output of the alternator is estimated to be 13.5 V · 35 A = 438 W. For the simulation an average electrical load of 200 W is assumed. The fuel economy in l/100Km as a function of time is shown in Figure 3. The fuel economy over the modified FTP-75 becomes 3.6 l/100Km, or 27.9 Km/l. Idle fuel cut-off is assumed during braking. If the engine is stopped at vehicle standstill, then an absolute or relative fuel saving could be realized of 0.25 l/100Km or approximately 7% respectively. The fuel consumption for engine restart is not included. The fuel economy with startstop and idle fuel cut-off during braking is 3.3 l/100Km, or 30.0 Km/l.
6
50
5.5
40
5
30
4.5
20
4
10
In Table II the required electric machine size (kW) based on the maximum generative braking power, i.e., Pem = −fbr · min(Pv (t))/ηt ,
Speed [km/h]
Fuel economy [L/100km]
3
(8)
and the fuel economy improvement (including start-stop at vehicle stand still) are shown as a function of regenerative brake fraction fbr . The transmission ηt , the electric motor ηem and battery efficiency ηb are 98%, 85%, and 80% average constant assumed. The engine is assumed to shut off and has no drag losses during braking and electric driving. It can TABLE II F UEL SAVING POTENTIAL AS A FUNCTION OF REGENERATIVE BRAKE FRACTION AND ELECTRICAL LOADS .
Fig. 3.
0
500
1000 Time [s]
1500
0 2000
Fuel economy and drive cycle as a function of time.
B. Fuel saving potential The fuel saving potential could be improved by brake energy recuperation and re-use this energy, denoted as EBER , for electric driving. The electric energy used for driving is
Fig. 4.
Energy flows during regenerative braking and electric driving.
denoted as EM . In Figure 4, the energy flow paths from the vehicle wheel to the battery storage system are shown. The regenerative brake energy is calculated over the drive cycle with time length tf with Z tf EBER = − fbr · min(0, Pv (t)) · ηt · ηem · ηb · dt, (4) 0
and the required propulsion energy for electric driving is calculated with, µ ¶ ¶ Z tf µ max(0, Pv (t)) EM = min , PM − α · PM · dt, (ηt · ηem · ηb ) 0 (5) under the condition that the discrete variable α ∀ t = [0, tf ] becomes, ( (0,Pv (t)) 1, if max (ηt ·ηem ·ηb ) ≥ PM , α= (6) 0, elsewhere. The storage power up to which the brake energy can be used o for pure electric driving, denoted as PM , becomes, o EBER h− EM (PM ) =i0 | max (Pv (t)) o + . PM ∈ PM = 0, (ηt ·ηem ·ηb ) ∈ R ∧ 0 ≤ PM ≤ −min(Pv (t)) · fbr · ηt · ηem · ηb (7)
fbr (%) 0 25% 50% 75% 100%
Pem (kW) 0 0.6 1.2 1.9 2.5
Fuel economy (Km/l) 200 W 0W 27.9 31.1 30.7 35.6 31.8 37.4 32.5 38.5 33.3 40.0
Improvement (%) 200 0W 100% 100% 110% 114% 114% 120% 116% 124% 119% 129%
be observed, that the fuel saving potential and the required electric machine size are strongly affected by the regenerative brake fraction. The total relative fuel saving potential with a 1.2 kW electric machine size, 50% regenerative brake fraction including start-stop, engine off and disengaged during electric braking and driving, and 200 W electrical loads becomes 14%. Although, the electric machine is specified at 1.2 kW only 486 W is used for propulsion during electric driving. In Figure 5, the operation points of the electric machine over de drive cycle for the electric-only modes are plotted. The maximum drive power up to which the rickshaw is propelled by the electric machine is 476 W and the maximum braking power at the wheels is -1.25 kW. If the electrical loads are zero, then the 120 100
Drive torque demand, Tv [Nm]
3.5
80 60 Large concentration of operation points 40 Max. drive power demand 476 W 20 0 −20 Min. drive power demand −1.25 kW
−40 0
10
20 30 Vehicle speed, v [km/h]
40
50
Fig. 5. Operation points of the electric machine. Electric machine size is 1.2 kW with a regenerative brake fraction fbr = 50%.
fuel economy improvement is 20%, which is still too low because to objective is to realize at least 40% fuel saving. However, the strategy is not optimal and the fuel saving could be further improved, which is defined as future research.
4
C. Energy storage specification Many different battery technologies are available on the market, e.g., Lead-Acid SLA, NiCd, NiMH, Li-ion, Lipolymer battery technologies. The Lead-Acid batteries are safe, but have lower energy and power density specifications compared to the other battery technologies. NiMH battery, which is more expensive, has a good efficiency has become a mature technology and is a well-accepted storage technologie for hybrid vehicle applications. Li-ion batteries have a high energy, power density and efficiency specification, but are expensive. This type of battery have a narrow overcharge tolerance. Continuously charging over the maximum voltage limitation would damage the battery performance (cycle life) and could result in firing, or explosion. In Table III an overview of different battery specifications is shown [9]. Among Li-polymer technologies the lithium iron phosphate TABLE III BATTERY TECHNOLOGIES Battery Lead-acid NiCd NiMH Li-ion
Wh/Kg 35 50 60 135
W/Kg 180 120 200 430
Cycles 600 1500 1000 1200
(LiFePO4) is seen as a suitable battery technology for large capacity and high power applications. The LiFePO4 is characterized by faster charging (two times faster), a large overcharge tolerance (0.7 V from it charging voltage plateau 3.4 V), and a longer cycle life (2000 cycles, five times larger) compared to conventional Li-ion batteries. However, these batteries are still relative expensive, i.e., approximately 500 Euro/kWh. On the Asian market LiFePO4 batteries are available. In this example we have selected the Li-polymer battery with a nominal voltage of 48 V and a capacity of 15 Ah. The energy density is 90 Wh/Kg or 116 Wh/l. The maximum continuous discharging current is 50 A. The traveled distance of the modified FTP-75 cycle is 9.7 Km, which corresponds to 15%–20% of the total traveled distance per day. Given the Li-polymer battery specifications, a maximum Depth-of-Discharge (DOD) of 60% the maximum stationary vehicle speed at which the rickshaw is propelled with zero emission can be calculated. If the same average constant component efficiencies as in the previous section are assumed, then the maximum reachable stationary vehicle speed becomes 23 Km/h. This value is equal to the average non-zero drive cycle speed of the modified FTP-75. For comparison the hybrid rickshaw specifications based on the simulation results, are compared with the full-electric rickshaw Elecsha [3]. In Table IV the main specifications are shown. From an energy efficiency point of view (Wh/km), the Elecsha appears to perform better than the hybrid electric rickshaw. However, if the vehicle mass of the hybrid electric rickshaw is reduced to 410 Kg, then the energy efficiency becomes 234 Wh/Km, which is close to the Elecsha. This discrepancy is expected to be reduced further by optimal control of the power sources. Moreover, the performance of the hybrid electric vehicle is expected to be higher. Note
that the energy required to drive the vehicle in traction mode (wheel torque Tv (t) > 0) over the drive cycle is 48 Wh/km, and 33 Wh/km if all brake energy is recuperated with 100% efficiency. The conventional rickshaw has an energy efficiency of approximately 8.47 · 103 /27.9 = 313 Wh/km with a caloric value of petrol 8.47 kWh/l. Maintenance and battery replacement costs can be severe design penalty. For the Elecsha the battery replacement costs are 15000 Rs, or 237 Euro for every other year. Optimal selection of the battery technology, including criteria such as replacement costs, besides efficiency, and power / energy density specifications, is also defined as future research. TABLE IV C OMPARISON OF THE FULL - ELECTRIC AND THE H YBRID -E LECTRIC R ICKSHAW (HER) ELECSHA HER GVW 410 Kg 577 Kg ZER 60–80 Km (60%–80% DOD) 9.7 Km (60% DOD) Top speed 30 Km/h 65 Km/h Battery type Exide Lead-Acid Li-polymer weight 96 Kg 8 Kg capacity 100 Ah 15 Ah specific power 7.95 W/Kg 300 W/Kg energy density 39.7 Wh/Kg 90 Wh/Kg Voltage 36 V 48 V Cycle life 150–200 cycles (60% DOD) 2000 cycles Charge time 10–12 h 2h Motor 1.2 kW PMDC 1.2 KW Energy efficiency 220 Wh/km 275 Wh/km ZER = Zero-Emission Range, GVW = Gross Vehicle Weigth, n/a = not available
III. T OPOLOGY OPTIMIZATION In addition to the component sizing and control optimization, the topology selection also plays an important role in the overall hybrid drive train optimization. In Figure 6, an overview is given of different locations of coupling of the hybrid system to the drive train. If more hybrid functions
Fig. 6. Overview topology design options for parallel hybrid drive train. The numbers indicate a possible location of the hybrid system. ICE = Internal Combustion Engine, FT = Fuel Tank, CL = wet-plate clutch, MT = Manual Transmission, BAT = Battery, Aux = Auxiliaries, S/A = Starter/Alternator.
(or hybrid driving modes) can be used, then the fuel saving potential increases. Depending the topology some of the hybrid functions can be utilized very well and other functions raise
5
difficulties or are impossible. In Table V an overview is given of the pro’s and con’s of the different topologies. From this TABLE V T OPOLOGY D ESIGN O PTIONS Topology 1 2 Regenerative braking ++ Electric driving ++ ∅ Motor-assisting + + Charging during driving ++ Start Stop ∅ ++ Compact electric machine size + Easy to mount ++ Score/Max.Score: 43% 29% Legend: ++ = very good, + = good, - = bad, ∅ = not possible
3 + + + ++ + + 43%
PLACE PHOTO HERE 4 + ++ ++ + ∅ 29%
5 + ++ ++ + ∅ + 43%
qualitative comparison it can be concluded that topology 1, 3, and 5 perform the same and are therefore favorable. However, detailed analysis of these topologies needs to be done, which is also defined as future research. IV. C ONCLUSION AND F UTURE WORK In this paper the design problem of a three-wheeled motor taxi and the impact of hybridization on CO2-reduction for these types of vehicles is discussed. Using a basic control strategy, the effect of component sizing and regenerative brake fraction on the fuel economy is investigated. In future research (final paper), the influence of optimal control strategies, technology choices, and topologies on the fuel economy and vehicle performance (acceleration, top speed) will be investigated. In addition, component specifications will be derived and used for the design of the hybrid system. R EFERENCES [1] Bajaj, “www.auto-rickshaw.com,” 2008. [2] Enviu Foundation, “Rules and regulation hybrid tuktuk battle 2008,” Rotterdam, The Netherlands, January 2008. [3] A. Rajvanshi, “Cycle rickshaws as a sustainable transport system for developing countries,” Human Power, Technical journal of the IHPVA, no. 49, pp. 15–18, 2000. [4] PointCarbon, “http://www.pointcarbon.com/,” 2008. [5] F. Caricchi, L. D. Ferraro, F. G. Capponi, O. Honorati, and E. Santini, “Three-wheeled electric maxi-scooter for improved driving performance in large urban areas,” in Proc. of the IEEE Electric Machines and Drives Conference, vol. 3, June 2003, pp. 1363 – 1368. [6] M. Alam, T. Moeller, and A. Maly, “Converions of an Indian three weeler scooter into a hybrid fuel cell Ni-MH battery vehicle and validation of the vehicle model for the Bajaj three wheeler scooter,” in Proc. of the IEEE Conference on Electric and Hybrid Vehicles, 2006. [7] T. Hofman, “Framework for combined control and design optimization of hybrid vehicle propulsion systems,” Ph.D. dissertation, Technische Universiteit Eindhoven, 2007. [8] M. Loganathan, P. Manivannan, and A. Ramesh, “Study on manifold injection of LPG in two stroke SI engine,” Indian journal of engineering and materials sciences, vol. 13, no. 2, pp. 95–102, 2006. [9] L. Guzzella and A. Sciarretta, Vehicle Propulsion Systems - Introduction to Modeling and Optimization. Springer-Verlag, Berlin Heidelberg, 2005.
Theo Hofman received his M.Sc. and Ph.D.-degree in Mechanical Engineering from Eindhoven University of Technology, Eindhoven. Since September 2007, he is a Postdoc researcher with the Control Systems Technology group. His research interests are modeling, design, and control of hybrid technologies for propulsion systems.