Development of a new field inoculation technique to assess partial resistance in soybean to Sclerotinia sclerotiorum J. Auclair1, G. J. Boland2, E. Cober3, G. L. Graef4, J. R. Steadman5, J. Zilka1, and I. Rajcan1,6 1Department of Plant Agriculture, University of Guelph, Guelph, Ontario, Canada N1G 2W1; 2Department of Environmental Biology, University of Guelph, Guelph, Ontario, Canada, N1G 2W1; 3Eastern Cereal and Oilseed Research Centre Agriculture and Agri-Food Canada Central Experimental Farm Ottawa, Ontario, Canada K1A 0C6; 4Department of Agronomy and Horticulture, University of Nebraska-Lincoln P.O. Box 830915 Lincoln, Nebraska, USA 68583-0915; 5Department of Plant Pathology, University of Nebraska-Lincoln P.O. Box 830915 Lincoln, Nebraska USA 68583-0915. A contribution of the University of Nebraska Agricultural Research Division, Lincoln, Nebraska, 68583. Journal Series 14135. Received 28 February 2003, accepted 20 August 2003.
Auclair, J., Roland, G. J., Cober, E., Grael, G. L., Steadman, J. R., Zilka, J. and Rajcan, I. 2004. Development of a new field incolulation technique to assess partial resistance in soybean to Sclerotinia sclerotiorium. Can. J. Plant Sci. 84: 57–64. The use of appropriate techniques to assess disease resistance is crucial to understanding the genetic control of host resistance to pathogens to develop resistant plant varieties. The objective of this study was to develop and evaluate a novel field-based inoculation technique for sclerotinia stem rot in soybean [Glycine max (L.) Merr.], caused by Sclerotinia sclerotiorum (Lib.) de Bary. The barley kernel inoculation technique involves stem inoculation using an infected barley kernel inserted into a wound made in the soybean stem. The damage on soybean plants is measured by the length of the lesion on inoculated stem and expressed as inoculation severity index (ISI). Soybean varieties were evaluated for 2 yr at different sites using the barley kernel inoculation technique, and compared with other controlled environment and natural infection-based techniques. The ISIs obtained at Elora, ON, were significantly correlated (r = 0.21, P = 0.021) between the 2 test years (1998 and 1999), and in 1998 with natural infection [as measured by the disease severity index, DSI] at the same location (r = 0.31; P = 0.0005). Using a small set of lines that were specifically selected over several years to respond to DSI, the correlation between the DSI from some locations and years and the ISI in 1999 was negative. The significant positive correlations obtained using soybean lines that were not previously selected for DSI suggest the potential of this technique for pre-screening the breeding material for partial resistance to sclerotinia stem rot prior to confirmation with natural infection levels as measured by DSI. This may be of value to soybean breeders trying to develop soybean lines partially resistant to sclerotinia stem rot because of the difficulty in obtaining consistent and reliable DSI scores across locations and over years. Key words: Sclerotinia stem rot, white mould, inoculation, resistance, soybean Auclair, J., Roland, G. J., Cober, E., Grael, G. L., Steadman, J. R., Zilka, J. et Rajcan, I. 2004. Inoculation au champ de la pourriture sclérotique du colza. Can. J. Plant Sci. 84: 57–64. On a besoin de bonnes techniques d’évaluation de la résistance aux maladies pour comprendre comment l’hôte lutte génétiquement contre les agents pathogènes si l’on veut créer des variétés résistantes. La présente étude devait servir à mettre au point et à évaluer une nouvelle technique d’inoculation de la pourriture sclérotique du colza (Sclerotinia sclerotorium (Lib.) de Bary) sur le terrain pour le soja [Glycine max (L.) Merr.]. En vertu de cette technique, on insère l’amande infectée d’un grain d’orge dans une blessure pratiquée dans la tige et on mesure les dommages causés au plant d’après la longueur de la lésion en les exprimant au moyen d’un indice de sévérité de l’infection (ISI). Pendant deux ans, les auteurs ont évalué les variétés de soja selon cette méthode à divers endroits puis comparé leurs résultats à ceux d’autres techniques faisant appel à un milieu contrôlé ou à une infection naturelle. Les deux années (1998 et 1999), les ISI obtenus à Elora (Ontario) étaient significativement corrélés (r = 0,21; P = 0,021) entre eux et présentaient une corrélation avec l’infection naturelle (mesurée selon l’indice de gravité de la maladie ou IGM) au même endroit, en 1998 (r = 0,31; P = 0,0005). En recourant à un petit nombre de lignées spécifiquement sélectionnées au fil des ans pour réagir à l’IGM, les auteurs ont obtenu une corrélation négative entre cet indice, à quelques endroits et pour certaines années, et l’ISI de 1999. Les importantes corrélations positives obtenues avec les lignées de soja qui n’avaient pas été retenues pour l’IGM donnent à penser que la nouvelle technique pourrait servir à la présélection du matériel génétique destiné à introduire une résistance partielle à la pourriture sclérotique du colza avant confirmation du degré d’infection naturelle par l’IGM. La nouvelle technique pourrait donc s’avérer utile aux obtenteurs qui s’efforcent de créer des lignées de soja partiellement résistantes à cette maladie face à leur difficulté d’obtenir des valeurs uniformes et fiables de l’IGM à certains endroits ou d’une année à l’autre. Mots clés: Pourriture sclérotique du colza, moisissure blanche, inoculation, résistance, soja
Abbreviations: DSI, disease severity index; ELI, excised leaf inoculation; ISI, Inoculation Severity Index; MAD, modified augmented design; MG, maturity group; PDA, potato dextrose agar; PI, plant introduction; QTL, quantitive trait loci
6To
whom correspondence should be addressed (e-mail:
[email protected]). 57
58
CANADIAN JOURNAL OF PLANT SCIENCE
Sclerotinia stem rot of soybean [Glycine max (L.) Merr.], caused by Sclerotinia sclerotiorum (Lib.) de Bary, has been problematic in soybean production in the more temperate part of North America (North Dakota, South Dakota, Wisconsin, Iowa, Illinois, Minnesota, Indiana and Ontario) (Wrather et al. 2001b; Wrather et al. 2003). Sclerotinia stem rot has also been reported as a major disease in India and Argentina (Wrather et al. 2001a). Cultural practices, such as narrow row spacing, reduced tillage, crop rotation and increases in the acreage of susceptible crops, have contributed to an increase in the prevalence and severity of this disease in many soybean growing regions (Vallone and Kokuban 1998). Some soybean genotypes have displayed partial resistance to sclerotinia stem rot under field conditions (Boland and Hall 1987; Nelson et al. 1991; Hoffman et al. 2002). It is believed that partial resistance is a combination of plant architecture escape mechanisms and physiological resistance. Boland and Hall (1986, 1987) demonstrated that the response of soybean varieties in field environments was positively correlated with height, maturity and lodging, suggesting that these variables may be related to mechanisms of disease escape. Several inoculation techniques for sclerotinia stem rot have been reported. These techniques can be classified into three groups, including in planta inoculations, inoculation of excised plant parts and indirect measurements. Examples of these include the straw test (Petzolt and Dickson 1996), detached leaf assay (Tu 1985) and oxalic acid diffusion test (Leone and Tonneijck 1990). None of these techniques were developed to address the need for an artificial inoculation technique under field conditions, which could help to avoid variations in natural disease incidence and severity associated with environmental or spatial variability. The development of such a technique would enable more consistent assessments of physiological resistance under field conditions as compared to evaluations of naturally occurring disease. Some inoculation techniques, initially developed for controlled environment inoculation, have been used under field conditions. These approaches have been somewhat successful but often only a limited number of genotypes were used. Chun et al. (1987) found that disease incidence in field experiments with 13 commercial varieties was significantly correlated over 2 yr, while lesion lengths in controlled environment inoculations were not correlated. Lesion length in commercial varieties assessed by several laboratory methods showed inconsistent correlation with natural disease incidence under field conditions (Chun et al. 1987). Kim et al. (1999, 2000) found the DSI for 18 genotypes was significantly correlated among environments for 5 of 15 pairs of environments studied. They also reported that disease severity ratings based on inoculations were significantly correlated with field results for three of four methods (Kim et al. 1999, 2000). The inoculation techniques themselves were not stable in these studies because significant differences in plant response to infection were observed among trials (Kim et al. 1999, 2000). Several other researchers observed similar results (Nelson et al. 1991; Wegulo et al. 1998). It is evident from these studies that no reliable field inoculation technique is currently available to researchers. Sclerotinia stem rot is known to occur sporadically. Hence, developing
a field-based inoculation technique could reduce the reliance on natural environmental conditions for the evaluation of soybean varieties in the field and help to avoid possible disease escape mechanisms in assessing field-based resistance. Therefore, the objective of this study was to develop and assess a field-based inoculation technique for evaluation of soybean response to sclerotinia stem rot. MATERIALS AND METHODS Soybean Varieties Two experiments were performed using two sets of soybean varieties. In the first set, exp. A, 107 varieties and plant introductions (PIs) of maturity groups I, 00 and 000 were evaluated. This experiment was conducted in 1998 and 1999 in an artificially infested field at the Elora Research Station of the University of Guelph, Elora, ON. Sclerotia from a white bean (Phaseolus vulgaris L.) seed cleaning plant had been broadcast for 3 yr previously to increase the level of inoculum in the soil. In the second experiment, exp. B, 18 varieties and plant introductions of maturity group 0 were evaluated. This experiment was conducted in 1998 and 1999 at the Elora Research Station along with exp. A, and at the Eastern Cereal and Oilseed Research Centre, Agriculture and Agri-Food Canada, Ottawa, ON. The varieties in exp. B were also evaluated by the excised leaf inoculation (ELI) technique developed and conducted at the University of Nebraska-Lincoln (Hoffman et al. 2002) using a single local isolate. This technique is now referred to as the detached leaf assay (Steadman et al. 1997). The youngest trifoliolate was excised from the stem with the petiole from 28-d-old plants and placed in orchid tubes containing water. Four replicates were collected and evaluated. The excised leaf was maintained in a glass Petri dish and four Petri dishes were placed in an aluminium roasting pan lined with most paper towels. The pan was covered with plastic wrap to seal moisture inside. Inoculation was performed by putting an 8-mm plug from the growing edge of a 37– 48-h old Sclerotinia sclerotiorum culture growing on potato dextrose agar (PDA) between the vein of the middle leaflet of the trifoliolate. The trifoliolate was incubated at 22 ± 1°C for 48 h and the elliptical lesion area was measured in square centimetres. Experiments A and B in Elora were planted as a modified augmented design trial (May et al. 1989). Three-row plots, 2.5 m long with 30 cm row spacing were planted using a small plot planter at a density of ~50 seeds m–1. At Elora, all plots were irrigated daily for 1 h by an overhead Nelson agricultural sprinkler system (R. M. Wade & Co., Tualatin, Oregon) from Jul. 01 to Sep. 1 of each year. The field tests conducted in Ottawa were grown in a naturally infested white mold nursery where the soil was a Granby sandy loam (Orthic Humic Gleysol in Canadian soil classification; Humaquept in American Classification system), which was irrigated by overhead sprinkler for 45 min daily from first flower until the beginning of seed filling. The tests were three row plots, 2 m long, planted as a random complete block design with two replications. Row spacing was 20 cm. The plots were planted at a rate of 55 seeds m–1.
AUCLAIR ET AL. — FIELD INOCULATION FOR SCLEROTINIA STEM ROT
59
Table 1. Correlations of the inoculation severity index in 1998 (ISI98) with the inoculation severity index in 1999 (ISI99), and disease severity index in 1998 and 1999 (DSI98 and DSI99) for sclerotinia stem rot of 107 soybeans varieties at the Elora Research Station (exp. A)z ISI98 ISI99 zISI
Corr. coef P Corr. coef P
ISI99
DSI98
DSI99
0.20956 0.02 – –
0.30526 0.0005 0.05755 0.5238
0.0077 0.9321 0.06445 0.4752
= inoculation severity index, DSI = disease severity index.
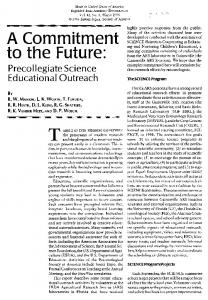
At flowering or R1 (Fehr et al. 1977), a hole of the size of a barley kernel was punched in the plant stem using a scratch awl at about 15–20 cm from the soil surface (Fig. 1a). A colonized barley kernel was inserted into the hole and the stem pressed between fingers to secure the seed in place (Fig. 1b). Preliminary experiments demonstrated that uninfected wounds healed in a distinctive way, precluding the need for blank controls (data not shown). Five plants per plot were inoculated and plots were irrigated daily for 1 h as described previously. After 1 wk, the resulting disease lesion extending up or down (extension was usually symmetrical) from the wound was measured and recorded on a 0–4 inoculation severity index (ISI) where, 0 = no growth, 1 = 0–2 cm long lesion from the hole, 2 = 2–5 cm long lesion, 3 = > 5 cm long lesion and 4 = dead plant (Sedun and Brown 1989). ISI was evaluated for exp. A and B in Elora in 1998 and 1999.
Fig. 1. Inoculation of soybean plants using colonized barley kernels as inoculum (barley kernel inoculation technique). (a) wounding of the plant stem with a scratch awl, (b) arrow shows the barley kernel inoculum secured in position on an inoculated plant stem.
Inoculation Procedures The barley kernel inoculation technique is a modification of the method developed for sunflower (Helianthus annuus) by ˇ Skori˙ c and Rajcan (1992). A single isolate of S. sclerotiorum was obtained by collecting a single sclerotium from the same field at the Elora Research Station in the season preceding inoculation. Sclerotium was surface sterilized in 2.5% sodium hypochlorite, rinsed in sterile water and cultured in a 100 × 15 mm Petri dish containing 30 mL of 10% PDA prepared from fresh potatoes (adapted from Stevens 1974). The culture was maintained at room temperature (18–22°C) on the lab bench under dim light (covered with a single layer of white paper) for 5 d. The culture was then transferred and multiplied. Pieces of colonized agar from the margins of the colony were placed on fresh medium containing 10% PDA. After 3 d, four pieces (about 1 cm2) of colonized agar were transferred to a 500-mL Erlenmeyer flask containing 150 g of barley kernels and 150 mL of distilled water previously autoclaved at 121°C for 20 min. The inoculated cultures in Erlenmeyer flasks were incubated at 25°C in indirect light for 14–21 d.
Disease Severity Index Disease severity ratings on plants infected naturally were also obtained by scoring 30 plants in each plot (from the centre row) on a scale of 0 = plant has no disease, 1 = plant has disease on a side branch but the main stem is not infected, 2 = main stem is infected with little or no effect on seed yield and 3 = main stem is infected with a severe impact on seed yield. Disease severity ratings were then used to calculate a DSI where the individual plant ratings were averaged so that 0 = no plants were infected and 100 = all rated plants given a score of 3 (Kim et al. 1999). Plants were rated for DSI at the beginning of leaf senescence (a few days before the appearance of a pod with mature color). DSI was evaluated for exps. A and B in Elora in 1998 and 1999 and in Ottawa for exp. B in 1998 and 1999. Data Analysis Analysis of residuals and the SAS procedure PROC UNIVARIATE were used to confirm the assumptions that experimental errors were random, independent, normally distributed around the mean and had a common variance. For exp. A, Pearson’s correlation coefficients were calculated using the SAS procedure PROC CORR (SAS 6.12, SAS Institute, Inc. 1990). Outliers were detected and removed from the final analysis by calculating the standardized residuals and comparing them with Lund’s critical value for the standardised residual (Bowley 1999). Only one entry was found to be an outlier and it was removed from the final analysis. The standardized residuals were calculated using the SAS procedure PROC GLM. The modified augmented
60
CANADIAN JOURNAL OF PLANT SCIENCE
Table 2. Correlations of the inoculation severity index in 1998 (ISI98) and 1999 (ISI99) with the disease severity index in 1998 and 1999 (DSI98 and DSI99) at the Elora Research Station and at the Eastern Cereal and Oilseed Research Centre (ECORC), Ottawa, and the excised leaf inoculation (ELI) technique in the laboratory at the University of Nebraska-Lincoln in 1998 and 1999 for sclerotinia stem rot of 18 soybean varieties (exp. B)z
ISI98
ISI99
zISI
DSI99 ECORC
ELI98 Univ. of Nebraska Lincoln
ELI99 Univ. of Nebraska Lincoln
0.05211
–0.23137
-0.3310
–0.09471
0.8373
0.3556
0.7265
0.7177
0.09673
0.11819
–0.53875
0.09496
–0.12761
0.7026
0.6405
0.0211
0.7265
0.6255
DSI98 Univ. of Guelph, Elora
DSI99 Univ. of Guelph, Elora
Corr. Coef P
0.02095
0.30954
0.9342
0.2113
Corr. Coef P
–0.47206 0.0479
DSI98 ECORC
= Inoculation severity index, DSI= Disease severity index, ELI= Excised leaf inoculation
design experiment (Lin and Poushinsky 1983) was analysed using Agrobase (Agromix Software Inc., Winnipeg, Manitoba). Spearman’s rank correlation coefficients were also calculated using the SAS procedure PROC CORR for exp. B. The rank correlation coefficient was deemed more appropriate to use for the smaller data set in exp. B because small errors in parameter estimates (DSI, ISI) were more likely to affect the ranking in a small data set than in a larger one, where more random distribution is assumed (Snedecor and Cochrane 1989). This aspect may not have been reflected in Pearson’s correlation coefficient, which is especially important in measuring multifactorial effects, such as resistance to sclerotinia stem rot, expressed as a single compounded index. RESULTS AND DISCUSSION Evaluation techniques used in this study can be classified into three categories: natural infection (DSI), field inoculation (ISI) and greenhouse inoculation (ELI). Significant differences (P = 0.05) in the DSI, ISI and ELI between soybean cultivars were observed in the 1998 and 1999 trials. The coefficients of determination, R2, for the ISI and DSI analyses of variance in the 1998 and 1999 trials were greater than 0.95. In exp. A, a significant correlation (r = 0.21, P = 0.02) was found between the ISI in 1998 (ISI98) and 1999 (ISI99) (Table 1). The ISI98 was also significantly correlated (r = 0.31; P = 0.0005) with the DSI in 1998 (DSI98) but not in 1999 (DSI99) (r = 0.01; P = 0.9) (Table 1). DSI98 was not correlated with DSI99. Experiment B included fewer entries, but was conducted in more locations and included more techniques. ISI99 was negatively correlated with DSI98 (r = –0.47; P = 0.0479) in Elora and DSI99 (r = –0.54; P = 0.0211) in Ottawa (Table 2). DSI98 was not significantly correlated with DSI99 at any of the individual locations or among locations. The correlation between ISI98 and ISI99 was not significant for exp. B (r = 0.33; P = 0.1862). In exp. A, it was observed that ISI98 was correlated with ISI99 showing that the inoculation technique was stable from year to year. The two summers were climatically very different, showing that the technique was less susceptible to environmental changes than DSI, which was not correlated between 1998 and 1999. The mean DSI for 1998 was 7.36 versus 0.34 in 1999. The low level of natural disease development in 1999 prevented the correlation with any artificial
(mean-cm2).
disease assessment technique. Accordingly, ISI98 was correlated with DSI98 but not with DSI99. The DSI99 was not correlated with ISI99 likely because of the very low average natural infection in 1999 (mean DSI99 < 0.5). On the other hand, in exp. B, where the mean DSI99 was 8.58, a significant negative correlation was observed with ISI99 (r = –0.54; P = 0.0211). The barley kernel inoculation technique was derived from a method first developed for evaluating genotypes of cultiˇ vated and wild species of sunflower (Skori´ c and Rajcan 1992). Over 2 yr, the inoculation method was found to be successful in differentiating among the sunflower genotypes for resistance to sclerotinia stem rot. This is consistent with results from the present study that used the barley kernel inoculation technique. In exp. B, there was a marked absence of correlation of the greenhouse technique to other techniques for the given set of genotypes (Table 2). The results are similar to Hoffman’s study (2002) where ELI was not correlated with field evaluation for maturity groups 0, I, II and IV and other previous reports (Chun et al. 1987; Nelson et al. 1991; Wegulo et al. 1998; Kim et al. 2000). This suggests that laboratory inoculation techniques do not always predict the response of varieties in the field and vice versa. The discrepancy may have resulted from the use of a different isolate of the pathogen in exp. B or from the fact that DSI is dependent on environmental conditions at a given location and year. Both DSI98 in Elora and DSI99 in Ottawa were significantly negatively correlated with ISI99 in exp. B (Table 2). These results would support a theory that the barley kernel inoculation technique only assesses a subset of the resistance mechanism for sclerotinia stem rot. It is important to note that all the lines in exp. B were selected from several years of screening plant introductions using primarily the DSI method (Hoffman et al. 2002). This in turn could have influenced the genetic structure of the lines in exp. B, resulting in a bias toward the resistance mechanism evaluated by DSI rather than that by ISI. In a smaller data set, such as that in exp. B, a few marked differences in the response to a pathogen can easily disturb the correlation. For example, the highest ISI99 value was obtained from PI417449, although its value for DSI98 in Elora and DSI99 in Ottawa were below the average response in the given test (Table 4). The response of
AUCLAIR ET AL. — FIELD INOCULATION FOR SCLEROTINIA STEM ROT
61
Table 3. Disease severity index (DSI) and inoculation severity index (ISI) of soybean cultivars evaluated for resistance to Sclerotinia sclerotiorum in field trials, Elora, 1998 and 1999 (exp. A) Variety
DSI98
ISI98
140 Pioneer 9071 Pioneer 9132 EX1y EX2 EX3 EX4 2801R 91b01 A0868 A0972 A1553 Ac2001 AM08801 AM1372 Amberly Arva Bounty EX5 EX6 EX7 EX8 EX9 EX10 EX11 EX12 Fiesta EX13 EX14 EX15 EX16 EX17 M-080 Marathon Maverick MS 0747 Nattosan OAC Stratford OAC Elora OAC 98-02 OAC Woodstock OAC Auburn OAC Bayfield OAC Brussels OAC Dorado OAC Embro OAC Exeter OAC Millenium OAC Salem OAC Shire OAC Wingham EX18 EX19 EX20 PI081775 PI091733 PI12329x PI13220 PI153282 PI153316 PI184042 PI189896 PI189919 PI189931 PI361059 PI378669 PI39158x
15 8.35 0 8.35 0 35.5 5 1.65 12.2 29.43 5 1.65 2.2 1.65 10 11.1 13.9 7.75 7.8 16.65 13.35 6.1 11.7 24.45 13.35 0 14.4 8.35 1.1 6.7 6.1 0 1.65 1.65 0 14.45 57.4 17.75 0 5 5 2.75 2.75 1.65 10.55 0.55 21.65 0.55 0 42.75 1.1 7.75 23.35 6.65 1.65 7.75 1.65 0 1.1 1.1 11.1 7.75 0 0 1.1 6.65 7.8
2 1.65 2.35 2.6 1.65 2.15 1.75 1.4 1.9 2.1 2.6 1.57 1.4 2.2 1.78 1.4 1.4 2.53 1.63 1.65 1.8 1.6 2.05 2.3 2.2 2.2 1.8 1.7 1.5 1.7 1.85 1.6 2.1 1.75 1.58 1.8 3 1.8 2.15 2.67 1.97 1.8 1.45 1.2 1.8 1 1.8 1.6 1.2 2.72 1 2.63 1.75 2.21 2.06 1.9 2.15 1.95 2.6 1.85 1 1.2 2 2.6 2 2 2
DSI99z
ISI99
0 (–0.36) 0.28 0.86 1.04 1.04 1.15 1.04 0 (–1.05) 1.04 0.86 0 (–1.05) 0.86 0 (–0.69) 0.06 0.86 0 (–0.18) 0.58 1.04 1.86 1.37 0.38 0.15 0.93 0.28 0 (–0.18) 0 (–0.36) 0 (–0.36) 0 (–1.03) 0.28 0 (–0.38) 2.97 0 (–0.63) 0.28 0.42 0 (–0.51) 0.86 0.86 0 (–0.36) 0.93 0 (–0.03) 0.73 1.04 0 (–0.36) 1.04 0.86 0.2 0.93 0 (–0.36) 0.2 0 (–1.07) 0.47 0 (–0.25) 0.93 0.86 0.28 0.64 0 (–0.36) 4.08 0.28 0 (–0.36) 1.04 0 (–0.36) 0 (–1.07) 0 (–1.25) 0.38 0.28 0 (–0.07)
2.51 2.9 2.63 3.3 2 2.77 3.02 2.24 2.1 2.83 2.94 3.23 0.77 2.68 2.21 2.02 3.08 2.58 2.35 2.07 3.44 2.74 2.25 1.92 4.42 3.55 2.95 3.29 1.68 3.14 2.59 2.89 3.08 2.89 2.7 3.47 2.75 2.19 2.53 1.15 3.17 1.5 1.23 2.7 3.11 2.41 2.33 1.65 2.81 2.45 2.91 3.11 3.57 1.67 2.96 2.78 2.15 2.07 3.28 0.23 1.24 2.77 2.35 2.79 2.44 2.2 2.1
62
CANADIAN JOURNAL OF PLANT SCIENCE
Table 3. Continued PI416776 PI416805 PI427143 PI507352 PI507353 PI548312 PI54834x PI548380 PI561284 PI561331 PI561345 PI561353 PI561367 PI567157 PRO 280 PS 50 PS 63 PS 73 RCAT 9702 RCAT 9801 RCAT 9802 RCAT 9803 RCAT Bobcat EX21 EX22 RT 1575 NK S08-80 NK S14-H4 NK S14-M7 OAC Napean OAC Clinton OAC Oxford Sentry T8508 EX23 EX24 EX25 Telstar Williams 82 Zephyr N Mean SE
3.9 4.45 7.75 2.75 4.4 2.75 6.65 3.35 1.65 2.75 3.9 4.4 2.2 1.65 6.1 0 11.65 12.2 0 3.35 8.3 0 0 8.35 7.25 17.8 0 1.1 3.85 5 0 0 5.55 16.65 0 15 10 30.55 0 1.1
1.7 2.3 1 1.7 1.67 2.55 1.45 1.7 1.75 1.98 1.2 1.65 1.2 1.75 1.4 1.5 2.2 1.5 1.5 2.2 2.1 1.8 1.7 2.3 2.05 2.4 1.6 1.75 1.73 1.9 2.2 2.2 1.6 2.15 2.1 2 1.6 2.2 1.9 1.8
107 7.36 0.901
107 1.86 0.0393
0.58 0.93 0.28 0 (–0.36) 0.64 0.28 0.28 0 (–0.29) 0 (–0.36) 0 (–1.27) 0.93 0.15 2.92 0 (–1.69) 0.28 1.04 0.28 0 (–0.69) 0.2 0.28 0 (–0.36) 0.86 0.4 0.86 0 (–0.63) 0.15 0 (–0.36) 0 (–0.47) 1.04 0.06 0.04 0.28 0 (–0.63) 0 (–0.07) 0.47 0.93 0 (–0.36) 0.93 6.31 0 (–1.27) 107 0.34 0.0713
2.48 1.93 1.24 1.47 0.95 2.96 1.44 3 3.27 1.9 3.37 1.94 3.15 1.65 2.56 2.5 3.48 2.71 2.05 3.62 2.79 1.51 1.49 1.59 1.19 2.68 0.99 2.21 2.38 2.37 3.97 3.24 2.19 2.7 3.11 3.21 2.87 2.17 3.35 2.9 107 2.48 0.101
ISI = inoculation severity index, DSI= disease severity index. y The varieties indicated as EX# were experimental lines provided by private companies. z The experiment was planted and analysed as a modified augmented experimental design and the individual scores were adjusted accordingly (resulting in some negative values).
PI153259, PI417507, PI437527, PI438267, PI548379 and TRAILL had a similar discrepancy, which demonstrates the effect of escape on a small dataset. Plant architectural factors, such as height, maturity and lodging (Boland and Hall 1987) can greatly influence resistance to sclerotinia stem rot. The ISI is less affected by these factors because the inoculum is inserted into a wound in the stem. The partial resistance of soybean to sclerotinia stem rot is comprised of several component traits. Architectural traits, such as height, maturity and lodging, were shown to be associated with partial resistance (Boland and Hall 1986, 1987). A large number of quantitative trait loci (QTL) from various genetic sources were shown to be associated with a differential response to sclerotinia stem rot. Arahana et al. (2001) identified 28 QTL from 5 crosses to the variety Williams 82 in a controlled environment, and Kim and Diers (2000) mapped three QTL under field conditions using DSI
as an assessment technique. Two QTL were associated with disease escape mechanisms such as plant height, lodging and date of flowering (Kim and Diers 2000). Each of these components, metric traits or QTL can be considered a desired component of resistance, assuming that their interaction is additive. For breeders to develop a successful variety with high levels of resistance to sclerotinia stem rot, a balance of all resistance components and agronomically relevant traits would have to be achieved. In more practical terms, identifying all components of resistance may allow researchers to specifically identify resistance genes that do not have deleterious effect on agronomic traits and breed those into modern varieties. As an inoculation technique, ISI may assess only certain components of the partial resistance that could be referred to as field-physiological resistance factors. The inoculation technique’s assessment is made on a single plant basis with
2.20 0.00 7.20 5.55 2.75 0.00 0.55 7.75 0.00 0.55 0.00 1.10 0.00 1.65 3.35 2.75 16.10 2.20
18 2.98 0.960
Entry
McCALL PI153259 PI189861 PI189899 PI417449 PI417507 PI417533 PI437072 PI437527 PI437764 PI438267 PI548354 PI548379 PI548404 PI548539 PI578501 PI89001 TRAILL
N Mean SE
18 1.81 0.104
1.45 2.10 2.13 2.20 1.70 2.42 1.50 2.00 1.00 1.00 2.35 1.40 2.15 1.50 0 1.60 2.20 1.73 2.20
ISI 1998 (Elora)
18 0.03 0.191
0.70 0 (–0.63) 0 (–0.38) 0 (–0.51) 0 (–0.69) 1.04 1.04 0.06 0 (–0.96) 0 (–1.27) 0.86 1.04 0.70 (–0.63) 0 (–0.38) 0 (–0.82) 0.26 1.04
DSI 1999z (Elora)
18 2.20 0.184
1.51 2.98 0.92 2.98 3.39 2.65 2.28 2.25 2.28 1.62 3.31 1.85 2.84 2.58 1.75 0.69 1.39 2.31
ISI 1999 (Elora)
18 1.61 0.429
1.50 1.50 0.50 1.00 7.00 0.00 2.00 4.00 1.00 0.00 3.50 0.00 0.00 1.00 1.00 3.00 2.00 0.00 16 4.87 0.172
4.20 4.00 . 4.20 5.90 5.20 6.40 5.40 4.90 4.70 . 5.40 4.40 5.40 4.70 4.50 4.20 4.40
ELI 1998 (Univ. of NebraskaLincoln)
18 8.58 2.54
9.45 1.10 2.75 1.10 1.65 3.35 10.55 12.20 3.35 3.35 2.20 1.10 2.20 38.90 30.00 19.45 9.45 2.20
DSI 1999 (ECORC, Ottawa)
17 5.97 0.210
6.46 6.21 5.16 6.83 6.09 6.02 7.88 5.13 5.59 5.57 4.87 5.46 . 4.77 7.29 6.15 6.65 5.29
ELI 1999 (Univ. of Nebraska-) Lincoln
18 195.2 0.850
186 196 197 196 201 197 196 196 195 196 193 195 196 194 198 198 197 187
Days to R1 at ECORC
ISI = inoculation severity index, DSI= disease severity index, ELI= excised leaf inoculation (mean cm2). zThe experiment was planted and analysed as a modified augmented experimental design and the individual scores were adjusted accordingly (resulting in some negative values).
DSI 1998 (Elora)
DSI 1998 (ECORC, Ottawa)
18 263.0 1.32
254 257 253 269 265 262 259 266 258 269 270 258 267 267 268 267 267 258
Days to R8 at ECORC
Table 4. Disease severity index (DSI), inoculation severity index (ISI) and excised leaf inoculation (ELI) results of 18 soybean cultivars evaluated for resistance to Sclerotinia sclerotiorum in 1998 and 1999 (exp. B)
AUCLAIR ET AL. — FIELD INOCULATION FOR SCLEROTINIA STEM ROT 63
64
CANADIAN JOURNAL OF PLANT SCIENCE
an architecture that would be found in a production situation. However, the technique would not assess any factor that would be present before the stem colonization, such as petal traits that may affect germination or establishment of the mycelia. Furthermore, it would not account for resistance caused by an escape mechanism due in part to maturity differences. Disease escape mechanisms have been associated with plant types that are agronomically less fit (Kim and Diers 2000). Therefore, identifying field-physiological resistance in a quantitative way may be of importance for the initial stages of development of soybean varieties that are partially resistant to sclerotinia stem rot. The barley kernel inoculation technique and the associated ISI may help soybean breeders to pre-screen breeding material against disease escape mechanism that could mask a weak physiological resistance, especially in the absence of DSI scores due to a low and often unpredictable natural infection in the disease nurseries. ACKNOWLEDGMENT We acknowledge the excellent technical help in the field by Wade Montminy, Cal Klager, Yasenia Salazar and a number of graduate and summer students from I. Rajcan’s lab. The graduate stipend for J. Auclair to conduct this research was generously provided by the Food Systems Biotechnology Centre at the University of Guelph. The funding to cover experimentation costs was provided in part by the Ontario Ministry of Agriculture and Food and the Ontario Soybean Growers. Arahana, V. S., Graef, G. L., Specht, J. E. Steadman, J. R. and Eskridge, K. M. 2001. Identification of QTLs for resistance to Sclerotinia sclerotiorum in soybean. Crop Sci 41: 180–188. Boland, G. J. and Hall, R. 1986. Growth room evaluation of soybean cultivars for resistance to Sclerotinia sclerotiorum. Plant Dis. 69: 899–904. Boland, G. J. and Hall, R. 1987. Evaluating soybean cultivars for resistance to Sclerotinia sclerotiorum under field conditions. Plant Dis. 71: 934–936. Bowley, S. R. 1999. A hitchhiker’s guide to statistics in plant biology. Any Old Subject Books, Guelph, ON. Chun, D., Kao, L. B. and Lockwood, J. L. 1987. Laboratory and field assessment of resistance in soybean to stem rot caused by Sclerotinia sclerotiorum. Plant Dis. 71: 811–815. Fehr, W. R., Caviness, C. E., Burmond, D. T. and Pennington, J. S. 1977. Stage of development description for soybeans. Crop Sci. 11: 929–931. Hoffman, D. D., Diers, B. W., Hartman, G. L., Nickell, C. D., Nelson, R. L., Pedersen, W. L., Cober, E. R., Graef, G. L., Steadman, J. R., Grau, C. R., Nelson, B. D., del Rio, L. E., Helms, T., Anderson, T., Poysa, V., Rajcan, I. and Stienstra, W. C. 2002. Selected soybean plant introductions with partial resistance to Sclerotinia sclerotiorum. Plant Dis. 86: 971–980. Kim, H. S. and Diers, B. W. 2000. Inheritance of partial resistance to sclerotinia stem rot in soybean. Crop Sci. 40: 55–61.
Kim, H. S., Hartman, G. L., Manandhar, J. B., Graef, G. L., Steadman, J. R. and Diers, B. W. 2000. Reaction of soybean cultivars to sclerotinia stem rot in field, greenhouse and laboratory evaluations. Crop Sci. 40: 665–669. Kim, H. S., Sneller, C. H. and Diers, B. W. 1999. Evaluation of soybean cultivars for resistance to Sclerotinia stem rot in field environments. Crop Sci. 39: 64–68. Leone, G. and Tonneijck A. E. G. 1990. A rapid procedure for screening the resistance of bean cultivars (Phaseolus vulgaris L.) to Botrytis cinerea and Sclerotinia sclerotiorum. Euphytica 48: 87–90. Lin, C. S., and Poushinsky, G. 1983. A modified augmented design for an early stage of plant selection involving a large number of test lines without replication. Biometrics 39: 553–561. May, K. W., Kozub, G. C. and Schaalje, G. B. 1989. Field evaluation of a modified augmented design (type 2) for screening barley lines. Can. J. Plant Sci. 69: 9–15. Nelson, B. D., Helms, T. C. and Olson, M. A. 1991. Comparison of laboratory and field evaluations of resistance in soybean to Sclerotinia sclerotiorum. Plant Dis. 75: 662–665. Petzolt, R. and Dickson, M. H. 1996. Straw test for resistance to white mold in beans. Ann. Rep. Bean Improv. Coop. 39: 142–143. SAS Institute, Inc. 1990. SAS/STAT User’s Guide. Cary, NC. Sedun, F.S. and Brown, J. F. 1989. Comparison of three methods to assess resistance in sunflower to basal stem rot caused by Sclerotinia sclerotiorum and S. minor. Plant Dis. 73: 52–55. ˇ Skori´ c, D. and Rajcan, I. 1992. Breeding for Sclerotinia tolerance in sunflower. Proceedings of the 13th International Sunflower Conference. Vol. II; 1257–1262. Snedecor, G. W. and Cochrane, W. G. 1989. Statistical methods, 8th ed. Iowa State University Press, Ames, IA. Steadman, J. R., Powers, K. and Higgins, B. 1997. Screening common bean for white mold resistance using detached leaves. Ann. Rep. Bean Improv. Coop. 40: 140–141. Stevens, R. B. ed. 1974. Mycology guidebook. University of Washington Press, Seattle, WA. Tu, J. C. 1985. Tolerance of white bean (Phaseolus vulgaris) to white mold (Sclerotinia sclerotiorum) associated with tolerance to oxalic acid. Physiol. Plant Pathol. 26: 111–117. Vallone, S. and Kokubun, M. 1998. Disease management in notillage soybean systems. Jircas-Working-Report. 13: 35–42. Wegulo, S. N., Yang, X. B. and Martinson, C. A. 1998. Soybean cultivar responses to Sclerotinia sclerotiorum in field and controlled environment studies. Plant Dis. 82: 1264–1270. Wrather, J. A., Anderson, T. R., Arsyad, D. M., Tan, Y., Ploper, L. D., Porta-Puglia, A., Ram, H. H. and Yorinori, J. T. 2001a. Soybean disease loss estimates for the top 10 soybean producing countries in 1998. Can. J. Plant Pathol. 23: 115–121. Wrather, J. A., Koenning, S. R. and Anderson, T. R. 2003. Effect of diseases on soybean yields in the United States and Ontario (1999–2002). Online. Plant Health Progress. doi:10.1094/PHP-2003-0325-01-RV. Online Available: http:// www.plantmanagementnetwork.org/ Wrather, J. A., Stienstra, W. C., Koenning, S. R. 2001b. Soybean disease loss estimates for the United States from 1996 to 1998. Can. J. Plant Pathol. 23: 122–131.