Title: Development of a rapid screen for the endodermal differentiation potential of human pluripotent stem cell lines. Richard Siller1, Elena Naumovska1, Santosh Mathapati1, Max Lycke1, Sebastian Greenhough1 and Gareth J Sullivan1, 2, 3* 1
Department of Biochemistry, Institute of Basic Medical Sciences, Faculty of Medicine,
University of Oslo, PO Box 1112 Blindern, 0317 Oslo, Norway. 2
Norwegian Center for Stem Cell Research, PO Box 1112 Blindern, 0317 Oslo, Norway.
3
Institute of Immunology, Oslo University Hospital-Rikshospitalet, PO Box 4950 Nydalen, Oslo 0424, Norway. *Correspondence to:
[email protected] Tel nos. +47 22851415
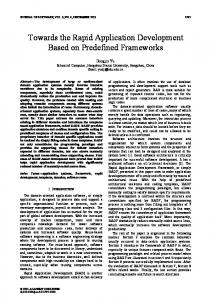
Supplementary Figure S1. EP screen schematic. a. Schematic detailing the timing for the endodermal potential (EP) screen. b. Diagram illustrating the endodermal potential screen set up, in terms of CHIR99021 (CHIR) concentrations (3 – 4µM) and presence or absence of Insulin in the B27 supplement (+/ -). See also Fig. 1. Supplementary Figure S2. Multi-line EP screen day 2 morphology. Morphology of multiple hPSC lines at day 2 of the EP screen, using 3 and 4 µM CHIR99021 in RPMI supplemented with B27 +/- insulin. The conditions used are indicated to the left side of each row, while the cell line is indicated at the head of each column, -INS = B27 containing no insulin and +INS = B27 containing insulin. The white asterisk indicates the optimal condition for each line. The following hPSC lines were assessed: hESC lines 360 and 429; and hiPSC line BJ S1. Cells were imaged using phase contrast microscopy. Scale bar 100 µM. See also Figs. 2 and 4 and Supplementary Fig. S3 online. Supplementary Figure S3. Multiline EP screen day 2 morphology. Morphology of multiple hPSC lines at day 2 of the EP screen, using 3 and 4 µM CHIR99021 in RPMI supplemented with B27 +/- insulin. The conditions used are indicated to the left side of each row, while the cell line is indicated at the head of each column, -INS = B27 containing no insulin and +INS = B27 containing insulin. The white asterisk indicates the optimal condition for each line. The following hPSC lines were assessed: hiPSC lines Det RB, Det RC and CRL R5. Cells were imaged using phase contrast microscopy. Scale bar 100 µM. See also Figs. 2 and 4 and Supplementary Fig. S2 online. Supplementary Figure S4. Multiline EP screen day 2 gene expression analysis. The expression of DE specific markers was measured after 48 hours using TaqMan pRT-PCR on the hPSC lines subjected to the EP screen. We analysed a number of DE specific markers:
cerberus 1 (CER1), forkhead box a2 (FOXA2), hematopoietically expressed homeobox (HHEX) and SRY (sex determining region Y)-box (SOX17). hESC line: 360 and 429; hiPSC lines: BJ S1, Det RB, Det RC, BJ S1 and CRL S23. The Y-axis represents the LOG10 relative quantification (RQ). All samples were normalized to beta-actin (ACTB), and to their respective undifferentiated starting hPSC population. Data is presented as the average of three independent experiments +/- the standard deviation. Red bars = 3 µM CHIR99021 / B27 without insulin. Yellow bars = 4 µM CHIR99021 / B27 without insulin. Light blue bars = 3 µM CHIR99021 / B27 with insulin. Dark blue bars = 4 µM CHIR99021 / B27 with insulin. See also Fig. 5.
Supplementary Figure S5. Multiline EP screen day 2 immunohistochemistry. Immunohistochemistry of multiple hPSC lines at day 2 of the EP screen, using 3 and 4 µM CHIR99021 in RPMI supplemented with B27 +/- insulin. The conditions used are indicated on the left side of each row, -INS = B27 containing no insulin and +INS = B27 containing insulin. The line identity is indicated at the top of each column, the following hPSC lines were assessed: hESC lines 360 and 429; hiPSC line BJ S1. After the above treatment regimes the resulting cells were co-stained for the presence of forkhead box a2 (FOXA2) (green) and SRY (sex determining region Y)-box 17 (SOX17) (red), and counterstained with DAPI (blue) and imaged using confocal microscopy. Scale bar 100 µM. See also Figure 6 and Supplementary Fig 6 online. Supplementary Figure S6. Multiline EP screen day 2 immunohistochemistry. Immunohistochemistry of multiple hPSC lines at day 2 of the EP screen, using 3 and 4 µM CHIR99021 in RPMI supplemented with B27 +/- insulin. The conditions used are at the left side of each row, -INS = B27 containing no insulin and +INS = B27 containing insulin. The line identity is indicated at the top of each column, the following hPSC lines were assessed:
hiPSC lines Det RB, Det RC and CRL R5 After the above treatment regimes the resulting cells were co-stained for the presence of forkhead box a2 (FOXA2) (green) and SRY (sex determining region Y)-box SOX17 (red), and counterstained with DAPI (blue) and imaged using confocal microscopy. Scale bar 100 µM. See also Figure 5 and Supplementary Fig. 5 online.
Supplementary Figure S7. Multiline EP screen HLC differentiation: Glycogen storage. Multiple hPSC lines were differentiated to hepatocyte like cells using a small molecule driven protocol12. At the end of the differentiation the cells were assessed for their ability to store glycogen via Periodic acid–Schiff (PAS) staining. Cells were observed and imaged using phase contrast microscopy. The conditions used for definitive endoderm induction are indicated to the left of each row. The cell line is indicated at the top of each column. hPSC lines assessed were: hESC line H1 and 207; hiPSC lines Det RA and CRL S23. Scale bar 100 µM. See also Fig. 8.
Supplementary Figure S8. Quantitative immunohistochemistry for SOX17. Cells were differentiated to definitive endoderm (day 2 of the EP screen) and stained for the presence of SRY (sex determining region Y)-box 17 (SOX17) (red), and counterstained with DAPI (blue) and imaged using confocal microscopy. The SOX17 positive cells were counted and percentages were determined based on counterstaining of DAPI. 4 fields of view with a minimum of 300 cells each were counted for each line and each differentiation condition. Data presented as the average +/- standard deviation. For submission Asterisks represent significant differences (2-tailed student´s t test): *p ≤ 0.02; **p ≤0.01 and ***p ≤0.005.
Supplementary Table S1. TaqMan RT-qPCR Probe Details.
Gene
Catalogue Number (Life Technologies)
Reference
CER1 FOXA2 GATA4 GSC HHEX MIXL1 NODAL
4331182 4331182 4331182 4331182 4331182 4331182 4331182
Hs00193796_m1 Hs00232764_m1 Hs00171403_m1 Hs00906630_g1 Hs00242160_m1 Hs00430824_g1 Hs00415443_m1
POU5F1 SOX17 SOX7 T ACTB
4331182 4331182 4331182 4331182 4352935E
Hs00999634_gH Hs00751752_s1 Hs00846731_s1 Hs00610080_m1 N/A
Supplementary Table S2. Antibody Details.
Target
Supplier
Catalogue Number
Species
Dilution
FOXA2
AbCam
ab40874
Rabbit
1:1000
SOX17
AbCam
ab84990
Mouse
1:100
Alexaflour 488 anti rabbit
Life Technologies
A21206
Donkey
1:400
Alexafluor 488 anti mouse
Life Technologies
A11059
Rabbit
1:400
Alexafluor 594 anti mouse
Life Technologies
A11005
Goat
1:400