2.2 Detail Analysis of Botnet Detection using Machine Learning and Data .... attacks and malicious activities on the Internet by leveraging on the combined ...
Development of a Real-Time Machine-Learning based Botnet Detection Mechanism by PIJUSH BARTHAKUR DEPARTMENT OF COMPUTER SCIENCE AND ENGINEERING SIKKIM MANIPAL INSTITUTE OF TECHNOLOGY
Thesis Submitted in fulfillment of requirement for the award of degree in
DOCTOR OF PHILOSOPHY to the
June, 2016 © Sikkim Manipal University, 2016 All rights reserved
Abstract Botnet activities have shown immense increase in recent years and also significant advances in their mode of operations. This in turn has attracted attention of many contemporary researchers in this field. Bots have increasingly become stealthy and immune to detection by adopting modular design. Emergence of botnets having distributed Command and Control (C&C) structure that mimic Peer-to-Peer (P2P) technologically has made its detection and dismantling extremely difficult. P2P botnets are (re) designed to have a resilient structure, so that they can prevail over common shortcomings of centralized botnets like single point of failure problem. The methodology for botnet detection proposed in this dissertation leverages on use of Machine Learning algorithms and Data Mining technique. Initially, machine learning algorithms have been used with appropriate feature set characterizing botnet‘s C&C behavior to generate efficient models for classification and proactive detection of botnet‘s C&C flows. Finally, a clustering based framework has been developed for accurate detection of P2P bots in a monitored network. Most of the recent classification based approaches using different machine learning algorithms are efficient in detection of only known botnet technologies. They become ineffective when faced with new form of botnets. On the other hand, clustering based approaches can detect new botnets, but the results obtained in most of these works need further improvement for universal acceptance. Furthermore, most of the classification and clustering based works are dependent on malicious activities/behavior of botnets and hence are not proactive in nature. Three classification models have been generated using machine-learning algorithms. Through the experiences gathered from generation of these classifiers, finally a clustering based framework for botnet detection has been developed. i
First botnet C&C traffic classification model has been developed using Support Vector Machine (SVM). A model selection of SVM is done using Radial Basis Function (RBF) kernel. It is given by K(xi,xj)=exp(-γ||xi-xj||2 ), γ>0. There are two parameters for a RBF kernel: C and γ (gamma). Since it is not known beforehand, which pair of C and γ values would produce the best result, a kind of model selection (parameter search) is performed. The model has been tested on botnet dataset prepared from Nugache botnet. The best parameter pair C=215 and γ=23 achieves a classification accuracy above 99 % with a False Positive Rate of 0.003. Second C&C traffic classification model is a C4.5 Decision Tree classifier, in which an indirect method for generating classification rules has been applied. The proposed rule induction algorithm uses a step by step method for optimizing the decision tree rule set. The final rule set has a uniform structure providing significant insight into similarities within P2P botnet C&C traffic. The classification model has been tested on three different botnet datasets prepared from Nugache, Waledac and P2P Zeus botnet traces. The average accuracy, sensitivity and positive predictive value of the decision tree classification models are 0.990967, 0.991 and 0.991 respectively, with an average model building time of 0.85 second only. Third C&C traffic classification model is a fuzzy rule based classifier using Fuzzy Unordered Rule Induction Algorithm (FURIA). Fuzzy logic often leads to creation of small rule, where each rule is an embodiment of meaningful information. Moreover, there is an inherent fuzziness in security issues and an approximate fuzzy rule set can be generated for detection of security threats. When compared to decision tree based classifier, fuzzy based classifier gives better accuracy and better Area Under the Curve (AUC) measures. The classification model has been
ii
tested on botnet dataset prepared from Nugache, Waledac and P2P Zeus botnet traces. The average percentage of accuracy from three different botnet datasets is 99.5217. Corresponding average values for true positive rate, positive predictive value and false positive rate are 0.995, 0.995 and 0.009 respectively. Similarly, the average AUC measure is 0.996. Finally, a botnet detection method through similarity analysis of clusters has been developed for real-time detection of new bots. The clusters are generated using Expectation Maximization (EM) clustering algorithm. This method is based on features that exactly match during an epoch (typically one day). The relative sizes of clusters are estimated, from where the majority clusters are only considered for further evaluation. Then, duplicate flows from majority clusters are removed and reduction in size of the majority cluster is properly estimated. Finally, by using Jaccard similarity coefficient on the sets obtained from reduced clusters bots are accurately detected in a monitored network. This framework has also been tested on botnet dataset prepared from Nugache, Waledac and P2P Zeus botnet traces. The average accuracy, sensitivity and positive predictive value of the classes to cluster classification models from three different botnet datasets are 0.895, 0.959 and 0.906 respectively. The average percentage of flows in majority clusters of Nugache, Waledac and P2P Zeus botnet datasets are 81.39, 82.315 and 74.15 respectively. Similarly, the average percentage of reduction in cluster size of the majority clusters of Nugache, Waledac and P2P Zeus botnet datasets are 96.69, 92.365 and 87.48 respectively. Jaccard similarity coefficients between reduced clusters that belong to bots within the same botnet are 0.1926, 0.2157 and 0.1008 for Nugache, Waledac and P2P Zeus respectively.
iii
Keywords: Botnet, Bot, Peer-to-Peer (P2P), Support Vector Machine (SVM), Decision Tree, Fuzzy, Fuzzy Unordered Rule Induction Algorithm (FURIA), Expectation-Maximization (EM) Clustering Algorithm, Network Flows.
iv
Acknowledgement With immense pleasure I would like to acknowledge the tremendous support and guidance I have received from people who have helped me out during my research work. I would like to express my sincere thanks and heart-felt gratitude goes to my supervisor Dr. Manoj Dahal who bailed me out during every problem I faced and who will be in my memories forever for the immense help and guidance I received from him. Also, my sincere thanks to my co-supervisor Prof(Dr) M.K.Ghose for his immense support and guidance during the course of this research work. I would also like to express my gratitude to the vice chancellor SMU Brig(Dr) Somnath Mishra, Director SMIT Col(Dr) Amik Garg and Additional Director Col(Dr) Sadasivan Thekkey Veetil for giving me the opportunity to carry out this research work. I would also like to thank the faculty members and the staffs of the Department of Computer Science & Engineering and the Department of Computer Applications who have provided me with help and support during different stages of this work. My special thank go to Prof(Dr) Ajoy Kr. Ray, Prof(Dr) Kalpana Sharma, Prof(Dr) Ratika Pradhan, Prof(Dr) C T Singh and Dr. Samarjit Borah. I would like to thank Mohammad M. Masud, Department of Computer Science, University of Texas at Dallas for providing me a botnet traffic sample to carry out this research work. I also thank Babak Rahbarinia, Department of Computer Science, University of Georgia, USA, for giving me another two samples of P2P botnet traffic.
Pijush Barthakur
v
Table of Contents Page No.
1
Abstract
i
Acknowledgement
v
Table of Contents
vi
List of Figures
x
List of Tables
xii
List of Abbreviations
xiv
Introduction 1.1
Introduction to Botnet
1
1.2
Different Approaches of Botnet Detection
3
1.2.1
Signature Based Detection
5
1.2.2
Anomaly Based Detection
6
1.2.3
DNS Based Detection
7
1.2.4
Machine Learning Based Detection
8
1.2.5
Other Tools and Techniques
8
1.3
Flow Based Approaches for Machine Learning
9
1.4
Motivation Behind the Work
11
1.5
Problem Definition
15
1.6
Solution Strategy
16
1.7
Objectives
17
vi
2
1.8
The Work Done
17
1.9
Organization of Thesis
19
Literature Survey 2.1
Introduction
20
2.2
Detail Analysis of Botnet Detection using Machine Learning and Data Mining based Approaches
20
2.2.1
IRC based Botnet Detection
20
2.2.2
P2P based Botnet Detection
21
2.2.3
Structure Independent Approaches for Botnet Detection
26
2.3
3
Research Gaps and Proposed Improvements
27
2.3.1
Research Gaps from IRC based Botnet Detection Approaches
30
2.3.2
Research Gaps from P2P based Botnet Detection Approaches
31
2.3.3
Research Gaps from Structure Independent Approaches of Botnet Detection
34
Feature Set Selection, Data Set Preparation and Methodology 3.1
Feature Set Selection
36
3.2
Data Set Preparation
41
3.3
Description of P2P Botnets used in Experimentation
42
3.4
Performance Measure of Classifiers
44
3.5
Methodology
46
3.5.1
Botnet C&C Traffic Classification using Support Vector Machine
46
3.5.2
A Rule based Classification Model using C4.5 Algorithm
47
3.5.3
Generation of Fuzzy Rules for Botnet C&C Traffic Classification
47
3.5.4
Botnet Detection through Similarity Analysis of Clusters
48
vii
4
5
Botnet C&C Traffic Classification and Evaluation using Support Vector Machine 4.1
Introduction
50
4.2
Overview of Support Vector Machine
53
4.3
Model Selection
54
4.4
Classification Results and Analysis
55
4.5
Summary
59
Development of a Rule based Classification Model using C4.5 Decision Tree Algorithm 5.1
Introduction
60
5.2
Overview of the Algorithm for Decision Tree Learning
62
5.3
Results and Analysis of the Decision Tree based Classification Model
63
5.3.1
65
5.4 6
A Rule Induction Algorithm for Botnet Traffic Classification
Summary
75
Generation of Fuzzy Rules for Botnet C&C Traffic Classification 6.1
Introduction
76
6.2
Overview of FURIA
77
6.3
Results and Analysis of Fuzzy Rule based Classification Model
79
6.3.1
Analysis of Rule Sets
79
6.3.2
Analysis of Classification Results
85
6.4
Summary
90
viii
7
8
Botnet Detection Framework through Similarity Analysis of Clusters 7.1
Introduction
91
7.2
Feature Selection and Methodology
95
7.2.1
Feature Selection
95
7.2.2
Methodology
96
7.3
Overview of EM Clustering Algorithm
98
7.4
Overview of Jaccard Similarity Coefficient
99
7.5
Classes to Cluster Evaluation of known C&C Flows
99
7.6
Results of Similarity Analysis of Clusters
103
7.7
Testing of the Heuristic
105
7.8
Summary
106
Summary and Conclusion 8.1
Summary
107
8.2
Limitations and Scope for further Studies
109 112
References Annexure-I
Nugache Decision Tree Rule Set
124
Annexure-II
Waledac Decision Tree Rule Set
125
Annexure-III P2P Zeus Decision Tree Rule Set
128
Appendix-I
List of Publications
141
Appendix-II
Scholar Profile
142
Appendix-III Profile of the Supervisor
143
Appendix-IV Profile of the Co-supervisor
144
ix
List of Figures Figure No.
Figure Description
Page No.
Figure 1.1
A typical botnet life cycle
3
Figure 1.2
Schematic diagram of the botnet detection framework
16
Figure 3.1
Machine learning and data mining based framework for real time detection of botnets
47
Figure 4.1
Flow based P2P bot detection architecture using SVM
51
Figure 4.2
Changes in detection accuracy for different combinations of C and γ
56
Figure 4.3
Changes in false positive rate for different combinations of C and γ
57
Figure 5.1
Architecture diagram for botnet traffic classification using decision tree algorithm
61
Figure 6.1
Architecture overview of the fuzzy rule based botnet detection framework
77
Figure 6.2
Comparison of percentage of accuracies of FURIA and C4.5 models
88
Figure 6.3
Graph showing comparison of false positive rate, positive predictive value and sensitivity of the fuzzy rule based classification model
88
Figure 7.1
Basic architectural diagram of flow clustering based detection approach
95
Figure 7.2
(a) Change in false positive rate for different amount of benign Flows (b) Change in accuracy for different amount of benign Flows
101
x
101
Figure 7.3
Clusters generated for P2P Zeus
102
xi
List of Tables Table No.
Table Description
Page No.
Table 2.1
Comparison chart for botnet detection techniques
28
Table 3.1
Percentage of correct classification, true positive (TP) rate and
39
false positive (FP) rate after specific attributes are removed Table 3.2
Percentage of correct classification, true positive (TP) rate and
40
false positive (FP) rate obtained for the subsets of features Table 3.3
Rank list of significant features
40
Table 3.4
A confusion matrix
44
Table 4.1
Flow features selected for SVM classification
52
Table 4.2
Percentage of accuracy and true positive rates for different
56
combination of C and γ Table 5.1
Flow features for C4.5 rule generation
62
Table 5.2
Performance of decision tree classifier and time taken to build
64
the model Table 5.3
Nugache rules for significant attributes only
68
Table 5.4
Replaced antecedents in the new rules for Nugache
69
Table 5.5
Unchanged rules for Nugache
70
Table 5.6
Waledac rules for prediction of normal class with significant
70
attributes only Table 5.7
Waledac rules for prediction of P2P bot with significant
xii
71
attributes only Table 5.8
Replaced antecedents in the new rules for Waledac
71
Table 5.9
Unchanged rules for Waledac
72
Table 6.1
Fuzzy rules for detection of Nugache bot C&C traffic
80
Table 6.2
Fuzzy rules for detection of Zeus bot C&C traffic
81
Table 6.3
Fuzzy rules for detection of Waledac bot C&C traffic
84
Table 6.4
Structural attribute values of fuzzy rule sets
85
Table 6.5
AUC measures of FURIA and C4.5 classification models
89
Table 7.1
Results of classes to clusters evaluation mode
100
Table 7.2
Variations of rate of correct classification for different amount
102
of benign flows. Table 7.3
Percentage of flows in majority clusters
103
Table 7.4
Percentage of reduction in each majority cluster after duplicates
104
are removed Table 7.5
Jaccard similarity coefficients
105
Table 7.6
Percentage of flows in majority clusters and percentage of
105
reduction in each majority cluster after duplicates are removed in case of test datasets
xiii
List of Abbreviations C&C
Command & Control
DDoS
Distributed Denial of Service
IRC
Internet Relay Chat
P2P
Peer-to-peer
A/V
Anti-Virus
DNS
Domain Name System
HTTP
Hypertext Transfer Protocol
IP
Internet Protocol
UDP
User Datagram Protocol
ICMP
Internet Control Message Protocol
SMTP
Simple Mail Transfer Protocol
DDNS
Dynamic Domain Name System
TLD
Top Level Domain
IDS
Intrusion Detection System
HIDS
Host based Intrusion Detection System
NIDS
Network based Intrusion Detection System
ISS
Internet Security System
TCP
Transmission Control Protocol
MTU
Maximum Transmission Unit
IoT
Internet of Things
xiv
SVM
Support Vector Machine
FURIA
Fuzzy Unordered Rule Induction Algorithm
EM
Expectation Maximization
TPR
True Positive Rate
FPR
False Positive Rate
FNR
False Negative Rate
ANN
Artificial Neural Network
NNC
Nearest Neighbors Classifier
GBC
Gaussian Based Classifier
NBC
Naïve Bayes Classifier
URL
Uniform Resource Locator
DGA
Domain Generation Algorithm
TP
True Positives
TN
True Negatives
FP
False Positives
FN
False Negatives
PPV
Positive Predictive Value
ROC
Receiver Operating Characteristic
AUC
Area Under the Curve
RBF
Radial Basis Function
SMO
Sequential Minimal Optimization
WEKA
Waikato Environment for Knowledge Analysis
RIPPER
Repeated Incremental Pruning to Produce Error Reduction
xv
Chapter 1 Introduction 1.1 Introduction to Botnet A botnet can be defined as a coordinated group of malware infected devices – numbering in the hundreds of thousands or even millions - connected to the Internet. The coordinated structure is achieved through established Command & Control (C&C) channels [60]. An automated malware program called bot creates the botnet by scanning through vulnerabilities in the Internet connected devices and orchestrating the required infection for its intended purpose [50]. A botnet is commandeered by a hacker called ―botmaster‖, who pass on commands to the botnet via C&C channels from some remote location (Server/Peer) in the network. The botmaster carries-out attacks and malicious activities on the Internet by leveraging on the combined power of the coordinated group of bots within the botnet. They can be used for sending spam mails, distributed denial-of-service (DDoS) attacks, phishing attacks, identity theft, click frauds and other organized criminal activities [53]. Moreover, they can also be used for covert intelligence collection, weapons of ideological movement and intimidation of political rivals [7]. Common botnet topologies are either centralized or distributed in structure. Most early botnets are based on centralized C&C architecture (e.g. IRC). Botnets with centralized C&C suffer from single-point-of-failure problem, i.e. if C&C is detected and taken down the botnet cripples. However, Internet Relay Chat (IRC) based botnets with their source codes widely available and their setup and maintenance simple and relatively easy, are still popular among 1
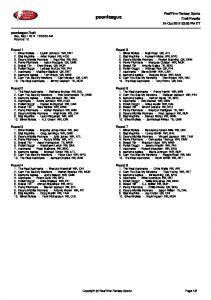
botmasters [50]. Many recent botnets are using distributed C&C architecture (e.g. peer-to-peer), mainly to avoid single-point-of-failure problem. Also, newer peer-to-peer (P2P) botnets uses advanced techniques like Rootkits [16], Fast-flux [62] etc. to avoid detection. Particularly, botnet detection is becoming ever complex due to adoption of various encryption and obfuscation techniques for botnet traffic and also use of dynamic DNS for botnet C&Cs. Irrespective of its structure, botnets follow certain common set of steps during its existence. This common set of steps can be referred to as its life cycle. A proper understanding of botnet life cycle is important for its detection. Figure 1.1 demonstrates a common life cycle of a botnet client. A botclient‘s life cycle begins with exploitation of the computer by injecting the malicious code. This is usually done by tricking the innocent users to run the malicious code; exploitation of existing vulnerabilities including backdoors left by Trojan worms; and brute force access attempts. In the initial phase of life cycle of a botnet client, it has to go through a process called ―rallying‖. Rallying is the term given for the first time a botnet client logins into a C&C server or the botnet client initiates contact with the C&C server. Once rallying is completed, the botnet client tries to secure itself by downloading latest anti-antivirus (Anti – A/V) from the C&C server. Since shutting off of A/V tool may raise suspicion of users, some bot client runs a DLL that hide files related to the botnet clients from the A/V tool. With this mechanism in place, the system would be running A/V software normally, but will never detect the files related to botnet client. Botnet clients may also employ a rootkit and other individual tools to hide from OS and other software applications normally used by security professionals. Once secured, a botnet client listens to its communication channels for probable botnet commands. Whenever, a command to retrieve a payload is received, it is downloaded and its intended function executed. After execution of the function, the result is sent back to the C&C server through the established
2
channel. Whenever a command is received to abandon the machine, it erases all evidences before quitting. Computer is Exploited and Becomes a Bot
New Bot Rallys to let Botherder know It‘s Joined the Team
Retrieves the Anti A/V Module
Secures the New Bot Client
Listens to the C&C Server/Peer for Commands
Reports Results to the C&C Channel
Retrieves the Payload Module
Executes the Commands
On Command, Erases all Evidence and Abandon the Client
Figure 1.1 A typical botnet life cycle [66]
1.2 Different Approaches of Botnet Detection Botnet detection and tracking is the area that has attracted many researchers in recent years. One of the pioneering research groups in the field of botnet is the Honeynet project [77]. But, honeynets are commonly used in the study of botnet characteristics and technology only, and not for detection of bot infections [42, 50]. Botnet detection techniques can be broadly classified into 3
Signature based techniques, Anomaly based techniques, DNS based techniques and Machine Learning based techniques. Signature based approaches are based on content searching/string matching. Signature based techniques have the advantage of real-time and accurate detection of bots. However, this approach has some severe drawbacks. First, it can detect only the known bot instances. Second, false negative rates may increase whenever bot variants are developed even though they may share similar behavior. Third, false positive rate may also increase with increase in bot variants, because of the creation of an extremely large database containing all probable bot signature, some of which may otherwise match benign applications. Fourth, it is possible to evade such detection approaches using encrypted traffic and code obfuscation techniques. Finally, content searching may raise privacy issues as well. In contrary, anomaly based detection approaches [43, 44, 70] depends on network traffic anomalies to detect presence of malicious bots in the monitored network [74]. This includes high network latency, abnormal increase in network traffic volume, traffic going to unusual ports, and abnormal system behavior. DNS based detection may be considered as a special case of anomaly based detection for the reason that it is done via anomalies in DNS traffic generated by botnets. Botnet detection based on specific anomalies may not always be useful for several reasons. First, anomalies may not be always prominent to indicate a botnet attack. Second, it requires continuous monitoring of the network. Third, traffic belonging to botnets using HTTP protocol hides under the cover of normal web traffic and thus gets allowed everywhere. Thus, conventional botnet detection approaches can no longer be relied upon and has to be replaced with more automated and reliable approaches. Efficiency of Machine Learning techniques in automated identification of Web applications and traffic classification has been already well established [76]. Machine Learning algorithms can learn from and make predictions on the data by building a model from example
4
inputs. Therefore, many researchers have relied on the use of Machine Learning based predictive models for automated identification of bot applications.
1.2.1 Signature based Detection In 1998, Snort [81] was developed as a free, open source network intrusion detection and prevention system capable of performing real-time traffic analysis and packet logging on IP networks. Today, Snort is capable of performing multitude of activities such as variety of attack detection, including botnet attacks through content searching/matching. Snort is a signature matching based approach, and therefore it enjoys the advantage of real time detection and zero false positive rates. However, this approach can detect known botnets only. Moreover, very similar bots with slightly different signatures may slip away without getting detected. Another well-known signature matching technique called Rishi [69] looks for similarity in IRC nicknames and characteristic substrings for detection of IRC based botnets. An analysis function gathers all the IRC nicknames and checks for occurrences of several criteria, like for example, suspicious substrings, special characters, or long numbers. Thus Rishi depends on regular expressions as signatures to automatically identify bot infected machines. Besides early detection of infected hosts, using this technique, it is possible to determine the IRC server to which the bots connect. Availability of this information can help in monitoring network traffic and in further investigation of botnet activities. However, this technique fails when botnet uses common IRC nicknames indistinguishable from a real name. Another limitation is that, as the bot evolves to use advance technique for communication like peer-to-peer, this technique will fail to detect the existence of bot.
5
1.2.2 Anomaly based Detection Many anomaly based botnet detection methods have been proposed for detection of centralized botnets using IRC protocol. An open source tool called Ourmon [75], first detect network anomalies through attacking hosts, i.e., hosts attacking other hosts via denial-of-service attacks or by network scanning. Then it correlates this information with IRC channels to determine the set of IRC channels that can be termed suspicious. Therefore, Ourmon is a powerful botnet detection mechanism with a very low false positive rate, which can be used to detect the entire set of infected hosts. Another anomaly based detection technique [52] for IRC botnet uses an active botnet probing technique based on cause effect correlation. The active botnet probing is based on two observations- deterministic behavior of C&C interactions between bots and their lack of tolerance for typographical errors in conversation. They have also proposed a hypothesis testing framework for detecting deterministic communication patterns with the help of a prototype called BotProbe. The technique which had been deployed to detect stateless chat-like botnet communications has greatly reduced the detection time compared to passive approaches. The proposed approach can detect IRC bots with very low false positive rate. Other detection techniques rely on ‗Channel distance‘[55] and ‗periodicity‘[48] to detect IRC botnets. The approach [55] based on ‗channel distance‘ has been defined to determine similarity in nicknames for bots in the same IRC channels. On the other hand, the approach proposed in [48] is on the basis of periodicity shown by IRC botnets during IRC conversions, which has been termed as quasi-periodicity. An anomaly based P2P botnet detection system [31] combines host level information (through host analyzer) and network level information (through network analyzer). The host analyzer clusters malicious hosts through registry analysis and file monitoring. After suspected
6
hosts are clustered, based on the intra-communication degree and inter-communication degree of the peers, the suspected clusters are analyzed for the botnet traces through the similarity in behavior of actions of bots. Another method [56] uses the Information Entropy for Multi-chart CUSUM test in detecting P2P botnets, based on several of the new P2P botnet characteristic properties. UDP, ICMP, SMTP proportions are provided as inputs to the Multi-chart CUSUM algorithm and entropy values with abnormal changes are recorded for the purpose of detecting a newly evolved P2P botnet.
1.2.3 DNS based Detection A DNS based botnet detection mechanism [68] is based on monitoring group activities in DNS queries concurrently sent by bots spread over a large geographical area. Features like botnet DNS traffic which appears in several stages of botnet life-cycle, is normally generated by fixed size group (botnet members). Botnet DNS traffic is characterized by intermittent appearance of group activity patterns and use of Dynamic DNS (DDNS) type. These properties have been used to differentiate botnet DNS queries from genuine DNS queries. Thus, by effectively using these properties of botnet DNS traffic, it is possible to detect botnets. A DDNSbased approach [63] for identifying botnet C&C servers in enterprise and access provider networks is based on identification of abnormally recurring DDNS replies indicating that the query is for a non-existent name (NXDOMAIN). Such DDNS response indicating name errors (NXDOMAIN) frequently matches to botnet C&C servers that have been taken down. In yet another DNS based approach [44] for botnet detection, anomalies in the degree distribution of visited domains are used. Unlike normal domains, C&C-domains are characterized by an unexpected high number of visiting computers. But, since there can be non-malicious popular domains with high degree; filtering techniques have been employed for accurate detection.
7
Another detection technique [32], uses an approach for detection of algorithmically generated domain names of some recent botnets that uses DNS based ―domain fluxing‖ for command-andcontrol. The proposed detection approach looks for patterns inherent in algorithmically generated domain names like distribution of alphanumeric characters and bigrams (e.g. two consecutive alphanumeric characters) in the domain names mapped to the same IP address. This is done after the DNS queries are grouped based on criteria like Top Level Domain (TLD) they all correspond to, or the IP-address that they are mapped to, or the connected component that they belong to.
1.2.4 Machine Learning based Detection Many of the recent works on botnet detection are based on Data Mining and Machine Learning techniques [41, 45, 46, 47, 51, 53, 60, 71]. Self learning capability of Data Mining and Machine Learning based approaches provides much needed automation for detection of more general and resilient botnets. Since the detection approach presented in this dissertation is based on Data Mining and Machine Learning based techniques, detail analysis of such detection approaches are presented in Chapter 2.
1.2.5 Other Tools and Techniques Firewall log analysis is an effective way to search for malware threats and attacks. For example, by blocking certain ports like 135-139, 445 etc. and logging the results can lead to gathering of information regarding infected hosts inside the network. Firewalls can be configured and high amount of blocking with corresponding logging is likely to show interesting results. Thus, firewall logging is an indispensable part of in depth network security. A packet sniffer or a packet analyzer is a program or a hardware that is used for logging network packets passing through a particular part of the network within its visibility range. Thus, a packet sniffer helps in analysis of network security threats through presentation of various 8
information regarding logged packets in human readable form. Sniffers are mostly used when there is a target such that a filter expression can be generated targeting the culprit. Most commonly used open sourced sniffers are tcpdump [15] and wireshark [61]. Sniffers are important tools for security analyst to understand any real world network problems including botnets. An Intrusion Detection System (IDS) is an automated system for sending alerts to an operator about any unauthorized access or penetration of the computer system [73]. IDSes can either be classified as Host Based (HIDS) or as Network Based (NIDS). HIDS runs on individual hosts to monitor activities of different application running in the system, system configuration, system file status, etc. in order to detect breaches from its normal course of operation. NIDS mostly gets its results through analysis of network packets passing through external interfaces that separates the protected hosts from the rest of its network. One of the popular commercially available IDS is RealSecure from Internet Security Systems (ISS) [80]. Classical IDSes can detect a simple hacker break-in, but cannot always be relied upon for botnet detection. Bot can compromise victims through downloading of malicious attachment to an email, which are often not detected by IDSes. Moreover, a bot can stay calm in an infected host and become active on a specific date only or under specific conditions only [69].
1.3 Flow based Approaches for Machine Learning A network flow provides essential information in a network like who is talking to whom i.e. conversation between hosts on the network. A network flow is defined by combination of following five tuples: [35]. Moreover, C&C channels are the weakest links inside botnet architectures. If C&C channels are identified and annihilated the corresponding botnet would automatically become ineffective. 9
Some approaches of network traffic analysis include analysis of communicating ports and packet‘s payload analysis [81]. However, such approaches have many drawbacks. The portbased approach is least reliable since thousands of network applications now a day‘s do not use registered TCP/UDP ports. Similarly, packet‘s payload analysis involves problems in working with encrypted traffic and involves a high amount of privacy issues. Therefore, a flow based approach through identification of significant flow-level features, which are nothing but aggregations of packet-level features in that flow, can overcome these difficulties for proper analysis of network traffic. Therefore, the design goal in this research revolves around identification of C&C flows. The research output presented in this thesis is about application of machine learning and data mining based approaches in predicting P2P botnet flows. The main underlying assumption is that the P2P botnet flows are characteristically different from normal web traffic, including that of normal P2P flows. Unique characteristics of P2P bots can be outlined as follows: A bot is a program and therefore every command issued by a bot in its normal C&C operations is followed by a response from either a server in its hierarchy in the botnet or from some other bot in its peer group. In other word, C&C interactions in P2P botnets must follow a strict command-response pattern. The C&C interactions of bots within a botnet are preprogrammed and are always bounded by a specific set of commands [52]. Also, a P2P bot needs to keep communicating to have their malicious network working. That is, a P2P bot needs to keep itself updated about other bots that are still active in its network. In normal C&C operations P2P bot establishes numerous small sessions [41]. More specifically, they keep changing communicating ports for normal C&C interaction or until they launch attack. Therefore, the number of packets in each of the bot generated flow during normal C&C operation is usually small. Finally, it is observed that the packets in bot generated flows are
10
small in size. Moreover, among the few packets transferred in a bot flow only one or two packets carry highest bytes, whereas, the normal P2P traffic carries most of the packets to the size of the Maximum Transmission Unit (MTU). The resiliency achieved by botnets through adoption of peer-to-peer protocol can be effectively countered only through development of efficient machine learning and data mining based approaches for detection of its C&C traffic. It is also imperative to develop a proactive, real time botnet detection mechanism for annihilation of new botnets at its formative stage. The term ‗new botnet‘ means botnet whose architectural design, behavior, etc. is yet to be studied by security researchers. The term ‗real-time‘ in case of proactive botnet detection refers to detecting new and active botnets in the internet. Proactive detection is important because it will lead to annihilation of bots in its infancy. On the other hand, reactive techniques refer to detecting botnets while it is involved in attacks. However, there exists an arbitrarily long time gap between set-up of a botnet and its use in launching cyber attacks [71]. The technique proposed in this dissertation can be used to detect new P2P bots in its C&C phase in real-time.
1.4 Motivation Behind the Work The botnet is the most dangerous network application the Internet community has ever faced. The problem is global in scope and in itself a tremendous force multiplier for organized crime [66]. Many of the botmaster schemes to recruit new bot client targets defenseless innocent computer users with low competency in handling computer applications in a secure way. A malicious bot can be seen as a combination of worms, rootkits and Trojan horses because of its ability to autonomously propagate further across the network, feature key logging and backdoor functionalities. Use of more general and advance mode of communication like P2P for botnet
11
C&C has added resiliency to its structure. There is a huge deficit in research for detection and tracking of botnets when compared to the enormity of the problem [50]. One of the most common and brutal form of attack by botnet is a distributed denial-ofservice (DDoS) attack. A DDoS attack is one in which a large number of compromised systems sends spurious traffic to a single target, thereby causing denial-of-service for users of the targeted system. The large volume of incoming network traffic forces the target system to shut down, thereby denying service to the legitimate users [1]. The targets may be market rivals or competitors or anyone on the Internet whose service the botmaster wants to disrupt. The threat posed through DDoS attacks is huge which can disrupt major corporations or even nations. The reasons for launching such an attack includes political motivations, industrial espionage, to commit financial crime and as a form of blackmail [4]. Botnets cause huge financial losses every year. At 2013, the cost to the world was estimated to be in between $375 to $575 billion [14]. According to a report published in 2014 [7], financial implication of botnet attacks has been estimated to have caused a loss of more than $113 billion globally. A resilient P2P botnet called Gameover Zeus was estimated to have stolen more than $100 million in USA alone [11]. Moreover, the mobile version of Zeus (ZITMO) has stolen an estimated $47 million, from over 30,000 customers across more than 30 banks in Europe in summer 2012 [13]. Cybercrime fighters from USA and Europe have recently taken down a 12,000 computers strong botnet called Beebone botnet [12]. Malware spread by this botnet included cryptolocker programs that encrypted users‘ personal files and demand a ransom to restore them and fake antivirus programs that demanded money to clean an infected computer of the malware it placed earlier. According to FBI, hackers are developing increasingly sophisticated attack strategies that let them infect as many as 18 systems per second with their botnet armies [10].
12
The worst kind of DDoS attack recorded in 2013 was against the Spamhaus project, an international anti-spam organization based in Europe. The attack traffic was as high as 300 Gbit/s [4]. This ultra-heavy attack traffic resulted in congestion of networks across Europe. From 2012 to mid-2013, several banks in South Korea, USA, Brazil and Hong Kong were hit by DDoS attacks, among which the DDoS attack on the Bank of America (BOC), the traffic generated peaked at 70 Gbit/s. Among several purposes of initiating such attack against banks, DDoS attacks can be used for obscure activities such as the theft of valuable financial information. When there is a heavy DDoS attack traffic, web-protected security devices have insufficient processing capabilities to defend against it, and hackers use this opportunity to invade the system. Another major DDoS attack in 2013 has specifically targeted WordPress sites [5]. It brought down providers like HostGator and BlueHost. Similarly, according to an excerpt from a statistical report on botnet-assisted DDoS attacks [6], ―DDoS Intelligence statistics collected from 1 January to 31 March 2015 (or Q1 2015), which is analyzed in comparison with the equivalent data collected within the previous 3-month period (1 October to 31 December 2014, or Q4 2014), in Q1 2015, 23,095 DDoS attacks were reported, targeting web resources in 76 countries. However, this is 11% lower than the 25,929 attacks reported in Q4 2014. In Russia, South Korea and France, the number of attacked web resources has increased in Q1 2015 compared with Q4 2014. In Q1 2015, the maximum number of attacks carried out on the same web resource reached 21, which is a Russian language website‖. However, the USA, China and Canada remained the top three countries where web resources are most frequently targeted using DDoS attacks. Hackers are also changing tactics to amplify the chaos caused by DDoS attacks. One of the notable transitions is to use Distributed reflective Denial of Service (DrDoS) attack [5] instead of
13
DDoS attack. DrDoS is helping attackers launch huge volumetric attacks exceeding 100 Gbit/s. Popularity of SmartPhones is also giving rise to appearance of DDoS attack from mobile devices (mDDoS). Predominantly, Firewalls and Intrusion Prevention System are the basic software or devices used by IT security teams against DDoS attacks [2]. But it has been observed that these DDoS mitigation devices prove to be ineffective when there is a major threat or attack. In most organizations, Blackholing and Sinkholing are used as an improved DDoS solution with the purpose to prevent the threats and protect the systems. Blackholing and Sinkholing are the options in case of severe DDoS attacks [3]. In case of Blackholing — all the traffic and requests are redirected to a non-existing server or a null interface. This brings the website down, but relives the pressure on the server. On the other hand, Sinkholing redirects all traffic and requests to a valid server that logs some statistics and then drops the bad packets. Sinkholing can help developers establish attack patterns. These are the techniques to mitigate an attack by filtering and discarding attack traffic, which can minimize probable damages. Spamming is another common form of attack by botnets. In 2012 a major spam producing botnet called Grum, responsible for some 18% of spam sent worldwide was taken down [8]. Not only desktop computers, conventional laptops or mobile devices, but anything connected to the Internet can be converted to attack vectors. First, Internet of Things (IoT) based botnet attack was discovered in 2014 [9], involving more than 750,000 malicious email communications generated through compromised consumer gadgets such as home-networking routers, connected multi-media centers, televisions and at least one refrigerator numbering more than 100,000 in count has been used as a platform to launch attacks. IoT based botnets would be a major security
14
risk in future, as according to a prediction more than 200 billion things will be connected via the Internet by 2020. Statistics of global botnet attacks depict a gloomy picture. However, often success rests on destroying the enemy‘s ability to attack, which can aptly be described with the adage ―the best defense is a good offense‖. This automatically underscores the need for early detection of botnets before attacks are launched. All these havocs the botnets have been creating in the world have strongly motivated us to carry out the work reported in this thesis.
1.5 Problem Definition The resiliencies provided by peer-to-peer networks are exploited by most existing botnets in real world environment. Command-and-control (C&C) traffic generated by P2P bots is mostly used for transmission of botnet commands within the P2P network. This results in uniformity in traffic pattern in botnet C&C traffic flow. In contrast, other network involves various data types, such as files, e-mails, web contents, real-time audio/video data streams, etc. Therefore, the data captured from various Internet applications, are found to be nonuniform in terms of volume, time, etc. and in many cases is also unidirectional in nature. The work undertaken in this thesis is summarized below:
Real-time detection of botnets in peer-to-peer network with the help of machine learning based algorithms.
The self learning capability of machine learning techniques has been proposed to be used to develop the framework for real-time botnet detection.
It appears to be useful for the entire automation of the process of botnet detection.
15
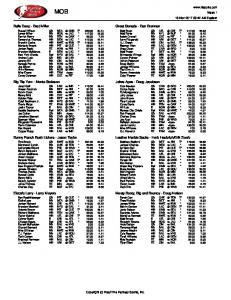
1.6 Solution Strategy The solution strategy for the botnet detection framework presented in this thesis has been shown in the Figure 1.2 below.
Phase -1
Phase - 2
Phase -3
Phase -4
Dataset preparation
Feature Selection
Classification
Botnet Detection
Figure 1.2 Schematic diagram of the botnet detection framework Phase 1-Dataset Preparation: Network flow based datasets are initially prepared from traffic flow features which are unique to the P2P botnet‘s characteristics and behavior. Features are identified from literature survey and analysis of P2P botnets traffic samples existing in a real world environment. Raw network traffic is processed to generate network flows in order to prepare initial datasets. This is followed by removal of unwanted flows and scaling of the dataset. Phase 2-Feature Selection: Selection of features is essential for classification/clustering of botnet C&C flows. Depending on the importance of the features in classification/clustering task at hand, a feature is either considered or removed. Phase 3-Classification: Efficient models for classification have been developed by using SVM, C4.5 and FURIA machine learning algorithms. Phase 4-Botnet Detection: A framework for real-time detection of new botnets has been developed. In this framework, Expectation-Maximization (EM) clustering algorithm and Jaccard similarity coefficients are used.
16
1.7 Objectives Enormous amount of threats generated by botnet activities is an essential indicator to develop a proactive real time botnet detection approach. Moreover, automation of the process of identification and annihilation of botnet C&C traffic flows is very important. From the literature survey, it has been found that no such comprehensive approach has yet been developed. Based on these surveys, the objectives of this research work are outlined as follows: i)
To develop a proactive real-time botnet detection mechanism.
ii)
To automate the process of annihilation of the botnet C&C flows.
iii)
To develop a payload independent botnet detection approach and has the capability to detect even in encrypted channels.
iv)
To evaluate the performance of the proposed mechanism for its superiority.
1.8 The Work Done The work done in this thesis offers some improved approaches for classification and clustering of botnet C&C flows so that a concrete framework for detection of P2P botnet‘s C&C flows can be proposed. Following are the highlights of the work done in this thesis along with relevant justifications: Firstly, an optimum classification model using Support Vector Machine [78] has been proposed and implemented for classification of P2P botnet C&C flows, based on a set of botnet characteristic features and flow level features. SVM based classification of P2P botnet C&C flows have not been explored exhaustively by the researchers. Moreover, model selection using SVM kernel parameters has yet not been applied for classification of network flows. Saad et. al. [36] had already shown that the selection of SVM in similar classification problem has produced better results. The SVM classification model has been built using Radial Basis 17
Function (RBF) kernel given by K(xi,xj)=exp(-γ||xi-xj||2 ), γ>0 , where xi and xj are input to the kernel function for mapping into a higher dimensional feature space and γ is the specific RBF kernel parameter. A model selection process is carried out to identify the best classifier depending on the exponentially growing sequence of the SVM parameter C and RBF kernel parameter γ (gamma). Detailed procedure has been discussed in Chapter 4. Secondly, an investigation has also been carried out to obtain a rule based classifier and subsequent derivation of rules using flow level features. Furthermore, a novel rule induction method has been proposed to obtain a generalized set of rules for detection of C&C flows belonging to bots of a particular P2P botnet. Initially, botnet traffic classification models have been generated by applying C4.5 decision tree algorithm [87] based on four most important flow level features as derived in Section 3.1. Then, an initial set of rules has been extracted from the trained C4.5 tree in consideration of test conditions in each path as conjunctive rule antecedents and corresponding class labels as rule consequences. Finally, a rule induction method has been proposed for further generalization of the extracted rules. Thirdly, since the rules inferred from C4.5 algorithm depends on crisp boundaries that lead to abrupt transition between the two classes, further investigations have been carried out to obtain fuzzy rules, where its support for a class to decrease from ―full‖ (inside the core of the rule) to ―zero‖ (near the boundary) in a gradual rather than an abrupt manner. Accordingly, a fuzzy based classification approach using Fuzzy Unordered Rule Induction Algorithm (FURIA) [54] has been proposed. Here, the fuzzy rules are extracted from datasets prepared with 10 flow level features, as discussed in Section 3.1. Finally, to widen the scope and application of the proposed work, an attempt has been made to develop a botnet detection framework to detect unknown flows from new P2P botnets. The
18
proposed framework has been developed by using Expectation Maximization (EM) clustering algorithm [83, 88] and Jaccard Similarity coefficients [26]. Initially two clusters are generated using EM clustering algorithm for network traffic flows captured from each suspected machine. Clusters are generated by using five botnet flow features. Since, most of the bot flows in P2P bot will be in the larger cluster, it can be assumed that the size will usually be much higher than the other cluster. Considering this as an initial indication of the host being probed is a probable P2P bot, only the larger cluster has been considered for further investigation and to remove duplicate entries. The reduction in the size of the cluster is then estimated. If high reduction is achieved, it is considered to be an indicator towards detection of P2P bot. Finally, Jaccard Similarity coefficients [26] have been calculated between sets derived from the majority clusters. Higher the Jaccard similarity coefficient value, more is the chance that the bots belong to the same P2P botnet.
1.9 Organization of Thesis The thesis is organized as follows. A survey of the existing works on botnet detection is presented in Chapter 2. The chapter also includes a comparative analysis of existing works and a brief description of the future challenges of botnet detection. The procedure adopted for dataset preparation and feature selection is discussed in Chapter 3. The broad methodology adopted to achieve proactive and real-time detection of botnets is also described in Chapter 3. Classification of botnet C&C traffic using Support Vector Machine is proposed in Chapter 4. In Chapter 5, a rule induction algorithm for decision tree based classification model has been proposed. In Chapter 6, a fuzzy rule based classification model has been proposed. In Chapter 7, a botnet detection framework through similarity analysis of clusters has been proposed. Finally, conclusion, limitations and future scope of the research work has been outlined in Chapter 8.
19
Chapter 2 Literature Survey 2.1 Introduction Botnet detection and tracking is the area that has attracted many researchers in recent years. Due to inherent drawbacks of signature and anomaly based techniques; many recent works propose machine learning and data mining based techniques. A survey of machine learning and data mining based research works on botnet detection is presented in this chapter.
2.2 Detail Analysis of Botnet Detection using Machine Learning and Data Mining based Approaches 2.2.1 IRC based Botnet Detection One of the earliest machine learning based approach for IRC botnet detection has been proposed by Livadas et. al.[71]. It is a two stage flow classification based on ten flow characteristics. In the first stage, it is the classification between chat flows and non-chat flows and in the second stage it is the classification between botnet infected IRC flows from that of real IRC flows. Among the machine learning tools, Decision Tree, naïve Bayes and Bayesian Network classifiers are used. Naïve Bayes classifier produced the best result that accurately classified 35 out of 38 botnet testbed IRC flows with a False Negative Rate (FNR) of 7.89%. In another approach for detection of IRC botnets, the classification framework by Lu et. al. [53] first classifies unknown application in current network into different application communities 20
such as chat community, P2P community, Web community, etc. and then focusing on each application community it applies temporal-frequent characteristics of network flows to differentiate the malicious botnet behavior from the human generated normal application traffic. This framework achieves an average accuracy rate of 91 % in classification of network flows into different application communities. Though the system claims to achieve 100 % accuracy in detecting IRC botnet flows, it also suffers from a false positive rate of 0.016. Lin et. al. [21] proposed a classified model by combining Artificial Fish Swarm Algorithm (AFSA) and Support Vector Machine (SVM). By using bioinspired optimization algorithm AFSA for choosing the best set of features, the proposed method achieves a classification accuracy of above 99%. Masud et. al. [64] proposed a flow based approach to classify C&C and normal flows to learn temporal correlation between an incoming packet and one of the following logged events: (i) an outgoing packet (ii) a new outgoing connection and (iii) an application startup. Any incoming packet correlated with one of these logged events is considered a possible botnet command packet. Classification task has been performed using Support Vector Machine (SVM), Bayes Net, Decision Tree (J48), Naïve Bayes and Boosted Decision Tree (Boosted J48). This approach tested on two IRC botnets (SDBot and RBot) has produced accuracy > 99 % across all classifiers.
2.2.2 P2P based Botnet Detection With the adoption of more general and resilient Peer-to-Peer (P2P) as the C&C communication protocol by botnet operators, many contemporary security researchers shifted their attention to the detection of such ubiquitous networks. Noh et. al. [57] proposed a Markov chain framework based model constructed using flow clusters which represent each of the phased flows of the attack traffic for detecting P2P botnets. The final detection engine is based
21
on the method of model matching using the likelihood ratio. The model has been tested on SpamThru, Storm and Nugache botnets. The detection rate of the model is 96.15 % for SpamThru, 100 % for Storm and 95 % for Nugache. Masud et. al. [51] proposed a stream data classification algorithm for detection of P2P botnet. Based on two important properties of botnet traffic i.e. infinite length and concept drift, a multi-chunk, multi-level ensemble classifier have been proposed to classify concept-drifting stream data. The ensemble approach keeps the best K * v classifiers, where a group of v classifiers is trained with v overlapping partitions of r successive data chunks. Here, parameter v determines the number of partitions, parameter r determines the number of chunks and parameter K controls the ensemble size. It is a generalization over previous ensemble approaches where a single classifier is trained with a single data chunk. Thus, using this approach better classification accuracy has been obtained over the single-partition single-chunk approach and other classification approaches. For example, for chunk size 250, this approach produces 19.9 % error, whereas for single-partition singlechunk approach the error is 26.1 %. Liu et. al. [45] used macroscopical features of network streams like paroxysm and distribution to detect P2P nodes, followed by use of K-means clustering algorithm to cluster P2P applications. The P2P-botnet detection model is based on P2P-nodes detection algorithm, P2P-nodes clustering algorithm and botnet behavior similarity detection algorithm. Finally, similar suspicious actions from the network streams of the nodes in one P2P application has been analyzed to precisely detect if a P2P application is a P2P botnet. Liao et. al. [41] applied research on the original dissimilarity of P2P botnet differing from normal internet behaviors such as percentage of small packets, percentage of small sessions etc. as parameters for data mining. The proposed framework is based on three hypotheses: communication via P2P botnet imitated P2P structure to set up numerous sessions, bot sessions
22
kept on transmitting data to maintain the malicious network works and botnet communication used data at minimum level as much as possible to keep its privacy. Accuracy of the three classification algorithms Decision Tree, Naïve Bayes and Bayes Net were 98 %, 89 % and 87 % respectively. Li et. al. [33] proposed yet another P2P botnet detection framework by identifying similar patterns of P2P botnet flows such as outbound network degree, connection failure rate etc. that occurs at irregular phased intervals. It is called Irregular Phased Similarity (IPS) and used it to determine flow clusters. Then a distance is derived between such flow clusters and compared it with a threshold value for the distance to determine the number of flow clusters that are closer. Finally the ratio of similar clusters is measured and compared it with a predefined threshold to identify a suspicious P2P bot. This threshold is conservatively set at 0.5. When the ratio of close distances and all distances is larger than this predefined threshold, the host is considered to be a suspicious P2P bot. The detection accuracy for Waledac botnet is 86 % using this approach. Rahbarinia et. al. [27] proposed PeerRush, a generic classification approach that can accurately detect different types of legitimate and P2P botnet applications. An application profile is initially created by learning traffic samples of known P2P applications. The network traffics generated by P2P hosts within the monitored network are matched with the learned application profile for accurate detection and categorization of P2P applications. The system achieves 99.5% true positives and 0.1% false positives in the detection of all considered types of P2P traffic. Saad et. al. [36] also proposed a model that focuses on a proactive measure for detecting P2P botnet using five machine learning algorithms, i.e., Support Vector Machine (SVM), Artificial Neural Network (ANN), Nearest Neighbors Classifier (NNC), Gaussian-Based Classifier (GBC), and Naive Bayes Classifier (NBC). The features set of the model has been built using information on payload size, number of packets, duplicated packet length and
23
concurrent active ports. The detection accuracy is above 90% for Support Vector Machine, Artificial Neural Network, and Nearest Neighbors Classifier. Tarng et. al.[37] proposed a mechanism to quickly identify P2P botnet traffic flows during the connection stage. Response to Intervention (RTI) method is used to observe the traffic flows of normal P2P applications and P2P botnets. Then, decision tree model for classification and K-Mean clustering algorithms have been used and information obtained were used for identification of abnormal traffic flows and the location of zombie computers. Zhao et. al. [34] proposed a machine learning based classification scheme for detection of P2P botnets based on a set of network traffic attributes derived from observed network flows during selected small time windows. Bayesian Network and Decision Tree classifiers have been used with 12 selected traffic attributes. The best detection rate is obtained at a time window of 180 seconds, although an effective detector can still be produced with a time window of 10 seconds only. Hang et. al. [30] proposed Entelecheia, an approach of P2P botnet detection using graph mining through exploitation of ―social‖ behavior of the botnet during its waiting stage. This has been done using two broad steps. Initially a graph is created through network-wide interactions of hosts and then hosts are filtered and clustered based on flow information. Entelecheia has been tested for detection of two P2P botnets and achieved a 100% detection rate for Storm and 87% for Nugache. Singh et. al. [20] used open source tools like Hadoop, Hive and Mahout to develop a Machine Learning based peer-to-peer botnet detection framework. A scalable and distributed framework capable of processing high-bandwidth network traffic using Mahout (a machine learning library built on the top of Hadoop) has been proposed. The Random Forest algorithm has been chosen to develop the machine learning model. The classifier achieved an accuracy of 99.7 % with 0.998 True Positive Rate and 0.003 False Positive Rate for malicious traffic. Narang et. al. [23] proposed a
24
conversation based botnet detection technique called ―PeerShark‖. PeerShark is a Port oblivious and Protocol oblivious technique that uses supervised learning algorithms. However, PeerShark begins with the standard 5-tuple flow based approach to cluster flows into diverse behavior based categories and allows creation of 2-tuple ‗conversations‘ out of these flow clusters. The x-means clustering algorithm has been used for clustering of flows. The framework has been trained and tested with labeled data from 4 P2P applications along with Storm and Waledac botnets. The trained models are also evaluated against the Zeus and Nugache botnet datasets, which were not a part of datasets used in training the model. Classification models have been built with decision tree, random forest and bayesian network algorithms. The detection accuracies of the decision tree based classification model are 98% and 85.71% for Zeus and Nugache botnet test sets. In the random forest based model, the corresponding percentage of accuracy are 98.76% and 87.76%. Similarly for the bayesian network based model, the corresponding percentage of accuracy are 96.69% and 97.96%. Zhang et. al. [24] proposed a scalable botnet detection system that first identifies all hosts that are likely to engage in P2P communications and then derives statistical fingerprints to profile P2P traffic so that P2P botnet traffic can be distinguished from legitimate P2P traffic. Therefore, this botnet detection system has two phases. The first phase implements a pre-filtering step to discard network flows that are unlikely to be generated by P2P applications. In the second phase, the system analyzes the traffic generated by the P2P clients and classifies them into either legitimate P2P clients or P2P bots. Specifically, active time of a P2P client is investigated and it is identified as a candidate P2P bot if it is persistently active on the underlying host. Then the overlaps of peers contacted by two candidate P2P bots are analyzed further to finalize detection. This final step uses a two step clustering approach. In the first step clustering, K-mean clustering algorithm has been used to aggregate network flows into K sub-clusters, and
25
each sub-cluster contains flows that are very similar to each other. In the second step clustering, the global distribution of sub-clusters are investigated with hierarchical clustering and further group similar sub-clusters into clusters with Davies Bouldin validation. The detection rate of the proposed system is 100% and 0.2% false positive rate.
2.2.3 Structure Independent Approaches for Botnet Detection Botnet C&C channels can use different communication protocols. Based on the underlying command and control architecture, botnets can be classified as IRC-based, HTTP-based, DNSbased or Peer to Peer botnets. However, recent botnets like Waledac and P2P Zeus are having hybrid structures. Apart from having P2P layer of the overall botnet architecture they always reach out to central components for specific services. To reach out to central components they rely on HTTP or DNS protocol. Structure independent approaches are the botnet detection techniques that are independent of these communication protocols and will remain effective even though botmaster change their C&C communication protocol. Gu et. al. [60] proposed BotMiner by grouping similar communication activities in the CPlane (C&C communication traffic) and grouping of similar malicious activities in the A-Plane (activity traffic). Cross cluster correlation is then performed between these two clusters to identify hosts sharing similar communication patterns and similar malicious activities such as scanning, spamming, exploiting etc. Hosts sharing similar communication patterns and similar malicious activities are declared as bots in the monitored network. The accuracy achieved is around 99% with a false positive rate of 0.3%. Zhao et. al. [28] proposed botnet detection approach through behavior analysis of network flows by splitting them into multiple time windows and then by using a set of attributes extracted from this analysis to perform machine learning based classification of malicious (botnet) and non-malicious traffic. Several machine
26
learning techniques has been investigated in this research, including Bayesian Network, Neural Network, Support Vector Machine, Gaussian and Nearest Neighbor classifier, Naïve Bayes and Decision Tree. Further evaluation has been done with the decision tree using the Reduced Error Pruning algorithm (REP Tree). Experimental evaluation under various settings shows that the true positive rate is over 90% for this detection model and the false positive rate is below 5%. Dietrich et. al. [29] proposed CoCoSpot, using message length sequence, the underlying carrier protocol and encoding properties to group similar botnet C&C channels and to derive fingerprints of C&C channels. These three key features identified from network traffic data models are initially used to compile clusters of similar C&C flows using Hierarchical clustering algorithm. Clustered C&C flows are then manually verified and labeled, which serves as training data for subsequent classification of flows. A centroid is computed for each cluster and a nearestcluster classifier is designed which can classify unknown flows based on these centroids. This approach can recognize more than 88% of C&C flows with a false positive rate of less than 0.1%. Huseynov et. al. [22] proposed a bio-inspired computing technique called Ant Colony Clustering (ACC) for detection of botnet attacks. Feature cluster of botnet traffic has been identified using ACC-based unsupervised-learning algorithm. Adaptive Time Dependent Transporter Ants Clustering (ATTA-C) is used for clustering botnet traffic.
2.3 Research Gaps and Proposed Improvements In order to find the overall research gap, some of the most cited Machine Learning and Data Mining based detection approaches are compared in terms of six expected requirements for botnet detection. The six expected requirements are stated as follows : 1) whether the proposed botnet detection approach has the capability to detect botnets using encrypted communication channels, 2) whether the proposed botnet detection approach can detect botnets in real time 3) whether the 27
proposed botnet detection approach can detect botnets with low false positive rate 4) whether the proposed botnet detection approach can detect solitary bot in a network 5) whether the proposed botnet detection approach can detect previously unknown botnets and 6) whether the proposed botnet detection approach can detect botnets in large-scale and high speed network environment . The result of comparison is shown in Table 2.1, and it is found that only BotMiner proposed by Gu et. al. satisfies all of the six requirements. However, BotMiner has some serious shortcomings as discussed later in this section. In Table 2.1, ―√‖ means that the detection requirement is satisfied in the proposed solution. Table 2.1: Comparison chart for botnet detection techniques Ref No.
Author and the year of Publication
[71] Livadas et. al., 2006 [51] Masud et. al., 2009 [41] Liao et.al., 2010 [36] Saad et. al., 2011 [33] Li et. al., 2012 [27] Rahbarinia et. al., 2013 [28] Zhao et. al., 2013
Encrypted Communi -cation Detection
Real – time Detection
Low False Positive
√
√
√
√
×
√
√
×
√
√
×
√
√
×
×
√
×
×
√
√
×
√
×
×
√
√
×
×
√
×
√
√
√
√
×
√
√
√
×
√
√
×
28
Solitary Unknown Bot Bot Detection Detection
Botnet detection capability in largescale & high speed network environment
[29] Dietrich et. al.,2013 [60] Gu et. al., 2008 [53] Lu et. al., 2009 [57] Noh et. al.,2009 [45] Liu et. al., 2010 [37] Tarng et. al., 2011 [34] Zhao et. al., 2012 [30] Hang et. al.,2013 [20] Singh et. al.,2014 [21] Lin et. al., 2014 [22] Huseynov et. al., 2014 [23] Narang et. al. 2014 [64] Masud et. al., 2008 [24] Zhang et. al.2014
√
×
√
×
√
×
√
√
√
√
√
√
√
√
×
√
√
√
√
×
×
×
√
×
√
×
×
×
√
×
√
√
√
×
√
×
√
√
√
√
×
×
√
√
×
×
√
√
√
√
√
×
×
√
√
×
√
√
×
×
√
×
×
×
×
√
√
×
×
√
√
√
√
√
√
√
√
×
√
√
√
×
√
√
An effective botnet detection approach needs to address the six basic requirements stated in Table 2.1. Nevertheless, the machine learning and data mining based research works are analyzed further to find issues and research gaps that can be addressed through an improved detection model. Major research gaps found from the works reviewed in this section are outlined below:
29
2.3.1 Research Gaps from IRC based Botnet Detection Approaches The botnet detection approach proposed in [71] can detect only IRC based botnets. The detection approach could fail whenever the botmaster improves its underlying architecture to adopt a more resilient communication protocol such as P2P. Moreover, the classification of IRC flows as either botnet or legitimate IRC flows require labeling of flows used to train the classifier. The proposed approach uses two methods to label the flows as suspicious and nonsuspicious, i) testbed based implementation of a known existing IRC botnet, ii) the telltales of hosts being compromised. Therefore, this approach can either be used only for detection of already known IRC based botnets or has to depend on some other method to identify compromised machines. Another botnet detection approach called BotCop [53] has been tested for detection of IRC based botnets only. The main underlying strength of this detection approach is the temporal-frequent characteristics of network flows, which are more likely to be differentiable where human players are involved. Therefore, in case of botnets using chat based protocols like IRC, where network flows are generated both by human users and malicious bot application, the temporal-frequent characteristics of network flows can effectively classify bot applications. But, as the botnet moves on to adopt other communication protocols where normal network traffic is also generated by other similar web applications, the temporal-frequent characteristics may not be of much help. The botnet detection approach proposed in [21] has also been tested on IRC based botnets only. Moreover, the approach uses machine learning algorithm which requires prior training of the detection model, seriously limiting its ability to detect unknown botnets. The botnet detection approach proposed in [64], uses temporal characteristics of the logged events. It is therefore more suitable for detection of IRC based botnets where benign traffic is generated by human chatting activities. If the botnet starts using non-IRC
30
protocols (e.g. P2P), these command-response timing relationships are more likely to become indistinguishable between bots and benign applications. Moreover, if a non-IRC bot application mimics other benign applications, this detection approach is most likely to fail. Botnets based on IRC protocol are not very resilient in structure and can easily be taken down whenever the C&C servers gets detected by tools deployed by security researchers. Moreover, IRC is not a common protocol and hence it is difficult for botmaster to keep the C&C communications indistinguishable from legitimate network flows. This is also true for the fact that most of the legitimate network traffic using IRC protocol is generated by human users.
2.3.2 Research Gaps from P2P based Botnet Detection Approaches The framework proposed in [57] specifically for detection of P2P botnets suffers from high false positive rate. For the three P2P botnets tested using this model the difference in detection rate is as high as 5%. The botnet detection approach proposed in [51] needs to label the existing data chunks to train classifiers. This means that the proposed approach will not be able to detect new botnets. Shortcoming of the approach is also observed in the ensemble updating process when a group of new data points appear may be due to a concept-drift. The ensemble updating process is delayed until the data points in the most recent data chunk have been labeled and old ensembles are used for classifying the new unlabeled data points till then. Two drawbacks are observed about this ensemble updating process: i) there is a delay in the process of labeling new data points, which means that real time detection of botnets may not be possible, ii) ensemble updating process depends on alarm raised against false negatives generated for misclassification of new data points by classifiers trained on old ensembles. This is a reactive approach of updating the ensembles, which may not be always successful. In the P2P botnet detection framework proposed in [45], similarity analysis of suspicious behavior of bots from a net stream
31
is the main criteria for detection. The drawbacks of this approach are: i) it is a reactive approach because it relies on identification of suspicious stream behavior of bots. But in reality, a bot can remain silent for long periods inside an infected machine and can become active only on a specific date and time. ii) The threshold value (CR) used in the detection algorithm, is calculated from known P2P botnets. The behavior similarity (R) of nodes in a new and stealthy P2P botnet can be less than the known threshold value at the moment. This will increase the number of false negatives. The framework for P2P botnet detection proposed in [20], [36] and [41] are primarily based on machine learning algorithms, which require labeled P2P botnet data to train a statistical classifier thereby drastically limiting its ability to detect new botnets. The P2P botnet detection framework proposed in [33] is dependent on number of thresholds on the coarse-grained selection to remove the hosts that are impossible to be P2P botnet nodes. The threshold values are set for most important parameters like outgoing degree threshold (20/min) and failed rate threshold (20%) in a specific search time window. Furthermore, to identify similar or closer flow clusters also a threshold value (0.5) has been set conservatively. However, the detection framework has been tested only on the Waledac botnet with 86% accuracy and not on stealthy botnets like P2P Zeus. The generic P2P application detection framework PeerRush [27] is limited by its knowledge of previously observed and modeled botnet families in order to divulge the identity of a specific P2P botnet type used for compromising a particular host. The P2P botnet detection framework proposed in [37] was not tested on recent and stealthy P2P botnets like P2P Zeus. The P2P botnet detection approach in [34], does not count for novelty detection. Novelty detection refers to the capacity to detect unknown data about which the detection was unaware of during the model construction phase. Furthermore, accuracy rates have been estimated taking into consideration different time windows for two similar and common P2P
32
botnets Storm and Waledac, while stealthy P2P botnet like P2P Zeus is yet to be tested. Botnet detection approach proposed in [28] is an effort to improve upon the detection approach proposed in [34]. In order to introduce novelty in botnet detection, two new HTTP based botnets Weasel and BlackEnergy were tested. However, the test results on Weasel botnet have produced a false positive rate of 82%. A graph-based botnet detection approach called Entelecheia [30] has been tested on two P2P botnets namely Storm and Nugache. While the framework could detect Storm with 100% accuracy, Nugache could be detected with only 87% accuracy. Therefore the framework needs to be tested with other recent and stealthy P2P botnet traces particularly P2P Zeus. The P2P botnet detection approach proposed in [23] relies on ‗behavioral‘ differences between P2P bots and benign P2P applications. If two bot-peers imitate a legitimate P2P application, this detection approach could fail. Furthermore, an imbalance in the difference of accuracy in detection is observed in classification results on unseen data. While the decision tree based classifier gives 98% and 85.71% accuracy for Zeus and Nugache botnets respectively, the same is 96.69% and 97.96% using bayesian network based classifier. There is a marginal decrease in the percentage of accuracy in detection of Zeus botnet and a substantial increase in percentage of accuracy of Nugache botnet (> 12%). The botnet detection approach proposed in [24], have the following research gaps: i) if two P2P bots relay queries from legitimate peers, their fingerprint clusters are unlikely to have large peer overlap. In such cases this detection approach could fail. ii) The botmasters could also reduce the number of peers contacted by each bot or increase the communication time gap significantly between peer bots. This will reduce the size of peer overlap and thus evade this detection approach. But the botmaster may not be interested to use this evading technique because this could have a serious negative impact on the efficiency and resiliency of the C&C infrastructure. However, the success of this detection
33
approach depends on the size of overlaps of peers contacted by two candidate P2P bots. If the size of overlap is not very large, this detection approach could fail. Analysis of existing works on P2P botnet detection shows that a highly efficient detection approach is yet to evolve for detection of resilient P2P botnets. Some detection approaches require prior knowledge of the P2P botnet and hence become ineffective against new botnets. Some approaches are reactive in nature and hence depends on the visibility of botnet activities, which is again hard to expect from a stealthy P2P botnet. There are also issues like reduction of false positive rates and improvement of detection accuracy. All these research gaps need to be handled carefully while trying to develop a detection framework for resilient P2P botnets.
2.3.3 Research Gaps from Structure Independent Approaches of Botnet Detection BotMiner [60] is the most efficient data mining based botnet detection approach proposed till date. However, its A–plane clusters similar malicious activities (or noisy activity), which means that the detection approach would be successful only when malicious activities are prominently observed. Unfortunately, the malicious activities may be stealthy and non-observable, thereby making BotMiner ineffective. Moreover BotMiner lacks proactive detection capability. The detection approach proposed in [29], involves manual labeling of candidate C&C flows before clustering. Clustering results are evaluated by checking if it corresponds to the labels that are assigned to training dataset. This manual labeling process is also dependent on detection of the malware samples by antivirus scanners. Following are the drawbacks of the manual labeling process: i) the detection process is likely to be slow as it involves manual verification, ii) since the labeling process is dependent on human judgments, erroneous C&C flows in the training data might result in high false positive rates, iii) many of the recent botnets uses anti-antivirus module 34
in order to skip antivirus detection and therefore, in such cases the manual labeling process could fail. Furthermore, the stealthy botnets using random message padding to most of its C&C messages will evade this detection approach. The detection approach proposed in [22] has significantly high false positive (23.5%) using ATTA-C algorithm. It can be observed that the structure independent approaches have some serious drawbacks. Drawbacks of BotMiner are so apparent that even though it looks appealing in theory, could be practically ineffective.
Manual labeling of candidate C&C flows and its
dependence on detection by antivirus scanners, actually makes the detection approach proposed in [29] unrealistic. In fact, it is the most arduous task to develop a structure independent approach, because the botmasters are at the forefront of adopting technologies to make their structure resilient.
35
Chapter 3 Feature Set Selection, Data Set Preparation and Methodology 3.1 Feature Set Selection Feature selection is an important issue that affects the accuracy of detection. The question of identifying useless, less significant and truly useful features is relevant because the accuracy of detection, the computational speed and the overall performance of the detection system can be significantly enhanced by eliminating useless features. In cases where there are no useless features, concentrating on the most significant ones possibly will improve the performance of the detection mechanism. Initial set of flow level features has been selected by carefully studying C&C behavior of P2P botnets. In line with contemporary research in detection of P2P botnets as discussed in the Chapter 2 literature review, eleven botnet flow and behavior characteristic features have been considered for the present study, as stated here under: i)
Total Packets Transferred (TPT): Number of packets transferred in a flow. It is a flow direction dependent attribute, i.e. the numeric value of the attribute may be different for command and response flows within the same pair of peer bots.
36
ii)
Largest Sized Packet (LSP): Size of the packet carrying maximum bytes in a flow. It is also a flow direction dependent attribute.
iii)
Total Bytes transferred with Largest Sized Packets (TBLSP) : It is the multiplication of the total number of the largest sized packets and the size of the largest packet.
iv)
Total Bytes Transferred (TBT): It is the summation of bytes transferred with all the packets in a flow. It is also a flow direction dependent attribute.
v)
Proportion of Largest Sized Packet (PLSP): It is the ratio of the largest sized packet transferred in a flow. It is also a flow direction dependent attribute.
vi)
Average Packet Length (APL): Average calculated for packet sizes of packets within a flow. It is also a flow direction dependent attribute.
vii)
Variance of Packet Length (VPL): Variance calculated for sizes of packets within a flow. It is also a flow direction dependent attribute.
viii)
Average Inter-arrival Time (AIT): Average calculated for inter arrival time between packets in a flow. It is also a flow direction dependent attribute.
ix)
Variance of Interarrival Time (VIT): Variance calculated for interarrival time between packets within a flow. It is also a flow direction dependent attribute.
x)
Response Packet Difference (RPD): Difference in number of packets between two responding flows. The numeric value of this feature is common for responding flows between a pair of hosts. In the case of unidirectional flows (i.e. Flow without a responding flow), a high numeric value 999 is used to represent values for this feature. This value is used because the maximum difference is of three digits in the datasets.
37
xi)
Response Time Difference (RTD): Difference in time of last packet received for two responding flows between a pair of hosts. The numeric value of this feature is also common for responding flows. In the case of unidirectional flow (i.e. Flow without a responding flow) a higher numeric value 99999 is used to represent values for this feature. This value is used because the maximum difference calculated in second is of five digits in the datasets.
A simple performance-based input ranking methodology has been applied to select truly useful features. A backward elimination procedure has been used to identify features that have significant effect on the performance of the classifier. One input feature is deleted at a time and the importance of the feature is determined by comparing the results of classification excluding it with that obtained by using all the features, and ranked accordingly as shown in Table 3.3. Table 3.1 shows the percentage of correct classification, true positive rate (TP) and false positive rate (FP) obtained vide equations (3.1) to (3.3) after elimination of a feature. The first row of the table show classification results by using all the 11 features. The second row of the table shows the result of classification after elimination of a significant feature LSP. By comparing the results shown in row 1 and row 2 of Table 3.1, the degradation in performance of the classifier as a result of elimination of LSP has been assessed. Then the heuristically selected features are eliminated one after another, till half the features are eliminated i.e. LSP, PLSP, APL, VPL and RPD. This feature subset is again assessed separately for its capability to classify the botnet traffic. First two rows of Table 3.2 show the result of this classification models. The second row shows the result by considering all these five features while the first row has one less feature. This shows the improvement in performance by considering five features instead of four features. Hence, it can be inferred that the classification model obtained using these five features
38
are as efficient as the one obtained using all the features. Therefore, this subset of features is considered to be one of the optimum feature subset. It has also been observed that inclusion of any additional features does not improve the classification results. Another feature subset that shows approximately efficient classifier is a combination of LSP, PLSP, RPD and RTD.
This
has been ahown in the last two rows of Table 3.1 and Table 3.2. The C4.5 decision tree classification algorithm, which heuristically chooses an attribute with maximum information gain to partition the data, has been applied for ranking the significant features and subsequent evaluation of the optimum subset. Table 3.1: Percentage of correct classification, true positive (TP) rate and false positive (FP) rate after specific attributes are removed Removed feature name None LSP LSP PLSP LSP PLSP APL LSP PLSP APL VPL LSP PLSP APL VPL RPD LSP PLSP RPD LSP PLSP RPD RTD
Nugache Percentage of Correct classification 99.655 99.195 99.185
Waledac Percentage of Correct classification 0.997 0.007 99.695 0.992 0.018 99.195 0.992 0.019 98.97 TP Rate
FP Rate
TP Rate
FP Rate
0.997 0.992 0.99
0.007 0.017 0.025
Zeus Percentage TP of Correct Rate classification 98.615 0.985 98.36 0.981 98.21 0.98
FP Rate 0.028 0.037 0.039
96.75
0.968 0.079 96.76
0.968
0.078
97.43
0.974
0.047
94.815
0.948 0.13
0.946
0.131
96.205
0.962
0.073
89.255
0.893 0.302 93.185
0.932
0.178
94.555
0.946
0.121
99.11
0.991 0.021 98.78
0.988
0.029
98.165
0.978
0.04
98.86
0.988 0.024 98.465
0.985
0.04
98.115
0.968
0.046
94.6
39
Table 3.2: Percentage of correct classification, true positive (TP) rate and false positive (FP) rate obtained for the subsets of features Used
Nugache
feature
Percentage TP FP Percentage TP FP Percentage TP FP of Correct Rate Rate of Correct Rate Rate of Correct Rate Rate classification classification classification
names
Waledac
Zeus
LSP PLSP APL VPL
99.6
0.996
0.007
99.24
0.992
0.021
98.28
0.983
0.039
LSP PLSP APL VPL RPD LSP PLSP RPD
99.65
0.997
0.007
99.495
0.995
0.013
98.71
0.987
0.023
99.6
0.996
0.007
99.29
0.993
0.019
97.808
0.978
0.049
LSP PLSP RPD RTD
99.655
0.997
0.007
99.495
0.995
0.011
98.135
0.981
0.034
Table 3.3: Rank list of significant features Feature Name LSP PLSP APL VPL RPD RTD
Rank 1 2 3 4 5 6
40
3.2 Data Set Preparation The benign traffic samples were collected randomly from windows machines using Wireshark [61]. The benign traffic samples include varied traffic such as HTTP, FTP, SMTP etc. including traffic captured from legitimate P2P applications. P2P file sharing by benign P2P applications involve rich web page transfers and normally carries packet to the size of MTU. Botnet C&C traffic samples were collected from the following sources: The Nugache botnet C&C traffic was obtained from Department of Computer Science, The University of Texas at Dallas. This is the same botnet traffic sample used in the botnet related research works of [51]. Similarly, Waledac and P2P Zeus traffic traces were obtained from Department of Computer Science, University of Georgia. These traces were also used in the botnet related research works of [27]. Bot packets and benign packets are collected from different networks. But, packets captured from all the networks are Ethernet packets and has the same MTU size. This is the primary reason for which the statistical features involving flow payload over a time (temporal characteristics) are given least preference while preparing the datasets. Furthermore, in the feature set selection approach described in Section 3.1, the temporal characteristics AIT and VIT having no impact on percentage of correct classification, true positive rate and false positive rate and hence are found to be of least significant in the detection models. In the process of creating the datasets, a Perl script [38] is used to extract flows from the three P2P botnet traces and the normal web traffic traces. A flow is defined by combination of following 5-tuples: . The packets having same value for these 5-tuples are aggregated into one flow. During the flow extraction process certain categories of flows were discarded viz. (i) flows having single packet and (ii) flows that involves local broadcast activities in the network. Reasons for discarding these 41
flows are as follows: (i) flows carrying single packet does not carry any meaningful statistical information, and if single packet flows are not discarded, the ‗proportion of largest sized packet‘ attribute values in the dataset would become ‗1‘, which would in turn adversely affect the classification outcome. (ii) The bot infected hosts may involve in local broadcasts activities. However, the primary focus here is to consider host-to-host directed interaction in the network and broadcast traffic is never part of bot C&C interaction. Therefore, such traffic is tagged as unwanted for the classification model. Flows extracted from each of the three P2P botnet traces and normal web traffic traces are further processed as follows: (i)
Six datasets having 15000 flows in each are extracted from six different P2P bot‘s C&C traffic samples. Out of this six, two belongs to two different Nugache bots, another two belongs to two different Waledac bots and the remaining two belongs to P2P Zeus bot. These six datasets are then scaled between 0 and 1 for each feature.
(ii)
Flows extracted from normal web traffic traces are grouped in to six equal parts having 5000 flows in each and are then scaled in the same way between 0 and 1 for each feature.
(iii)
One each from botnet dataset is combined with one each from normal part to create six composite datasets of 20000 flows in each.
3.3 Description of P2P Botnets used in Experimentation A pure peer-to-peer botnet is a decentralized architecture allowing botmaster to use any peer at random to distribute command to other peer-bots in the P2P network. Some of the well-known P2P botnets are Nugache [67], Storm [67], Waledac [40] and P2P Zeus [25]. Nugache is the pure-P2P bot artifact that does not depend on any central server including DNS. It handles C&C 42
through encrypted P2P Channel using a variable bit length RSA key exchange, which is used to seed symmetric Rijndael-256 session keys for each peer connection. Each Nugache peer retains a list of up to 100 servant peers in order to rejoin the network again in case it gets disconnected. Waledac botnets entirely depends on the use of HTTP communication and a fast-flux based DNS network for its C&C operations. Each one of Waledac binary carries a list of IP addresses to make initial connection with the waledac network. Waledac binary also contains a hardcoded URL to access the botnet, in case the bot fails to identify an active node in its address list. The hardcoded URL usually looks for a domain which is part of the fast flux network created by the botnet. For C&C operations, each Waledac bot initially generate an internal public certificate and sends to the head-end C&C server. The head-end C&C server encrypts the communication key (necessary for the bot to interact with the botnet) using the internal public certificate. Following this, it sends the encrypted key back to the bot. This key is decrypted and used by the Waledac bot, for future communications with the botnet. The popular centralized version of the Zeus botnet has been modified to create a more resilient P2P variant known as P2P Zeus or GameOver. Many virtual sub-botnets are created by dividing the main P2P network into several parts by using a hardcoded sub-botnet identifier present in each P2P Zeus‘s bot binary. These sub-botnets are independently controlled by several botmasters, even though the main P2P network of Zeus is maintained and updated as a single entity. To make initial contact with the botnet, the bot binary carries a hardcoded list comprising of IP addresses, ports and unique identifiers of up to 50 Zeus bots. Peer list updating is done through a push-/pull- based peer list exchange mechanism. Zeus bot checks responsiveness of their neighbors every 30 minutes. Each neighbor is contacted in turn and given 5 opportunities to reply. If a neighbor does not reply within 5 retries, it is deemed unresponsive and is removed from the peer list. In case its entire
43
neighbor becomes unresponsive, a Zeus bot attempts to re-bootstrap on to the network by contacting peers in its hardcoded peer list. If this also fails, the bot uses a DGA backup channel to retrieve a fresh RSA-2048 signed peer list.
3.4 Performance Measure of Classifiers Results of classification task by any classification algorithm during testing are generally presented with the help of a confusion matrix. A confusion matrix holds the number of correctly and incorrectly classified instances from each class. In other word, a confusion matrix represents the differences between the true and predicted classes for a set of labeled instances. Table 3.4 shows the format of a confusion matrix with counts for TP, TN, FP, FN representing True Positives or hits, True Negatives or correct rejections, False Positives or false alarms and False Negatives or misses respectively. Table 3.4 A confusion matrix True Class
Predicted Class -VE
+VE
-VE
TN
FP
+VE
FN
TP
Although confusion matrix incorporates all the performance measures of a classification algorithm, more meaningful results can be extracted from it for better representation of the performance measures. The performance measurement formulae applied to confusion matrix in order to extract meaningful results are – classification accuracy, True Positive Rate, False Positive Rate and Precision which are defined as following: Accuracy =
TP +TN
………………..………..(3.1)
TP +TN +FP +FN
44
TP
………………......……..(3.2)
Sensitivity or True Positive Rate (TPR) = TP +FN FP
…………………………(3.3)
False Positive Rate (FPR) = FP +TN Precision or Positive Predictive Value (PPV) =
TP TP +FP
…………………………(3.4)
The accuracy (the rate of correct classification) measure of a classifier is often used for comparison of predictive ability of learning algorithms. However, the accuracy measure completely ignores the probability estimations of the classification systems. Probability estimations generated by most classifiers can be used for ranking instances which gives likelihood estimations of instances and is therefore more desirable than just a classification. The AUC (Area Under the Curve) of the ROC (Receiver Operating Characteristic) curve provides an alternative and better measure for machine learning algorithms by being more adaptive to the selected decision criterion and the prior probabilities. They can also be easily extended to include cost/benefit analysis [79, 84]. ROC curve represents plotting of True Positive Rate against False Positive Rate as the decision threshold is varied, that can be used to compare the classifiers‘ performance across the entire range of class distributions and error costs. With a varied decision threshold and already obtained number of points on the ROC curve [ FP rate = α, TP rate = 1 – β ], the area under the ROC curve can be calculated by using the trapezoidal integration as follows: 1
AUC = ∑i{(1 – βi.Δα + 2[Δ(1 – β).Δα]},
…………………………(3.5)
Where, Δ(1 – β) = (1 – βi) – (1 – βi-1), Δα = αi – αi-1 In case of perfect predictions the AUC is 1 and if AUC is 0.5 the prediction is random.
45
3.5 Methodology The broad methodology adopted is to first develop efficient classification algorithms for botnet C&C traffic and then to develop an efficient clustering based approach for detection of new P2P botnets. Accordingly, SVM [78], C4.5 [87] and FURIA [54] are selected to generate classification models. SVM being a useful tool for data classification in comparison to Neural Network and is easy to implement has been found to be more appropriate for the present study. Similarly, C4.5 algorithm is robust, efficient and easy to implement and interpret. This also leads to generation of crisp rule sets. FURIA makes use of fuzzy logic to generate soft rules which are more relevant to the present study. The Expectation-Maximization (EM) clustering [88] algorithm is selected for generation of clusters because of its ability to generate soft clusters [83] and the Jaccard Similarity Coefficient [26] is selected for similarity analysis of the generated clusters for detection of new botnets. Figure 3.1 shows the complete machine learning based framework for real-time detection of P2P Botnets. WEKA machine learning environment [82] has been chosen to perform the classifications and to generate the clusters. Weka provides a collection of Machine Learning (ML) algorithms and several visualization tools for data analysis and predictive modeling. Before using in the classification / clustering processes, datasets are passed through Randomize filter available with WEKA‘s unsupervised instance filter category for randomization of instances.
3.5.1 Botnet C&C Traffic Classification using Support Vector Machine Support Vector Machine (SVM) [85] is used for classification of large volume of control traffic generated by a P2P botnet from that of normal web traffic. A model selection of SVM [78] is carried out using Radial Basis Function (RBF) kernel. It is given by K(x i,xj)=exp(-γ||xi46
xj||2 ), γ>0 . There are two parameters for a RBF kernel: C and γ (gamma). Since it is not known beforehand, which pair of value for C and γ would produce best result a model selection (parameter search) is performed with an exponentially growing sequences of C and γ, like C = 25
, 2-3,…,215 and γ = 2-15, 2-13,…,23. Also Classification is performed using 10-fold cross
validation method. Dataset prepared by considering all initially selected features
Preparation of Datasets Feature Selection Classification (SVM, C4.5, FURIA)
Findings from supervised learning frameworks
Botnet detection through clustering based
Refined datasets for classifications/clustering
framework
Figure 3.1 Machine learning and data mining based framework for real time detection of botnets.
3.5.2 A Rule based Classification Model using C4.5 Algorithm A rule induction method for botnet traffic classification is proposed. An indirect method is used to derive the initial rule set from the decision tree generated using C4.5 algorithm [87]. This is followed by a step-by-step approach for optimization of the rule set. The final rule set has a uniform structure providing significant insight in to similarities within P2P botnet C&C traffic.
3.5.3 Generation of Fuzzy Rules for Botnet C&C Traffic Classification Another framework proposed for botnet C&C traffic classification is through generation of fuzzy rules using Fuzzy Unordered Rule Induction Algorithm (FURIA) [54]. Fuzzy logic often leads to creation of small rule, where each rule is an embodiment of meaningful information. Moreover, there is an inherent fuzziness in security issues and thus an approximate fuzzy rule set 47
can be generated for detection of security threats. Inference using conventional rules depends on crisp boundaries that lead to abrupt transition between the two classes. However, a more general rule where its support for a class decreases from ―full‖ (inside the core of the rule) to ―zero‖ (near the boundary) in a gradual rather than an abrupt way is more appropriate. Therefore, a set of fuzzy rules that have ―soft‖ boundaries definitely has merit.
3.5.4 Botnet Detection through Similarity Analysis of Clusters Clustering based botnet detection framework has been developed for real-time detection of P2P bots in a monitored network. Every botnet uses a specific set of commands. Commands frequently exchanged between different peer bots represent flows whose structural characteristic matches with one another. These flows, when considered separately are low in volume, as very less number of packets is transferred and packet sizes are usually small. But, bot C&C flows are high in frequency during initial stages of infection. Therefore, Expectation-Maximization (EM) clustering algorithm [88] is used for clustering of botnet C&C flows on its structural characteristics. The numbers of clusters to be generated is fixed to two. The efficiency of the clusters has been analyzed using classes-to-cluster evaluation method in Weka machine learning environment. The detection framework comprises of three modules: flow clustering module, flow reduction module and similarity analysis module. In the flow clustering module, a comparison is drawn between the two clusters generated using a dataset. If the clusters generated are highly imbalanced, further analysis is done using only the larger cluster (also considered as subject cluster for further analysis) where in the flow reduction module duplicate entries in it are removed. This gives an assessment of the amount of reduction in the subject cluster, which is usually very high in case of bots. After reduction, a ‗set‘ is obtained from the subject cluster. In
48
the similarity analysis module, the Jaccard similarity coefficient is calculated to analyze similarity between such sets derived from probable bots.
49
Chapter 4 Botnet C&C Traffic Classification and Evaluation using Support Vector Machine 4.1 Introduction Support Vector Machines (SVMs) are a useful technique for data classification. Therefore, in this chapter SVM based classification model has been used for classification of C&C traffic generated by a P2P botnet. A model selection of SVM is carried out using Radial Basis Function (RBF) kernel. It is given by K(xi,xj)=exp(-γ||xi-xj||2 ), γ>0 . RBF Kernel is selected mainly for two reasons [78]: the number of hyper-parameters which influences the complexity of model selection is less in RBF kernel and the RBF kernel has fewer numerical difficulties. There are two parameters for SVM using a RBF kernel: C and γ (gamma). Since it is not known beforehand, which pair of value for C and γ would produce best result, a model selection (parameter search) is performed with an exponentially growing sequences of C and γ, like C = 25
, 2-3,…,215 and γ = 2-15, 2-13,…,23. Also Classification is performed using 10-fold cross
validation method. The architectural diagram of the P2P botnet detection framework using SVM is shown in Figure 4.1. 50
SVM Classifier
P2P bot packet data
P2P and other normal packet s data
Data for Training
Kernel Method
Flows extracted & labeled
Lagrange Multiplier s
Data for Testing
Classification
Normal
Bot
Figure 4.1: Flow based P2P bot detection architecture using SVM The first part of Figure 4.1 is used for feature set selection and preparation of datasets as described in Chapter 3. A common strategy adopted in classification problems is to divide the dataset such that a part of data is considered to be unknown. The predictive accuracy of a classification model obtained from this ―unknown‖ set is considered to be a reflection of its performance in classifying an independent dataset. The ―Data for training‖ and ―Data for Testing‖ precisely reflects the labeled data for training and the unknown data for testing. In fact, an improved version of this procedure, namely n-fold cross validation is used. In n-fold cross validation, the training set is first divided into n subsets of equal size. Sequentially one subset is tested using classifier trained on remaining n-1 subsets. Thus, using this procedure every instance of the training set is predicted once. The result of classification is the cross-validation accuracy or the percentage of correctly classified data. In general, the value of n does not 51
influence the cross validation accuracy much if it is small enough compared to the total number of samples. In this case, the value of n is set to 10. The SVM classifier in this botnet detection architecture uses RBF kernel to predict bot and legitimate flows. Table 4.1 Flow features selected for SVM classification Flow name
Description
Largest Sized Packet (LSP)
Size of the packet carrying maximum bytes in a flow.
Total Bytes transferred with Largest Sized Packets (TBLSP)
It is the summation of bytes transferred with all the largest sized packets in a flow.
Total Bytes Transferred (TBT)
It is the summation of bytes transferred with all the packets in a flow.
Proportion of Largest Sized Packet (PLSP)
It is the ratio of the largest sized packet transferred in a flow.
Average Interarrival Time (AIT)
Average inter arrival time between packets in a flow.
Variance of Interarrival Time (VIT)
Variance of inter arrival time between packets in a flow.
Average Packet Length (APL)
Average calculated for packet sizes of packets within a flow.
Variance of Packet Length (VPL)
Variance calculated for sizes of packets within a flow.
Figure 4.1 shows the use of Lagrange multiplier [17] along with SVM kernel to develop the required classification model. Lagrange multiplier is a way to solve constrained optimization problems. The Lagrange multiplier theorem leads to translation of the original constraint 52
optimization problem into an ordinary system of simultaneous equations at the cost of introducing extra variables. Therefore, the process of finding the best hyperplane in an SVM classifier is greatly simplified by introducing two Lagrange multipliers. Features selected for the SVM classifier are shown in Table 4.1. Eight flow level features have been used to train the classifier. These features represent dissimilarity of P2P botnet C&C flows from that of legitimate network flows and are identified by analyzing unique characteristics / behavior of the bots within a P2P botnet.
4.2 Overview of Support Vector Machine In its simplest linear form, an SVM is a hyperplane that separates a set of positive examples from a set of negative examples with maximum margin. Given a training set of instance-label pairs (xi, yi), i=1,….,l where xi ∈ Rn and y ∈ {1, -1}l, the SVMs [85] require the solution of the following optimization problem 𝑀𝑖𝑛 𝑤, 𝑏, 𝜉 Subject to
1 2
wTw + C
𝑙 𝑖=1 𝜉𝑖
…………………………(4.1)
yi(wT∅(xi)+b) ≥ 1-𝛏i 𝛏i ≥ 0
Here training vector xi is mapped into a higher dimensional space by the function∅. This is the case of binary classification for data that is not fully linearly separable and hence requires relaxation of original SVM constraint yi(xi.w + b)-1 ≥ 0 ∀i through introduction of a positive slack variable 𝛏i ≥ 0. The parameter C controls the trade-off between the slack variable penalty and the size of the margin while trying to reduce the number of misclassifications. SVM mapping of training vectors from a lower dimensional space to a higher dimensional space is
53
done in order to find a linear separating hyperplane with the maximal margin in the higher dimensional space. Mapping of lower dimensional space to a higher dimensional space is done using a kernel function. The general format of a kernel function is given by K(x i, xj) ≡ ∅(xi)T∅(xj). Four basic kernel functions used by SVM classifiers are Linear K(xi, xj) = xiT xj Polynomial K(xi, xj) = (γxiT xj + r)d, γ > 0 Radial Basis Function (RBF) K(xi, xj) = exp(-γ||xi-xj||2 ), γ>0 Sigmoid
K(xi, xj) = tanh (γxiT xj + r)
Here, γ, r, and d are kernel parameters.
4.3 Model Selection The network traffic generated by a P2P bot and other web applications is segmented into flows and an appropriate feature set is selected. After this, a model selection using Support Vector Machine is initiated. Classification is done using Sequential Minimal Optimization (SMO) algorithm in the WEKA machine learning environment. It is not known beforehand, which combination of C and γ parameters are best for the given classification problem. Therefore, some kind of model selection (parameter search) must be performed for different combinations of these two parameters. In order to obtain best (C, γ) so that the classifier can accurately predict unknown data, a ―grid-search‖ is performed on penalty parameter C and RBF kernel parameter γ using cross validation. In the grid-search, various pairs of (C, γ) values are tried and the one with best cross-validation accuracy is picked. The particular pair of (C, γ) values having the best cross-validation accuracy is the final selected classification model among 54
various models tested with different pairs of (C, γ) values. Trying with an exponentially growing sequence of C and γ, like C = 2-5, 2-3,…,215 and γ = 2-15, 2-13,…,23 is found to be a practical method to identify good parameters [78]. Following steps are performed to do the classification: 1. SVM requires that each data instance is presented as a vector of real numbers. Consequently, all data instances are presented as vectors of real numbers. 2. Each attribute is linearly scaled to the range [0, 1]. This is done in order to avoid numerical problems that may arise from large attribute values, because the kernel values usually depend on the inner products of feature vectors. 3. Performed model selection, based on the two parameters of an RBF kernel: C and γ.
4.4 Classification Results and Analysis Classification results presented in this chapter are obtained through the application of the SVM classifier on the Nugache dataset. The result obtained from the SVM classifier shows that classification accuracy is above 99 % for the parameter pair C=215 and γ=23. The False Positive Rate (FPR) obtained is 0.011 for the same pair of values. Table 4.2 shows the percentage of accuracy, true positive rate for bot flows for exponentially increasing sequences of parameters C and γ. The initial values of C and γ are taken from the range of values of these parameters as proposed by Hsu et. al.[78]. Moreover, C in Equation No 4.1 is a non-negative regularization parameter fixed by the user that establishes a trade-off between margin maximization and the acceptance of patterns. If the value of C is very small, the solution will be more inclined to the minimization of the margin and accordingly more misclassifications will be allowed. Therefore, the initial values C = 23 and γ = 2-7 are fixed heuristically by keeping it much smaller than the solution offered by a similar research output proposed by Li et. al.[65] using RBF kernel. 55
Table 4.2 Percentage of accuracy and true positive rates for different combination of C and γ Parameter Pair (C, γ)
Percentage of accuracy
True Positive Rate of Bot flows
C=23,
γ =2-7
97.3727
0.998
C=25,
γ =2-5
97.244
0.998
C=27, γ =2-3
97.4322
0.998
C=29, γ =2-1
97.8445
0.998
C=211, γ =2
98.2627
0.995
C=213, γ =23
98.9062
0.997
C=215, γ =23
99.0134
0.997
Percentage of accuracy
99
98
97
96
Different combinations of C and γ pairs
Figure 4.2. Changes in detection accuracy for different combinations of C and γ
56
0.45 0.4
False Positive Rates
0.35 0.3 0.25 0.2 0.15 0.1 0.05 0
Different combinations of C and γ pairs
Figure 4.3. Changes in false positive rates for different combinations of C and γ Various pairs of (C,γ) are tried and it is found that applying an exponentially growing sequence of C and γ is a realistic technique to identify efficient parameters. Moreover, parallelization of grid-search is possible because each (C, γ) is independent. The changes in detection accuracy (in percentage) for different pairs of C and γ values are shown in Figure 4.2. For the exponentially increasing (C,γ) values shown in Table 4.2, the percentage of overall accuracy gradually increased till (C,γ) attains C=213, γ =23 . However, with increase in the value of penalty parameter C to C=215 while keeping the γ value same showed further increase in accuracy. The change in percentage of accuracy to different combinations of (C,γ) is shown in Figure 4.2. Y-axis in the graph represents different percentage of accuracy and the X-axis represent various combinations of (C,γ) values used in developing the classification models. From the graph in Figure 4.2, it is apparent that, with exponentially increasing sequences of penalty parameter C and kernel parameter γ, the rate of accuracy for detection of P2P bot flows
57
also has significantly increased. For the low values of the parameters, the accuracy did not increase much, showing stagnancy in the initial part of the graph. However, with the increase in parameter values beyond C = 32 and γ = 0.03125, the accuracy rate has also steadily increased. Similarly, the change in percentage of false positive rate to different combinations of (C,γ) is shown in Figure 4.3. From the graph it is also apparent that, with exponentially increasing sequences of penalty parameter C and kernel parameter γ, the false positive rate has steadily declined. The extensive review of literatures reveal that a very few similar studies has been reported in the literature and accordingly it appears difficult to carry out any comparative study of the results obtained in this thesis. For example, Lin et. al.[21] has combined an artificial fish swarm algorithm and a support vector machine to achieve more than 99% average accuracy. Similarly, Masud et. al.[64] also achieved more than 97% accuracy using SVM on flow-level features. But, both these approaches are tested on IRC botnets only and are therefore not directly comparable with the proposed study. Saad et. al.[36] studied various machine learning techniques including SVM for detection of P2P botnet C&C phase and has achieved an accuracy in the range of 97% to 98% by using SVM technique in comparison to accuracy of 99.0134% of the proposed method. However detail of the SVM classifier like the kernel function used, values assigned to penalty parameter and kernel parameters are not found in the literature, which makes it difficult for a comparative analysis with the approach proposed in this thesis. The only way is to get or generate real time data by implementing the proposed algorithm, which is beyond the scope of the present research.
58
4.5 Summary A framework for botnet detection using SVM has been proposed and tested on trained model using cross validation. The detection model is solely based on flow features of P2P bot. Number of classification models have been generated following a simple grid search on two parameters (C,γ) of RBF kernel. The percentage of accuracy and the false positive rate of the classification models are compared to select the best model. The experimental result shows that the optimized model yields very high classification accuracy with a significantly low false positive rate. The SVM based deetection is a supervised approach and hence can be used for classification of known botnet traces only. However, the SVM based framework is a payload independent approach which can be used for proactive detection of botnet flows. The detection framework can also detect encrypted C&C traffic.
59
Chapter 5 Development of a Rule based Classification Model using C4.5 Decision Tree Algorithm 5.1 Introduction A decision tree (C4.5 algorithm) based classification model for botnet traffic classification has been proposed in this Chapter. A decision tree is a structured representation of nodes and branches, in which each internal node corresponds to a ―test‖ on a feature, each branch corresponds to the outcome of the test and each leaf node corresponds to the final decision in the form of a class label. The path from root to leaf represents classification rules. Therefore, the initial rule set for classification of botnet traffic has been derived from the decision tree generated using C4.5 algorithm [87]. This is followed by a step-by-step approach for optimization of the rule set. The final rule set has a uniform structure providing significant insight into similarities within P2P botnet C&C traffic. The rule generation method has been applied to Nugache and Waledac datasets obtained from the dataset preparation steps described in Chapter 3.
60
The classification scheme contains four broad modules, namely, data acquisition, extraction, filtering & scaling and botnet C&C traffic classification. This is shown with an architecture diagram in Figure 5.1. Data Acquisition
Extraction
BOTNET C&C TRAFFIC CLASSIFICATION SYSTEM Learn the Decision Tree Model
Filtering & Scaling
Training Set
Testing Set
Apply the Decision Tree Model
Figure 5.1 Architecture diagram for botnet traffic classification using decision tree algorithm Description of the modules in Figure 5.1 i)
Data Acquisition: Raw benign packets and botnet C&C traffic traces are collected as per the description provided in Chapter 3.
ii)
Extraction: Useful features for classification have been extracted from packet headers. One of the optimum feature subset in Table 3.2 in Chapter 3 has been used to generate the initial decision tree rule sets. These features are again described in Table 5.1.
iii)
Filtering & Scaling: Certain categories of flows have been considered as unwanted for the classification process and therefore are removed while preparing the dataset. These include flows carrying only single packet and flows representing local
61
broadcast activities. The reasons for taking such steps have been described in the Data Set Preparation section of Chapter 3. The final dataset is scaled to the range of 0 to 1. Table 5.1 Flow features for C4.5 rule generation Flow name Largest Sized Packet (LSP)
Description The size of the packet carrying maximum bytes in a flow
Proportion of Largest Sized The ratio of the packet carrying maximum bytes in a flow. Packet (PLSP) Response Time Difference Time difference (calculated in seconds) between the last (RTD) packet received in either direction for responding flows. Response Packet Difference The difference in the number of packets being transferred (RPD) in either direction for responding flows.
iv)
Botnet C&C traffic classification system: The optimized dataset is passed on to the Botnet C&C traffic classification System. This module uses 10 fold cross validation. The botnet C&C traffic classification system has two sub modules – one for training the system using input training sets and the other to evaluate the optimum model using testing set.
5.2 Overview of the Algorithm for Decision Tree Learning The Decision Tree (C4.5) algorithm [87] carries out a recursive partitioning of the instance space based on the concept of information entropy. The tree is built in a top-down recursive style. The steps used for Decision Tree learning are presented below: Step 1. Initially, the complete training instances are considered to be at the root. The original entropy of all the instances is computed first. Entropy is a measure of the uncertainty associated with a random variable. Given a set of instances D, it is computed as H[D] = -
|C| 𝑗 =1
…………………………(5.1)
P(Cj) log2P(Cj) 62
Where C is the set of desired classes. Step 2. Recursive partitioning of the instances is initiated using selected attributes. As the purity of data increases with successive partining, the corresponding entropy value goes on becoming smaller and smaller. If the root of the current tree is chosen to be comprised of v values of attribute Ai , the algorithm will partition D into v subsets D1, D2,…,Dv. The expected entropy if Ai is used as the current root is given by HAi[D] = -
v j=1
|Dj | |D|
…………………………(5.2)
H[Dj]
Step 3. Attribute selected to partition a node is on the basis of highest information gain. Information gained by selecting attribute Ai to partition the data is given by the difference of prior entropy and the entropy of the selected branch …………………………(5.3)
gain(D, Ai) = H[D] - HAi[D]
This recursive procedure for the creation of decision tree stops when either all instances for a given node belong to the same class or there are no attributes left for further partitioning or there are no instances left.
5.3 Results and Analysis of the Decision Tree based Classification Model The classification model is generated using 10 fold cross validation method. The datasets prepared from Nugache botnet, Waledac and P2P Zeus botnets are used for training and testing of this classifier based on the features described in Table 5.1. Each of the dataset also includes flows derived from benign network traffic. Table 5.2 shows the classification outputs. Results obtained from the decision tree are presented using performance metric accuracy, sensitivity and positive predictive value. 63
P2P Zeus is a more stealthy botnet compared to Nugache and Waledac. The P2P Zeus is found to be adding random message padding to most of its C&C messages to avoid correlation based detection methods [29]. Primarily because of this reason the accuracy, sensitivity and PPV of P2P Zeus are lower than that of Nugache and Waledac. The decision tree classification model from Nugache dataset produces a very high accuracy, sensitivity and positive predictive value and a very low model building time. The Waledac test dataset also shows very high accuracy, sensitivity and PPV, but marginally lower than that of Nugache. Rules can be generated from a decision tree classification model, through the conjunction of antecedents to arrive at a consequence. That is, if A, B and C are the test nodes encountered in the path from root to the leaf node D, then the rule generated would be in the conjunctive form such as ―if A Λ B Λ C then D‖. Therefore, decision tree rules are extracted from the Nugache, Waledac and Zeus classification models. Table 5.2 Performance of decision tree classifier and time taken to build the model Botnet Datasets
Accuracy
Sensitivity
PPV
Time taken (Seconds)
Nugache
0.9966
0.997
0.997
1.03
Waledac
0.99495
0.995
0.995
0.58
P2P Zeus
0.98135
0.981
0.981
0.95
The number of initial rules extracted from the decision tree classification model tested on the Nugache botnet dataset, Waledac botnet dataset and Zeus botnet dataset are 21, 21 and 149 respectively. A rule induction algorithm has been developed from the rules obtained from Nugache and Waledac botnet datasets. However, the algorithm has not been applied to the Zeus 64
rule set because the overall complexity of the algorithm is directly proportional to the number of rules generated and in the case of Zeus it is very high.
5.3.1 A Rule Induction Algorithm for Botnet Traffic Classification The rules generated from Nugache and Waledac datasets have been passed through the process of removing antecedents which can trivially be removed. For example, if there are two antecedents in the same rule, say t>x1 and t>x2 where t is the attribute and x1, x2 are the numeric attribute values such that x1>x2, then antecedent t>x1 is accepted and the other is discarded. Similarly, if antecedents were t Class=bot (CF = 1.0) (VPL in [0.00006, 0.00015, inf, inf]) and (RPD in [-inf, -inf, 0.006, 0.999]) and (RPD in [0.001, 0.002, inf, inf]) and (RTD in [0.00497, 0.00805, inf, inf]) and ( TBLSP in [-inf, -inf, 0.000055, 0.000062]) and (APL in [0.012533, 0.0126, inf, inf]) and (LSP in [-inf, -inf, 0.0335, 0.0365]) and (TBT in [0.00004, 0.000044, inf, inf]) => Class=bot (CF = 1.0) (VPL in [0.00009, 0.000965, inf, inf]) and (RPD in [-inf, -inf, 0.001, 0.002]) and (RTD in [0.00105, 0.00122, inf, inf]) and (RTD in [-inf, -inf, 0.00218, 0.00219]) => Class=bot (CF = 1.0) 81
7
8
9
10
11
12
13
14
15 16
17
18
19
(VPL in [0.000656, 0.000942, inf, inf]) and (RPD in [-inf, -inf, 0.006, 0.043]) and (RTD in [0.00069, 0.00122, inf, inf]) and (LSP in [0.0523, 0.0529, inf, inf]) and (LSP in [-inf, -inf, 0.0546, 0.0547]) and (VPL in [-inf, -inf, 0.003206, 0.003209]) and (RTD in [-inf, -inf, 0.07234, 0.0724]) => Class=bot (CF = 1.0) (RPD in [-inf, -inf, 0.012, 0.017]) and ( TBLSP in [0.000012, 0.000018, inf, inf]) and (LSP in [-inf, -inf, 0.0062, 0.0066]) and (RTD in [-inf, -inf, 0.01018, 0.01052]) and (RTD in [0.00068, 0.00122, inf, inf]) => Class=bot (CF = 1.0) (VPL in [0.000091, 0.00015, inf, inf]) and (RPD in [-inf, -inf, 0.012, 0.043]) and (RTD in [0.00001, 0.00122, inf, inf]) and (APL in [0.018127, 0.018409, inf, inf]) and (PLSP in [-inf, -inf, 0.142857, 0.166667]) and (VPL in [-inf, -inf, 0.002537, 0.002894]) and (RTD in [-inf, -inf, 0.06149, 0.06156]) => Class=bot (CF = 1.0) (VPL in [0.000976, 0.001038, inf, inf]) and (RPD in [-inf, -inf, 0.005, 0.006]) and (RTD in [0.00078, 0.00091, inf, inf]) and (RTD in [-inf, -inf, 0.00332, 0.00818]) and ( TBLSP in [-inf, -inf, 0.000034, 0.000036]) => Class=bot (CF = 1.0) (VPL in [0.039564, 0.041469, inf, inf]) and (RTD in [0.00061, 0.00097, inf, inf]) and (RTD in [-inf, -inf, 0.03579, 0.04022]) and ( TBLSP in [-inf, -inf, 0.000442, 0.000454]) and (TPT in [0.0002, 0.0003, inf, inf]) => Class=bot (CF = 1.0) (VPL in [0.001119, 0.001122, inf, inf]) and (RTD in [0.00045, 0.001, inf, inf]) and (RPD in [-inf, -inf, 0.006, 0.999]) and (LSP in [0.0768, 0.0772, inf, inf]) and (LSP in [-inf, -inf, 0.0811, 0.0814]) => Class=bot (CF = 1.0) (VPL in [0.000079, 0.000091, inf, inf]) and (RTD in [0.0493, 0.04944, inf, inf]) and (LSP in [0.0527, 0.0529, inf, inf]) and (LSP in [-inf, -inf, 0.055, 0.0552]) and (APL in [0.017975, 0.0182, inf, inf]) => Class=bot (CF = 0.99) (VPL in [0.025873, 0.03012, inf, inf]) and (APL in [0.091857, 0.093214, inf, inf]) and ( TBLSP in [-inf, -inf, 0.000757, 0.000908]) and (RTD in [0.00045, 0.00255, inf, inf]) and (RTD in [-inf, -inf, 0.0676, 0.06776]) => Class=bot (CF = 1.0) (VPL in [0.002699, 0.002756, inf, inf]) and (LSP in [-inf, -inf, 0.0531, 0.0532]) and (LSP in [0.0527, 0.0529, inf, inf]) => Class=bot (CF = 1.0) (VPL in [0.000065, 0.000091, inf, inf]) and (LSP in [-inf, -inf, 0.0335, 0.0343]) and (TBT in [0.000116, 0.000117, inf, inf]) and (APL in [0.016038, 0.01607, inf, inf]) and ( TBLSP in [-inf, -inf, 0.000086, 0.000105]) => Class=bot (CF = 1.0) (VPL in [0.001417, 0.001493, inf, inf]) and ( TBLSP in [-inf, -inf, 0.000055, 0.000055]) and (LSP in [0.0522, 0.053, inf, inf]) and (RPD in [0.002, 0.003, inf, inf]) => Class=bot (CF = 1.0) (VPL in [0.001059, 0.001108, inf, inf]) and ( TBLSP in [-inf, -inf, 0.000034, 0.000034]) and (TBT in [0.00005, 0.000051, inf, inf]) and (TPT in [0.0003, 0.0004, inf, inf]) => Class=bot (CF = 1.0) (VPL in [0.029541, 0.03012, inf, inf]) and (APL in [0.111343, 0.112722, inf, inf]) and ( VIT in [-inf, -inf, 0.0123, 0.0149]) and ( TBLSP in [-inf, -inf, 0.001211, 0.001363]) => Class=bot (CF = 0.99) 82
20
21 22
23
24
25
26
27
28
29
30
31
32
33
(RTD in [-inf, -inf, 0.00686, 0.02146]) and (RTD in [0.00066, 0.00073, inf, inf]) and (APL in [-inf, -inf, 0.00644, 0.006467]) and (LSP in [0.0074, 0.0098, inf, inf]) and (LSP in [-inf, -inf, 0.0098, 0.0122]) => Class=bot (CF = 0.99) (VPL in [0.001957, 0.003153, inf, inf]) and (APL in [0.142629, 0.143664, inf, inf]) and (PLSP in [-inf, -inf, 0.536036, 0.676471]) => Class=bot (CF = 0.98) (VPL in [0.040972, 0.041469, inf, inf]) and (RPD in [-inf, -inf, 0.005, 0.006]) and (RTD in [0.00047, 0.00058, inf, inf]) and (TBT in [0.000649, 0.000653, inf, inf]) => Class=bot (CF = 0.98) (VPL in [0.01728, 0.022948, inf, inf]) and (RPD in [-inf, -inf, 0.006, 0.007]) and (RTD in [0.00795, 0.01713, inf, inf]) and (APL in [0.111506, 0.112722, inf, inf]) and ( VIT in [-inf, -inf, 0.0123, 0.0139]) => Class=bot (CF = 0.98) (LSP in [-inf, -inf, 0.0062, 0.0065]) and ( TBLSP in [0.000013, 0.000018, inf, inf]) and (RTD in [-inf, -inf, 0.06825, 0.07552]) and (LSP in [0.006, 0.0062, inf, inf]) => Class=bot (CF = 0.98) (VPL in [0.000088, 0.000116, inf, inf]) and (RPD in [-inf, -inf, 0.006, 0.008]) and (RPD in [0.003, 0.004, inf, inf]) and (VPL in [-inf, -inf, 0.000162, 0.000162]) => Class=bot (CF = 0.99) (VPL in [0.00071, 0.000712, inf, inf]) and (LSP in [-inf, -inf, 0.0268, 0.0845]) and (TBT in [0.000036, 0.000037, inf, inf]) and (PLSP in [-inf, -inf, 0.4, 0.428571]) => Class=bot (CF = 0.93) (VPL in [0.001417, 0.001905, inf, inf]) and (LSP in [-inf, -inf, 0.0548, 0.0549]) and (LSP in [0.0531, 0.0532, inf, inf]) and (APL in [-inf, -inf, 0.017625, 0.02075]) and (RPD in [0.001, 0.002, inf, inf]) => Class=bot (CF = 1.0) (LSP in [-inf, -inf, 0.006, 0.0062]) and ( TBLSP in [0.000016, 0.000018, inf, inf]) and (RTD in [-inf, -inf, 0.02393, 0.02514]) and ( VIT in [0.0157, 0.0199, inf, inf]) => Class=bot (CF = 0.99) (VPL in [0.026365, 0.028376, inf, inf]) and (RPD in [-inf, -inf, 0.004, 0.012]) and (LSP in [-inf, -inf, 0.1494, 0.1496]) and (LSP in [0.1468, 0.1472, inf, inf]) => Class=bot (CF = 1.0) (LSP in [-inf, -inf, 0.0062, 0.0065]) and ( TBLSP in [0.000018, 0.000019, inf, inf]) and (RPD in [-inf, -inf, 0.001, 0.006]) and (RTD in [-inf, -inf, 0.06889, 0.07552]) => Class=bot (CF = 0.99) (RTD in [-inf, -inf, 0.05404, 0.06343]) and (APL in [0.009754, 0.012425, inf, inf]) and ( TBLSP in [-inf, -inf, 0.000033, 0.000037]) and (TBT in [0.000112, 0.000116, inf, inf]) and ( VIT in [0.0161, 0.0163, inf, inf]) => Class=bot (CF = 1.0) (VPL in [0.000093, 0.000539, inf, inf]) and ( TBLSP in [-inf, -inf, 0.000027, 0.000027]) and (LSP in [0.0254, 0.0255, inf, inf]) and (TBT in [-inf, -inf, 0.000056, 0.000057]) => Class=bot (CF = 0.89) (VPL in [0.000744, 0.000913, inf, inf]) and (PLSP in [-inf, -inf, 0.03125, 83
0.035714]) and (LSP in [-inf, -inf, 0.055, 0.0686]) => Class=bot (CF = 1.0) 34
(RPD in [-inf, -inf, 0.001, 0.002]) and (VPL in [0.023281, 0.02549, inf, inf]) and (LSP in [-inf, -inf, 0.121, 0.1221]) => Class=bot (CF = 0.96)
Table 6.3 Fuzzy rules for detection of Waledac bot C&C traffic Sl. No. 1 2 3
4
5
6 7 8
Fuzzy rules (APL in [-inf, -inf, 0.007491, 0.0075]) and (VPL in [0, 0.000001, inf, inf]) and (LSP in [-inf, -inf, 0.0062, 0.0064]) => Class=bot (CF = 1.0) (LSP in [-inf, -inf, 0.0096, 0.0098]) and (LSP in [0.0094, 0.0096, inf, inf]) and (TPT in [0.0002, 0.0003, inf, inf]) => Class=bot (CF = 1.0) (LSP in [-inf, -inf, 0.0062, 0.0065]) and ( TBLSP in [0.000013, 0.000016, inf, inf]) and (RPD in [-inf, -inf, 0.002, 0.999]) and (LSP in [0.006, 0.0062, inf, inf]) => Class=bot (CF = 0.99) (APL in [-inf, -inf, 0.005533, 0.006]) and (RTD in [0.01125, 0.01838, inf, inf]) and (TPT in [0.0002, 0.0003, inf, inf]) and (RPD in [-inf, -inf, 0, 0.001]) => Class=bot (CF = 1.0) (APL in [-inf, -inf, 0.005533, 0.0059]) and (RTD in [0.00001, 0.00795, inf, inf]) and (RPD in [0, 0.001, inf, inf]) and ( TBLSP in [-inf, -inf, 0.000011, 0.000012]) => Class=bot (CF = 0.98) (APL in [-inf, -inf, 0.005533, 0.0058]) and (TPT in [0.0002, 0.0003, inf, inf]) and (RPD in [-inf, -inf, 0, 0.002]) => Class=bot (CF = 1.0) (APL in [-inf, -inf, 0.005933, 0.00605]) and ( TBLSP in [-inf, -inf, 0.000006, 0.000006]) and (LSP in [0.0055, 0.0058, inf, inf]) => Class=bot (CF = 1.0) (APL in [-inf, -inf, 0.005933, 0.005967]) and (RPD in [-inf, -inf, 0.001, 0.002]) and (VPL in [0.000003, 0.000003, inf, inf]) and ( VIT in [-inf, -inf, 0.0156, 0.018262]) => Class=bot (CF = 0.97)
The structural feature values of the fuzzy rules are shown in Table 6.4. The features considered for comparison are: number of fuzzy rules generated (NFR), average number of antecedents in the rules generated for each botnet (ANAR), number of rules that predicts a bot flow (NRB), percentage of coverage of cases (PCC) and the number of rules with certainty factor 1.0 (NRCF). 84
Table 6.4 Structural feature values of fuzzy rule sets Botnet Dataset Nugache Waledac P2P Zeus
NFR
ANAR
NRB
PCC
NRCF
25 19 80
3.04 2.89 4.1
13 08 34
99.845 % 99.8 % 99.57 %
18 09 31
From Table 6.4, it is apparent that the least complex rules are generated from Waledac botnet dataset and the most complex is from that of P2P Zeus botnet dataset. P2P Zeus generates 80 rules, which is significantly higher than the number of rules generated by the other two botnet datasets. Moreover, the average number of antecedents in the rules is also significantly high in case of the Zeus botnet dataset. The main reason for this distinctive statistic of P2P Zeus rule set is attributed to stealthy behavior of the botnet which applies different evasive techniques. P2P Zeus applies special measures to imitate normal traffic flows, so that its C&C traffic does not get detected. The most significant measure in this direction is the random message padding to most of its C&C messages [29]. Among the other features, Nugache rule set has 52% fuzzy rules predicting bot flows followed by 42.5 % for Zeus and 42.1% for Waledac. Similarly, percentage of rules with certainty factor 1.0 is 72% for Nugache, 47% for Waledac and 38.75% for Zeus.
6.3.2 Analysis of Classification Results Classification results obtained for the fuzzy rule based classification model indicate a very high accuracy rate for all the three datasets with excellent True Positive (TP) and False Positive (FP) rates. Figure 6.2 shows comparison of accuracy achieved through fuzzy based classification models with that of decision tree based classification models obtained using Quinlan‘s famous C4.5 algorithm. All the features used for the generation of fuzzy rule based classification model have also been applied for the generation of decision tree based classification model. The
85
decision tree rule set derived from the underlying classification model for the Waledac botnet dataset have altogether 33 rules. Out of the 33 rules, 18 rules have been used for prediction of bot flows. The 18 decision tree rules predicting Waledac bot flows are shown in Annexure-II. In the fuzzy rule based classification model, only 8 rules are used for prediction of bot flows. Similarly, the decision tree rule set for the Nugache botnet dataset has 25 rules. Out of these 25 rules 9 rules predict bot flows against 13 rules in case of the fuzzy based model. The 9 decision tree rules predicting Nugache bot flows are shown in Annexure-I. Finally, the decision tree rule set for the Zeus botnet dataset has 148 rules. Out of these 148 rules, 78 rules predict bot flows against 34 rules for prediction of bot flows in case of the fuzzy based model. The 78 decision tree rules predicting P2P Zeus bot flows are shown in Annexure-III. The percentage accuracy value achieved using FURIA are 99.745%, 99.715%, and 99.105% for Nugache, Waledac and Zeus flows respectively. Corresponding figures using C4.5 algorithm are 99.655%, 99.695%, and 98.615%. The graph shows a distinct increase in correctly classified instances using fuzzy rule based classification models. Figure 6.3 shows graphical comparison of TP rate or sensitivity, FP rate, Precision or PPV of the three fuzzy based classification models. Fuzzy classifier produces the following results: (i) TP rate, PPV are 0.997 for both Nugache, Waledac traces, and 0.991 for Zeus. (ii) FP rate is 0.005 for Nugache, 0.006 for Waledac and 0.017 for Zeus. Sensitivity, PPV and FP rate are inferior for P2P Zeus test dataset compared to that of Nugache and Waledac. The primary reason for this is the stealthy behavior of P2P Zeus as has been already explained in Section 6.3.1. However, an analysis has been carried out to show that the Nugache and Waledac C&C flow samples are more distinguishable from normal traffic
86
samples when compared with Zeus C&C flow samples. Following considerations are made to do the analysis: (1) From the list of ten features in the feature set, the most significant pair of features i.e. Largest sized packet (LSP) and Proportion of largest sized packet (PLSP) have been considered for the analysis. From Table 3.2 it can be observed that the feature pair LSP and PLSP appears in both the optimum sets and therefore it is intuitively assumed that these two features are more repetitive in comparison to any other feature pair from the list of significant features. (2) The repeated values for this pair of features in all the datasets are removed initially. After removal of duplicates, only distinct values for each instance would be obtained. The percentage of distinct combination obtained for Nugache is 0.313%, for Waledac it is 0.307%, for Zeus it is 5.887% and for Normal flow instances it is 28.3%. (3) The percentage of distinct combinations having more than 1000 bytes in LSP for each dataset is calculated. It is found that none of the packets in Nugache and Waledac datasets carry a payload of greater than or equal to 1000 bytes. For Zeus, the percentage of distinct combinations having more than 1000 bytes in LSP is 0.733% and for Normal the value is 7.64%. From the above steps, it is found that Zeus has a significantly higher percentage of distinct combinations compared to Nugache and Waledac. Zeus also has a good number of flows with LSP having more than 1000 bytes. Therefore, it is not difficult to ascertain that the classification error rate of Zeus is bound to be more compared to Nugache or Waledac.
87
100
Percentage of accuracy
99.6 99.2 98.8
FURIA J48 C4.5
98.4 98 Nugache
Waledac
Zeus
FURIA and C4.5 bars for the botnet datasets
Figure 6.2 Comparison of percentage of accuracies of FURIA and C4.5 models
0.8-1 0.6-0.8 0.4-0.6
1
0.2-0.4
Rate of change
0.8
0-0.2
0.6 0.4
Zeus
0.2
Waledac
0
FP rate
Nugache
PPV
Sensitivity
Figure 6.3 Graph showing comparison of false positive rate, positive predictive value and sensitivity of the fuzzy rule based classification model 88
The AUC (area under the curve) of the ROC (Receiver Operating Characteristic) curves as discussed in section 3.4 of Chapter 3 provides an alternative and better measure for machine learning algorithms. The formulae for calculating AUC is given by equation 3.5 in Section 3.4. Table 6.5 provides the AUC measures of the fuzzy based botnet C&C traffic classification models and its corresponding values for decision tree based classification models. A comparative analysis of the classification models using AUC values is also presented. It is found that the AUC measure for Zeus is significantly better in case of the fuzzy based classifier compared to the decision tree model, whereas for Nugache the fuzzy based classifier has a marginal edge over the one based on decision tree. The only exception is Waledac, where the AUC measure of decision tree classifier edge past the fuzzy classifier, though very marginally. This situation can be explained as follows: both the fuzzy and decision tree based classifiers generates efficient classification models for Waledac botnet C&C traffic sample, which is apparent from Figure 6.2 and Figure 6.3. AUC measure of a particular classification model is calculated through generation of a rank list based on probability estimations of instances. Thus it is not necessary that AUC measure of a classifier has to be higher compared to another classifier just because its other measures like accuracy, sensitivity, PPV etc. are on higher side. In fact, it implies that the error rate of decision tree based classifier generated from Waledac C&C traffic sample is slightly higher compared to fuzzy based classifier even though the decision tree classifier performs marginally better in terms of AUC measure. Nevertheless, from analysis of results it is found that AUC measures of FURIA are much more consistent providing excellent predictions. Table 6.5 AUC measures of FURIA and C4.5 classification models Botnet Dataset Nugache Waledac P2P Zeus
FURIA 0.997 0.997 0.994
C4.5 0.995 0.998 0.984 89
6.4 Summary A fuzzy rule based detection framework for P2P botnets is presented here. This approach can also detect single bot in the network. The fuzzy based approach generated efficient classification models with high predictive accuracy, sensitivity, PPV and FP rate for all the three botnet traces for which rules were generated. The fuzzy based models are also found to be having consistent and high AUC values. The fuzzy rule based approach is a supervised one and hence can detect known botnet traces only. P2P botnets have distributed C&C architecture and therefore complete annihilation of existing botnets is not easy. However, using fuzzy rule based classification model, botnet threats can be detected pro-actively and hence destruction can be minimized.
90
Chapter 7 Botnet Detection Framework through Similarity Analysis of Clusters 7.1 Introduction Botnet operators moving away from traditional chat based protocol like IRC, to commonly used communication protocols like ‗peer-to-peer‘, has made any direct communication between the botnet and the C&C servers/peers increasingly obscure. P2P botnets follow Peer-to-Peer (P2P) technologically, which provides higher resiliency against take down efforts by keeping its communication network active even when some bots in the botnet are disrupted. A bot infected host may exhibit mixed patterns of both legitimate and botnet C&C traffic, due to coexistence of file sharing P2P applications and a P2P bot on the same host. Often in such cases, C&C traffic of P2P botnets can easily blend into the background P2P traffic of popular and legitimate P2P file sharing applications [24]. The overlay network established by a P2P botnet, needs to have a sufficient number of online peer bots in the network at any moment of time. This requirement is vital for a P2P botnet to keep the overlay network functional [24]. Since, the active time of the underlying host is independent of the botmaster‘s control and solely depends on the user behavior of those compromised hosts, the overlay network of the P2P botnet has to keep itself updated about other
91
active peers in the network at a regular interval. An active peer usually shares the list of other active peers of the P2P botnet at some regular interval. Furthermore, active peer bots usually share updates on different modules of the botnet. The Nugache bot program internally maintains a list of 100 recently seen servant peers which have high probability of being available for reconnecting after a system reboot or shutdown [67]. A Nugache bot keeps this list up-to-date with the help of reports received from connected peers on other newly connected peer bots. Furthermore, Nugache also uses an internal release number to indicate the currently running version of its code. When a Nugache peer connects with the P2P network, it compares its version number with that of the connected peers. If the recently joined Nugache peer has a lower version number then an already connected peer, it will request for an update from the bot with higher version number. This allow the entire network to continually upgrade itself as peers come back online after an absence. The above description indicates high frequency of communication in a Nugache overlay network, particularly when a bot joins the network after a break. A Waledac bot maintains a list of IP addresses of currently active peer bots in a ―node table‖. The size of the ―node table‖ varies from 500 to 1000 entries depending on the version of the executable [40]. Each IP in the node table is assigned a timestamp by the bot binary. The use of timestamp allows the IP addresses of newer Waledac bots in the overlay network to replace the older entries in the node table. This helps in keeping the node table as fresh as possible. The Waledac peers also known as repeater nodes, needs to handle node update functionality for both repeater and spammer nodes. Spammer nodes are the compromised machine which lies behind victim‘s firewall and have private IP addresses. The repeater nodes act as proxy to these spammer nodes while interacting with botnet servers. In order to reduce pressure on botnet servers, the repeater nodes are also programmed to handle many additional tasks such as webpage serving, handling
92
of fast-flux DNS queries etc. From the above description, it is apparent that a repeater node in the overlay network of the Waledac botnet, has high frequency of small sessions established with servers, peer bots and spammer bots. Similarly, a bot in the Zeus P2P network also exchange neighbor list (peer list) with other peers at regular interval. Additionally, Zeus bots also exchange list of proxy bots, which are designated bots for storage of stolen data and retrieval of commands. Zeus bots also exchange binary and configuration updates with each other. A Zeus bot maintains a peer list of 50 peers. A bot in a Zeus P2P network check responsiveness of its neighbors every 30 minute. Each neighbor is contacted in turn, and given 5 opportunities to reply. If a neighbor does not reply within 5 retries, it is deemed unresponsive, and is discarded from the peer list. During this verification round, every neighbor is asked for its current binary and configuration file version numbers. If a neighbor has an update available, the probing bot spawns a new thread to download the update. If the probing bot‘s peer list goes down to less than 25 peers, it actively contact each of its neighbors for a list of new neighbors through its pull peer list update mechanism. In such cases the bot keep sending peer list requests until the peer list reaches its maximum size of 150 peers. This is done once in every three hours (Six loop cycles) and is an emergency measure to prevent the bot from becoming isolated [25]. The above description of P2P Zeus botnet shows existence of frequent communication among peers in the network. Although P2P Zeus adopts various evasive techniques to avoid getting detected, the necessity of maintaining a functional overlay network forces its bots to keep communicating at regular interval. Investigations into the C&C behavior of P2P botnet has led to identification of some common traits in its traffic pattern: (i) P2P botnet establishes numerous smaller sessions. For this, it frequently keeps on changing its communication ports; (ii) a P2P bot need to keep
93
communicating in order to keep its malicious network running. Moreover, all bots within a striving P2P botnet, periodically exchanges neighbor lists or peer list with each other to maintain a coherent network. (iii) Like all other botnets, a P2P bot has to abide by a command-response pattern in its C&C interactions; (iv) bot binaries are the executables carrying a specific set of commands for C&C interactions, i.e., a bot is preprogrammed to behave according to the command it receives. The clustering based botnet detection framework presented in this work, stands on three important traits of P2P botnet‘s C&C traffic, namely frequency, repeatability and similarity. Every botnet uses a specific set of commands. Commands frequently exchanged between different peer bots represent flows whose structural characteristic matches with one another. These flows, when considered separately are low in volume, as very less number of packets is transferred and packet sizes are usually small. But, C&C flows of P2P botnets are high in frequency, when considered during an epoch. Therefore, clustering of flows is done using these structural characteristics in the Flow Clustering Module. Flow clustering is done using the Expectation Maximization (EM) clustering algorithm [83, 88]. Then, two additional modules are used for final detection of bots, namely, Flow Reduction Module and Similarity Analysis Module. In the flow reduction module, flows having same structural characteristics are removed. This enables the assessment of the amount of reduction, which is usually very high in case of bots. In the similarity analysis module, the Jaccard similarity coefficient is used to analyze similarities between such sets derived from reduced clusters of probable bots. The architecture diagram of this botnet detection framework is shown in Figure 7.1. The botnet detection through similarity analysis of clusters has the following advantages: (1) it does not inspect packet payloads, which makes it free of privacy issues, (2) makes it work well
94
with encrypted communication channels and (3) unlike anomaly based approaches, the clustering based approach does not have to wait for specific anomalies to occur and hence can be effectively used for proactive detection of botnets. C&C traffic
Traffic Traces
Traffic Traces Flow Clustering Module Majority Clusters Flow Reduction Module Sets obtained from Majority Clusters Similarity Analysis Module
Figure 7.1 Basic architectural diagram of flow clustering based detection approach
7.2 Feature Selection and Methodology 7.2.1 Feature Selection Features used for clustering of C&C flows are extracted from the packet header. Thus, flow level features are considered based on network communication between hosts on the Internet, specifically in the context of botnets. Flows collected for an epoch (typically one day) are represented as f1, f2, …. , fm if m flows are collected during the epoch E. Each fi is a collection of n packets sharing same TCP/UDP protocol, same source and destination IPs, same source and
95
destination ports. Thus, fi = {pj}j = 1,…,n where each pj is single TCP/UDP packet. The flow level features are the aggregate of packet level features. The final feature set consists of five features. These five features attain values that exactly match for the general and frequently exchanged commands during C&C interactions between peer bots. The statistical features involving time and interval of flows such as flow duration, starting time difference between two consecutive flows, etc. are also important in the context of a botnet. But, those features are not considered in this work because time and interval based features are dependent on many external factors like network bandwidth, congestion in the network etc. and may not exactly match for multiple bots in the network. One of the optimum subset of features presented in Table 3.2 in Chapter 3 gives structural similarity of packets and flows (during an epoch) and is used for generation of the initial clusters. This subset comprises of following features: 1) Largest Sized Packet or packet carrying maximum bytes in a flow (LSP) 2) Proportion of Largest Sized Packets in a flow (PLSP) 3) Average Packet Length in a flow (APL). 4) Variance of Packet Length in a flow (VPL). 5) Response Packet Difference between a pair of responding flows (RPD).
7.2.2 Methodology The botnet detection framework processes through the following steps: Step 1: Network packets from two or more suspected machines are collected for same epoch (Typically one day). An epoch should be sufficiently long during the day time when network usage is at its peak, so that it leads to an accumulation of a sufficiently large number of flows.
96
Step 2: Packets are grouped into flows and preprocessed. Only those features are selected which can provide structural similarity of packets and flows. The main objective is to match same commands issued by the bots within the same botnet even though flows may be different because of frequent change of ports by the bots. Thus, two or more datasets are prepared based on number of hosts under scanner. Step 3: Expectation Maximization (EM) clustering algorithm is used to cluster the network flows of each dataset. Number of clusters to be generated is fixed to ‗two‘. Step 4: If the difference in number of clustered instances among the two clusters is very high, it raises initial suspicion that the host in question is a bot and the majority of the clustered instances in the larger cluster are bot flows. For example, more than 70% of the flows are clustered into one cluster. In this case the larger cluster is considered as a subject cluster for further evaluation. Step 5: From each of the subject clusters, flows with duplicate feature values are removed. Significant reduction of flow instances of the subject cluster is another indicator that the majority of flows in the subject cluster belong to a P2P botnet. This is because a large number of P2P bot flows, shares the same packet and flow structure because of the repeated transmission of the same commands through different ports. Here, it is important to mention about bot like benign traffic that might accidentally be generated by some applications. Although, such flows might look similar, but it cannot exactly match even for the same applications running in two different hosts, because application running time is most likely to be different. Thus, it will result in transfer of different number of packets, which in turn will result in different values for the ratio of the largest sized packets in a flow. However, this will not be the case for bot flows, because the number of packets having frequently exchanged bot commands in its payload is fixed, which
97
means that for the number of times the bot gives the same command, the corresponding flows feature values will exactly match. Step 6: Now that the subject clusters are left with only unique flow instances, Jaccard similarity coefficient can be calculated between a pair of such reduced cluster. The Jaccard similarity coefficient between reduced clusters that belongs to compromised hosts of same botnet will have higher value compared to the one involving clusters derived from benign hosts. The lower limit of high similarity between reduced clusters using the Jaccard similarity coefficient value is heuristically considered as greater than or equal to 0.1. This heuristic has been arrived at by studying the cluster properties and similarities of stealthy P2P bots like P2P Zeus. P2P Zeus botnet has adopted multiple evasive techniques, like message payloads are appended with random amount of padding bytes and added resiliency through use of a Domain Generation Algorithm (DGA) backup channel [25].
7.3 Overview of EM Clustering Algorithm Expectation-maximization (EM) clustering algorithm [88] is an iterative statistical method for finding maximum likelihood estimates of parameters in statistical models, where the model depends on missing values. EM finds clusters through a Gaussian mixture model, i.e. by identification of a mixture of Gaussians which fits a given data set. The initialization of parameters of the Gaussians can be either randomly done, or by assigning initial centers using the K-mean outputs. The algorithm iteratively updates the values of means and variances of the Gaussians which is guaranteed to converge on a locally optimal solution. EM algorithm has two steps, defined as the expectation step (E-step) and maximization step (M-step). The missing labels are dealt with by alternating between the two steps. The expectation step involves fixing of models and estimation of missing labels. On the other hand, maximization 98
step involves fixing of missing labels (or a distribution over the missing labels) and finding the model that maximizes the expected log-likelihood of the data.
7.4 Overview of Jaccard Similarity Coefficient Jaccard Index of similarity or Jaccard similarity coefficient is a statistical method for comparing the similarity of finite sample sets. It is calculated by dividing the size of intersections of sample sets by the size of its unions and is shown below: |A∩B|
J (A, B) = |A∪B| , 0 ≤ J(A,B) ≤ 1.
…………………………(7.1)
7.5 Classes to Cluster Evaluation of known C&C Flows Classes to clusters evaluation mode in Weka Explorer [82], first ignores the class attribute and generate the clusters. Then, as the test phase is carried out, the most common value of the class attribute representing majority of the cases within the cluster is assigned to that cluster and this process is repeated for each cluster. Finally, the confusion matrix is generated based on these assigned classes to the clusters. The generation of confusion matrix and its application for extraction of various performance measures viz; accuracy, sensitivity and PPV by using the equations 3.1, 3.2 and 3.4 respectively are discussed in Section 3.4. In the present study, the performances are evaluated by the above same parameters. The EM clustering algorithm has been configured to generate two clusters from each dataset. The results obtained by using the classes to clusters evaluation mode is presented in Table 7.1. The results presented in the table show that meaningful models are obtained from the labeled datasets. Therefore, in the next section, a botnet detection framework is proposed for detection of new botnets in real time through similarity analysis of clustered network flows from hosts in monitored networks. 99
When network traffic is captured from bot infected hosts in the monitored network, it will show a mixed pattern with varying proportion of benign traffic (generated by different legitimate applications running in the compromised host including legitimate P2P file sharing applications) to the bot C&C traffic. However, the number of flows generated by P2P bot during an epoch will be much more then the number of flows generated by legitimate applications during the same epoch, because of the inherent necessity of P2P bots to establish large number of small sessions. Therefore, an analysis has been carried out using the false positive rate and accuracy for different bot/benign flow ratio. The initial number of benign flow is taken at a ratio of 1:3 to the number of bot flows. Table 7.1 Results of classes to clusters evaluation mode Nugache
Waledac
P2P Zeus
0.9321
0.922
0.83095
Sensitivity
0.997
0.99676
0.88163
PPV
0.919
0.90819
0.89172
Performance Measurement Formulae Accuracy
The lower limit ratio of 1:3 between the number of benign flow and the number of bot flow has been assumed based on average number of packets transferred by legitimate applications and bots over the number of sessions established in an epoch. The average number of packets transferred by legitimate applications is much more than that of bots. Additionally, the rate of session establishment is also high in the case of P2P bots. Figure 7.2 (a) and (b) represents change in false positive rate and accuracy respectively, for different amount of benign flows. The Figure 7.2 (b) that represents the change in accuracy for different amount of benign flows, the plots for Nugache and Waledac datasets have almost coincided due to smaller scale factor. This 100
has been rectified by considering larger scale factor. Moreover, the values are also shown in tabular form in Table 7.2. However, the results of all the three datasets show consistently high accuracy and low false positive rate for different bot/benign flow ratio. 0.9 0.8
False Positive Rate
0.7 0.6 0.5
Nugache
0.4
Waledac
0.3
Zeus
0.2 0.1 0 500
1000
1500
2000
2500
3000
3500
4000
4500
5000
Different amount of benign flows
(a) 1.2 1
Accuracy
0.8 0.6
Nugache Waledac
0.4
Zeus 0.2 0 500
1000
1500
2000
2500
3000
3500
4000
4500
5000
Different amount of benign flows (b) Figure 7.2 (a) Change in false positive rate for different amount of benign flows, (b) Change in accuracy for different amount of benign flows. 101
Figure 7.3 Clusters generated for P2P Zeus. Cluster 0 indicates bot flows and cluster 1 indicates benign flows. Table 7.2 Variations of rate of correct classification for different amount of benign flows. Different amount of benign flows 500 1000 1500 2000 2500 3000 3500 4000 4500 5000
Accuracy Waledac 0.9914 0.9857 0.9766 0.9696 0.9596 0.9568 0.9524 0.9438 0.9356 0.9233
Nugache 0.991 0.98631 0.98078 0.9756 0.96737 0.9642 0.96027 0.95337 0.94538 0.93205
Zeus 0.7739 0.759 0.7391 0.8737 0.8646 0.8562 0.8526 0.8485 0.8418 0.8383
Figure 7.3 shows the clustered flow instances for Zeus bot. In this figure, the X-axis represents the number of instances and Y-axis represents clusters. Squares in the figure indicate wrongly clustered instances.
102
7.6 Results of Similarity Analysis of Clusters The botnet detection framework processes through three consecutive modules for final detection of bots. Described below are the results of three modules: Clustering of C&C flows (Module 1): The majority cluster (the bigger cluster) generated in each application of the clustering algorithm is only analyzed further. Table 7.3 shows the percentage of flow in majority clusters in each case. From the percentage of flows in majority clusters it is observed that when two clusters are generated from bot infected machines, it leads to the generation of highly imbalanced clusters. In comparison, the clusters generated from flows that belong to benign machines are more balanced. Therefore, the main object of interest here is the majority clusters because it is likely to hold bot C&C flows. However, this does not give any conclusive evidence and hence the majority clusters are analyzed further. Table 7.3 Percentage of flows in majority clusters Cluster names
Percentage of flows in the cluster
Nugache Bot Dataset1
81.385
Nugache Bot Dataset2
81.395
Waledac Bot Dataset1
82.385
Waledac Bot Dataset2
82.245
Zeus Bot Dataset1
74.845
Zeus Bot Dataset2
73.455
Benign Machine Dataset1
65.28
Benign Machine Datset2
59.88
103
.
Removal of duplicate flows (Module 2): From majority clusters duplicate entries are removed and percentage of reduction in cluster size is estimated. Thus, sets of flow instances are derived from majority clusters. Table 7.4 shows the percentage of reduction achieved in each case. Majority clusters derived from bot shows huge reduction in volume because of repetitive C&C messages that go around it very frequently.
Some benign clusters may also show
significant reduction in size depending on application running on it at the time of traffic capture. This is evident from the significant difference in reduction rates of Benign Machine Dataset1 and Benign Machine Dataset2 in Table 7.4. Table 7.4 Percentage of reduction in each majority cluster after duplicates are removed Cluster Names
Percentage of reduction in cluster size
Nugache Bot Dataset1
96.6
Nugache Bot Dataset2
96.78
Waledac Bot Dataset1
92.85
Waledac Bot Dataset2
91.88
Zeus Bot Dataset1
88.25
Zeus Bot Dataset2
86.71
Benign Machine Dataset1
26.1
Benign Machine Dataset2
82.96
Determination of cluster similarity (Module 3): Jaccard similarity coefficient is calculated between the sets derived from majority clusters by using the equation 7.1. The Jaccard similarity coefficient is significantly higher for reduced bot datasets that are part of same botnet. Table 7.5 shows Jaccard similarity coefficient between bot datasets. The Jaccard similarity coefficient between Benign Machine Dataset1 and Benign Machine Dataset2 is 0.0195 and is significantly lower than bot similarity as shown in Table 7.5. 104
Therefore, a heuristic can be used for detection of P2P botnets using flow clusters. This heuristic is outlined as follows: Majority cluster having ≥ 70 % of total flows, percentage of flow reduction ≥ 80 % and Jaccard similarity coefficient between sets derived from majority clusters corresponding to two different infected hosts ≥ 0.1. If all these three conditions are satisfied for flows collected from a suspected host, it is a P2P bot in the monitored network. Table 7.5 Jaccard similarity coefficients Name of Sets Derived from Majority Clusters
Nugache Bot Dataset2
Waledac Bot Dataset 2
Zeus Bot Dataset2
Nugache Bot Dataset1
0.1926
0.0197
0.015
Waledac Bot Dataset1
0.0231
0.2157
0.011
Zeus Bot Dataset1
0.0155
0.0098
0.1008
7.7 Testing of the Heuristic Two test datasets have been prepared to test the validity of the proposed heuristic in the previous section. Test dataset from P2P Zeus could not be prepared due to insufficient flows generated from source traffic. The result of the test data sets is shown in Table 7.6. Table 7.6 Percentage of flows in majority clusters and percentage of reduction in each majority cluster after duplicates are removed in case of test datasets Majority Cluster (%)
Reduction (%)
Test Dataset Nugache
81.2
96.3
Test Dataset Waledac
82.5
92.7
The results in Table 7.6 show that the percentage of flows in majority clusters in test datasets meets the first heuristic. Similarly, the percentage of reduction of the majority clusters
105
also shows that it satisfies the second heuristic. Furthermore, Jaccard Similarity Coefficient of Test Dataset Nugache with the Nugache Bot Dataset1 and Nugache Bot Dataset2 is 0.1884 and 0.1964 respectively. Similarly, Jaccard Similarity Coefficient of Test Dataset Waledac with the Waledac Bot Dataset1 and Waledac Bot Dataset2 is 0.2165 and 0.2215 respectively. Thus, Jaccard Similarity Coefficient value in each case satisfies the third heuristic. All the three heuristics satisfied in sequence suggests that the test datasets are successfully identified for their corresponding botnet traces.
7.8 Summary A clustering based detection framework using Jaccard similarity coefficient for detection of P2P botnets is presented here. The detection approach, that achieves efficient clustering models for P2P botnet C&C flows, provides a heuristic framework for accurate detection of P2P botnets. The three important heuristics that underpins existence of a P2P botnets‘ C&C architecture are: i) When flows are clustered into two clusters from bot infected machines highly imbalanced clusters are obtained, ii) when duplicate flows are removed from majority clusters of bot infected machines, it shows high reduction in its volume, and iii) finally, Jaccard similarity coefficient is high for sample sets derived from majority clusters for bots of same botnet. If all these three conditions are satisfied in sequence, the machine from which flows were clustered is a P2P bot within the monitored network.
106
Chapter 8 Summary and Conclusion 8.1 Summary A more sophisticated botnet detection approach using machine learning and data mining has been proposed and test results reported in this thesis. The underlying research work provides a detection approach for botnet C&C flows during formative stage of the botnet at the victim‘s computer, making it suitable for pro-active and real-time detection. The approach presented in this thesis, initially relies on traffic pattern and flow characteristics of bot‘s C&C flows to design classification models using machine learning algorithms. Finally, real-time detection is achieved through similarity analysis of clustered network flows from bot infected hosts. This provides an ideal approach for detection of new botnets in its C&C phase. The initial botnet traffic classification model is a SVM based model built atop 8 flow features. The model uses 10-fold cross validation for training/testing on botnet and benign flows. The Radial Basis Function (RBF) kernel of SVM has been applied to build the non-linear classification model because of its simple structure using only two kernel parameters. These two kernel parameters (C and γ) can be parallelized to carry out a parameter search in order to find the pair of C and γ that would give the most efficient classification model. Classification models for the three different P2P botnet traces have been built using C4.5 decision tree algorithm. Four important features for classification of P2P botnet C&C traffic have been used to generate these models. From the tested decision tree models which produced 107
acceptable results, decision tree rules have been extracted. A rule generalization method has been applied to the extracted rules from Nugache and Waledac botnets, which gives an optimized reduced rule set. Fuzzy rule based classification models have also been developed using the Fuzzy Unordered Rule Induction Algorithm. Nine flow features have been used to generate the rules. Efficient models for classification are obtained using the fuzzy algorithm. A comparative analysis has also been carried out between the fuzzy rule based classification models and its corresponding decision tree based models. Finally, a clustering based framework has been developed, which uses Jaccard Similarity Coefficient for detection of new botnets. Two clusters generated from each of the botnet datasets using the EM clustering algorithm are compared to their relative sizes. Five important features for prediction of structural similarity of network flows are used for generation of the clusters. If the difference in size is very high among the two clusters generated from a dataset, the larger cluster is further analyzed. Duplicate entities in the cluster are reduced and the reduction in cluster size is analyzed. If there is a high reduction in cluster size, Jaccard Similarity Coefficient is calculated between such reduced clusters. High Jaccard Similarity Coefficient between such reduced clusters is an indication of the reduced clusters belonging to bots in the same botnet. These steps are proposed as heuristics with assumed lower limits for the size of the majority cluster, percentage of reduction in the cluster size of the majority cluster and the Jaccard Similarity Coefficients between reduced clusters. While similarity analysis of clusters helps in accurate detection of bots in a monitored network, fuzzy rule based classification model generates very high detection accuracy among the classification models for botnet C&C flows. However, these two approaches belongs to two
108
different areas of data mining i.e. cluster generation is an unsupervised approach and the Fuzzy rule set generation is purely a supervised learning. Also, unsupervised module helps to detect new bots. Therefore, unsupervised module can be used to identify new bot flows which can then be used with additional features to create training datasets for fuzzy rule based classification models. While similarity analysis of clusters will detect new bots, the fuzzy rule based model will classify flows generated by such ubiquitous networks in a wider scale.
8.2 Limitations and Scope for further Studies Some of the limitations of this research work are listed below. 1) Heuristic approach and its associated pitfalls: Heuristics proposed in the clustering based framework has a strong underlying theoretical backing and inferred from real world experimental data using a top-down approach. However, heuristic based solution has certain pitfalls. Heuristics may lead to overconfidence and confirmatory biases which needs to be consciously avoided or to be validated. 2) Assumptions and the risk of false negatives: While selecting features for classification and clustering frameworks, this research relied on a number of assumptions about characteristics and behavior of current P2P botnets. However, botnet operators are constantly evolving new techniques of avoiding detection, which may lead to inclusion of false negatives in the proposed detection framework. 3) Avoidance of temporal features: Each dataset in this research is using network traffic collected from two different networks. Therefore, temporal features are given least preference while creating models for classification and clustering. Moreover, all packets are Ethernet packets and MTU size is same.
109
4) Difficulties in generating real world botnet traces: Real world botnet traces contain sensitive information and therefore, never shared in public. This dearth of data is a major obstacle to botnet research [39]. Also, use of synthetic traces [58, 72] and botnet emulators [59] has their own limitations. They run the risk of drifting away from realism and incurring potential biases. Moreover, botnets are global phenomenon and therefore establishment of lab setup without negatively impacting the rest of the campus network is a very complex task. Therefore, the botnet traces used in this research have been obtained from research groups involved in botnet related researches [51, 27] in the Department of Computer Science, The University of Texas at Dallas and Department of Computer Science, University of Georgia. The future scope for this research work has been outlined as follows: 1)
The most obvious extension of the work can be an integrated framework for on the fly detection of botnet. The integrated framework should consist of both the clustering based technique and the fuzzy logic based technique (reported in this thesis).
2)
Botnet operators are expanding to other realms of communication like those using social networking [49], and those controlled remotely from cloud servers [18]. C&C traffic generated by social networking based botnets is hard to detect because their C&C traffic hides behind normal social network traffic. Botnets using cloud based services to host C&C infrastructure has similar objective i.e. to disguise their malicious traffic as regular traffic between corporate end points and cloud based services. These advanced C&C architectures are not covered in this research and can be studied in future.
3)
Smartphone based botnets [19] are very recent addition to the overall botnet threat. There are number of factors that make mobile devices attractive to botmasters. Firstly, 110
mobile devices make up an easy platform for malwares to spread. This is because mobile users have a higher level of trust of messages that originate from people they have personal relationship with. Secondly, apart from telephony, Smart phones usually have multiple network interfaces such as WiFi or Bluetooth. These are additional potential spreading vectors. Thirdly, malware detection and defense mechanism for mobile devices are not as widely deployed as equivalent solutions for computers. Development of defenses and detection of botnets for mobile devices can also be a future extension of this research work. 4)
With the advent of the newer devices like IoTs the Internet will be more and more pervasive extending up to the home computing arena.
This can create larger
opportunities for the rogue elements to spread the botnets. The security researchers need to cover up this newer area and need to come out with new mechanisms to handle this. The work in this thesis can also be extended to address the prospective threats on IoT devices.
111
References [1]
Margaret
Rouse
―Distributed-Denial-of-Service
Attack
(DDoS)‖
Available:
http://searchsecurity.techtarget.com/definition/distributed-denial-of-service-attack (Accessed on June 23, 2015, Time : 6.30 AM) [2]
Why
Botnet
Detection
And
Removal
Is
So
Important
?
Available:
http://www.blockdos.net/why-botnet-detection-and-removal-is-so-important (Accessed on June 23, 2015, Time : 7.30 AM) [3]
8
Ways
To
Protect
Your
Website
From
DDoS
Attack
http://simplicable.com/new/8-ways-to-protect-your-website-from-DDoS-attack
Available: (Accessed
on
June 23, 2015, Time : 8.30 AM) [4]
2013
Botnet
and
DDoS
Attacks
Report
Available:
file:///C:/Documents%20and%20Settings/pijush/My%20Documents/Downloads/2013%20Botnet s%20and%20DDoS%20Attacks%20Report.pdf (Accessed on June 23, 2015, Time : 9.30 AM) [5]
Bot
and
Hacker
Attacks
are
Escalating
–
Protect
Your
Site
http://www.blogaid.net/bot-and-hacker-attacks-are-escalating-protect-your-site
Available: (Accessed
on
June 23, 2015, Time : 10.30 AM) [6]
Statistics
on
botnet-assisted
DDoS
attacks
in
Q1
2015
Available:
https://securelist.com/blog/research/70071/statistics-on-botnet-assisted-ddos-attacks-in-q1-2015/ (Accessed on June 24, 2015, Time : 6.30 AM) [7] The Battle Against Botnets / All Americans Share Cyber Security Risk Available: http://www.ledger-dispatch.com/news/the-battle-against-botnetsall-americans-share-cybersecurity-risk (Accessed on June 24, 2015, Time : 7.30 AM)
112
[8] Officials attack Grum: World‘s third largest botnet (18% of spam) Available: http://www.zdnet.com/article/officials-attack-grum-worlds-third-largest-botnet-18-of-spam/ (Accessed on June 24, 2015, Time : 8.30 AM) [9]
Proofpoint
Uncovers
Internet
of
Things
(IoT)
Cyberattack
Available:
http://investors.proofpoint.com/releasedetail.cfm?releaseid=819799 (Accessed on June 24, 2015, Time : 8.30 AM) [10] Botnets infecting 18 systems per second, warns FBI Available: http://www.v3.co.uk/v3uk/news/2355596/botnets-infecting-18-systems-per-second-warns-fbi (Accessed on June 24, 2015, Time :7.30PM) [11] Taking down botnets !! Well, that‘s not easy… Obama administration wants greater powers to take down botnets… Available: http://www.hackershat.com/taking-down-botnets-well-thatsnot-easy-obama-administration-wants-greater-powers-to-take-down-botnets/ (Accessed on June 25, 2015, Time : 6.30 AM) [12] Botnet network taken down, destructive critical infrastructure attacks up
Available:
https://www.bullguard.com/blog/2015/04/botnet-network-taken-down-destructive-criticalinfrastructure-attacks-up.html (Accessed on June 25, 2015, Time : 7.30 AM) [13] Sophisticated Zeus Campaign Stole €36 Million From 30,000 Bank Accounts Available: http://www.securityweek.com/sophisticated-zeus-campaign-stole-%E2%82%AC36-million30000-bank-accounts (Accessed on June 25, 2015, Time :6.30PM) [14] Attack of the Botnets Available: http://www.sitepronews.com/2014/11/20/attack-botnets/ (Accessed on June 25, 2015, Time : 7.30 PM)
113
[15] Dilip Antony Joseph, Vern Paxson, Sukun Kim, "tcpdump Tutorial", University of California,
EE122
Fall
Available:http://inst.eecs.berkeley.edu/~ee122/fa06/projects/tcpdump-2up.pdf
2006 (Accessed
on
April 24, 2015, Time : 6.30 AM). [16] ―Rootkits, Part 1 of 3: The Growing Threat‖, McAfee Inc., April 2006 Available: http://download.nai.com/products/mcafee-avert/WhitePapers/AKapoor_Rootkits1.pdf (Accessed on April 24, 2015, Time : 7.30 AM). [17] Tristan Fletcher, ―Support vector machines explained‖, 2009. Available: http://www.cs.ucl. ac.uk/staff/T.Fletcher/ (Accessed on September 23, 2015, Time : 6.30 AM). [18] Brandon Butler ―Hackers found controlling malware and botnets from the cloud‖ Network World Available: http://www.networkworld.com/article/2369887/cloud-security/hackers-foundcontrolling-malware-and-botnets-from-the-cloud.html (Accessed on April 23, 2015, Time : 6.30 AM). [19] Pierluigi Paganini ―Mobile Botnets: From anticipation to reality!‖ Available: http://securityaffairs.co/wordpress/12862/malware/mobile-botnets-from-anticipationto-reality.html (Accessed on April 23, 2015, Time :7.30 AM). [20] K. Singh, S. C. Guntuku, A. Thakur, and C. Hota, "Big Data analytics framework for peerto-peer botnet Detection using random forests", in Information Science, Vol. 278, pp. 488-497, 2014. [21] Kuan-Cheng Lin, Sih-Yang Chen, and Jason C. Hung ―Botnet Detection using Support Vector Machines with Artificial Fish Swarm Algorithm‖ in Journal of Applied Mathematics, Hindawi Publishing Corporation, vol. 2014, Article ID 986428, 9 pages, 2014.
114
[22] Khalid Huseynov, Kwangjo Kim, Paul D. Yoo ―Semi-Supervised Botnet Detection Using Ant Colony Clustering‖ in The 31th Symposium on Cryptography and Information Security, Kagoshima, Japan, Jan. 21-24, 2014. [23] Pratik Narang, Chittaranjan Hota, VN Venkatakrishnan ―PeerShark: flow-clustering and conversation-generation for malicious peer-to-peer traffic identification‖, in EURASIP Journal on Information Security, 2014(1), pp. 1–12, October 2014. [24] Junjie Zhang, Roberto Perdisci, Wenke Lee, Xiapu Luo, Unum Sarfraz, ―Building a Scalable System for Stealthy P2P Bonet Detection‖, in IEEE Transactions on Information Forensics and Security, Volume 9, No. 1, pp 27–38, January 2014. [25] D. Andriesse, C. Rossow, B. Stone-Gross, D. Plohmann, and H. Bos, ―Highly Resilient Peer-to-Peer Botnets Are Here: An Analysis of Gameover Zeus‖, in Proceedings of the 8th IEEE International Conference on Malicious and Unwanted Software (MALWARE'13), (Fajardo, Puerto Rico, USA), pp 116-123, October 2013. [26] S. Nivattanakul, J. Singthongchai, E. Naenudorn, and S. Wanapu, ―Using of Jaccard coefficient for keywords similarity‖, in proceedings International Muti Conf. Engineers and Computer Scientists, Hong Kong, pp. 380-384, 2013. [27] Babak Rahbarinia, Roberto Perdisci, Andrea Lanzi, Kang Li, ―PeerRush: Mining for Unwanted P2P Traffic‖, in proceedings of 10th Conference on Detection of Intrusions and Malware & Vulnerability Assessment (DIMVA 2013), pp. 62-82,July, 2013. [28] David Zhao, Issa Traore, Bassam Sayed, Wei Lu, Sherif Saad, Ali Ghorbani, and Dan Garant, ―Botnet Detection based on Traffic Behavior Analysis and Flow Intervals‖, in Computers & Security 39, pp. 2-16, 2013.
115
[29] Christian J. Dietrich , Christian Rossow , Norbert Pohlmann, ―CoCoSpot: Clustering and recognizing botnet command and control channels using traffic analysis‖, in Computer Networks: The International Journal of Computer and Telecommunications Networking, Vol.57 No.2, pp.475-486, February, 2013. [30] Huy Hang, Xuetao Wei, Michalis Faloutsos, Tina Eliassi-Rad, ―Entelecheia: Detecting P2P Botnets in their Waiting Stage‖, 19th USENIX conference, IFIP Networking 2013. [31] K. Muthumanickam and E. Ilavarasan, ―P2P Botnet Detection: Combined host-and networklevel analysis‖, in Computing Communication & Networking Technologies (ICCCNT), 2012 Third International Conference on, pages 1–5. IEEE, 2012. [32] Sandeep Yadav, Ashwath Kumar Krishna Reddy, A.L. Narasimha Reddy, Supranamaya Ranjan, ―Detecting Algorithmically Generated Domain-Flux Attacks with DNS Traffic Analysis‖, in IEEE/ACM TON, Vol. 20, No.5, pp. 1663–1677, 2012. [33] Huabo Li, Guyu Hu, Jian Yuan, Haiguang Lai, ―P2P Botnet Detection based on Irregular Phased Similarity‖, in Second International Conference on Instrumentation, Measurement, Computer, Communication and Control (IMCCC), 2012. [34] David Zhao, Issa Traoré, Ali A. Ghorbani, Bassam Sayed, Sherif Saad, Wei Lu ―Peer to Peer Botnet Detection Based on Flow Intervals‖ in Proceedings of IFIP international information security and privacy conference (SEC 2012), Crete, Greece, June 2012. [35] G. Zou, G. Kesidis, and D. Miller, ―A flow classifier with tamper resistant features and an evaluation of its portability to new domains.‖, in Selected Areas in Communications, IEEE Journal on, Vol. 29, No. 7, pp. 1449 –1460, August 2011.
116
[36] S. Saad, I. Traore, A. Ghorbani, B. Sayed, D. Zhao, W. Lu, J. Felix, and P. Hakimian, ―Detecting P2P Botnets through Network Behavior Analysis and Machine Learning‖, in proceedings of Ninth Annual International Conference on Privacy, Security and Trust (PST), IEEE Press, pp. 174-180, August 2011. [37] Wernhuar Tarng, Li-Zhong Den, Kuo-Liang Ou, Mingteh Chen, ―The Analysis and Identification of P2P Botnet‘s Traffic Flows‖, International Journal of Communication Network and Information Security(IJCNIS), Vo. 3, No. 2, August 2011. [38] Randal L. Schwartz, Brian D Foy, Tom Phoenix, ―Learning Perl‖, Sixth Edition, O'Reilly Media, Pages 388, ISBN 978-1-4493-0358-7, June 2011. [39] A. J. Aviv, A. Haeberlen, ―Challenges in experimenting with botnet detection systems‖, in proceedings of the 4th USENIX Workshop on Cyber Security Experimentation, and Test (CSET‘11), 2011. [40] G. Sinclair, C. Nunnery, B. Byung and H. Kang, ―The Waledac Protocol: The How and Why‖, in proceedings of 4th International Conference on Malicious and Unwanted Software (MALWARE 09), IEEE Press, Feb. 2010. [41] Wen-Hwa Liao, Chia-Ching Chang, ―Peer to Peer Botnet Detection Using Data Mining Scheme‖, in International Conference on Internet Technology and Applications, pp. 1-4, Aug. 2010. [42] Hossein Rouhani Zeidanloo, Mohammad Jorjor Zadehshooshtari, Payam Vahdani Amoli, M. Safari, Mazdak Zamani,‖ A Taxonomy of Botnet Detection Techniques‖, in ICCSIT 3rd IEEE International Conference, 2010.
117
[43] Yun Yang, Guyu Hu, ShizeGuo, ―Imbalanced Classification Algorithm in Botnet Detection‖ in First International Conference on Pervasive Computing, Signal Processing and Applications, 2010. [44] Pieter Burghouwt, Marcel Spruit, Henk Sips, ―Detection of Botnet Collusion by Degree Distribution of Domains‖, in International Conference for Internet Technology and Secured Transactions (ICITST), pp. 1-8, Nov 2010. [45] Dan Liu, Yichao Li, Yue Hu and Zongwen Liang, ―A P2P-Botnet Detection Model and Algorithms Based on Network Streams Analysis‖, in International Conference on Future Information Technology and Management Engineering,2010. [46] Basheer Al-Duwairi, Lina Al-Ebbini,‖ BotDigger: A Fuzzy Inference System for Botnet Detection‖ in The Fifth International Conference on Internet Monitoring and Protection, 2010. [47] Xiaocong. Yu, Xiaomei Dong, Ge Yu, Yuhai Qin, Dejun Yue,‖ Data-adaptive Clustering Analysis for Online Botnet Detection‖, in Third International Joint Conference on Computational Science and Optimization, 2010. [48] Xiaobo Ma, Xiaohong Guan, Jing Tao, Qinghua Zheng, Yun Guo, Lu Liu, Shuang Zhao, ―A Novel IRC Botnet Detection Method Based on Packet Size Sequence‖ in the IEEE ICC proceedings, 2010. [49] E. Kartaltepe, J. Morales, S. Xu, R. Sandhu, ―Social network-based botnet command-andcontrol: emerging threats and countermeasures‖, in Applied Cryptography and Network Security, Springer, pp. 511–528, 2010. [50] Maryam Feily, Alireza Shahrestani, Sureswaran Ramadass, ―A Survey of Botnet and Botnet Detection‖, in Third International Conference on Emerging Security Information, Systems and Technologies (SECURWARE '09), pp. 268-273, June 2009.
118
[51] Mohammad M. Masud, Jing Gao, Latifur Khan, Jiaweihan, Bhavani Thuraisingham,―A Multi-partition Multi-chunk Ensemble Technique to Classify Concept-Drifting Data Streams‖, in Proceedings of the 13th Pacific-Asia Conference on Advances in Knowledge Discovery and Data Mining, pp 363-375, April 2009. [52] Guofei Gu, Vinod Yegneswaran, Phillip Porras, Jennifer Stoll, and Wenke Lee, ―Active Botnet Probing to Identify Obscure Command and Control Channels‖, in Annual Computer Security Applications Conference (ACSAC '09), pp. 241-253, Dec.2009. [53] Wei Lu, Mahbod Tavallaee, Goaletsa Rammidi and Ali A. Ghorbani, ―BotCop: An Online Botnet Traffic Classifier‖, in Seventh Annual Communications Networks and Services Research Conference (CNSR '09), pp 70-77, May 2009. [54] Jens Huhn, EykeHullermeier, ―FURIA: An Algorithm For Unordered Fuzzy Rule Induction‖, Data Min. Knowl. Discov.Vol.19, No. 3, pp 293-319, 2009. [55] Wei Wang, Binxing Fang, Zhaoxin Zhang, Chao Li,‖ A Novel Approach to Detect IRCbased Botnets‖ in International Conference on Networks Security, Wireless Communications and Trusted Computing, 2009. [56] Jian Kang, Jun-Yao Zhang, ―Application Entropy Theory to Detect New Peer-to-Peer Botnet with Multi-chart CUSUM‖ in Second International Symposium on Electronic Commerce and Security, 2009. [57] Sang-Kyun Noh, Joo-Hyung Oh, Jae-Seo Lee, Bong-Nam Noh, and Hyun-Cheol Jeong, ―Detecting P2P Botnets using a Multi-Phased Flow Model‖, in Third International Conference on Digital Society,2009. [58] K. V. Vishwanath and A. Vahdat, ―Swing: Realistic and responsive network traffic generation‖, in IEEE/ACM Transactions on Networking, Vol. 17, No.3, pp 712–725, June 2009.
119
[59] C. P. Lee, ―Framework for Botnet Emulation and Analysis‖, PhD thesis, Georgia Institute of Technology, Atlanta, Georgia, May 2009. [60] Guofei Gu, Roberto Perdisci, Junjie Zhang, and Wenke Lee. BotMiner: Clustering Analysis of Network Traffic for Protocol- and Structure-Independent Botnet Detection. In 17th USENIX Security Symposium, 2008. [61] U. Lamping and E. Warnicke, ―Wireshark User‘s Guide‖, Wireshark Foundation, 2008. [62] Maria Konte, Nick Feamster, and Jaeyeon Jung, ―Fast flux service networks: Dynamics and roles in hosting online scams‖, in Technical Report GTCS-08-07, Georgia Institute of Technology and Intel Research, 2008. [63] Ricardo Villamarín-Salomón, José Carlos Brustoloni, ―Identifying Botnets Using Anomaly Detection Techniques Applied to DNS Traffic‖, in IEEE CCNC proceedings, 2008. [64] Mohammad M. Masud, Tahseen Al-khateeb, Latifur Khan, Bhavani Thuraisingham, Kevin W. Hamlen, ―Flow Based Identification of Botnets Traffic by Mining Multiple Log Files‖, in Distributed Framework and Applications, DFmA 2008. [65] Li Cong-cong, Guo Ai-ling, Li Dan, ―Combined Kernel SVM and Its Application on Network Security Risk Evaluation‖, in International Symposium on Intelligent lriformation Technology Application Workshops (IITAW '08), pp. 36-39, 2008. [66] Craig A. Schiller, Jim Binkley, David Harley, Gadi Evron, Tony Bradley, Carsten Willems, Michael Cross, ―BOTNETS THE KILLER WEB APP‖, Syngress Publishing Inc., 2007. [67] S Stover, D Dittrich, J Hernandez, S Dietrich, ―Analysis of the Storm and Nugache Trojans: P2P is here ‖, in USENIX, Volume 32, Number 6, pp. 18-27, December 2007.
120
[68] H. Choi, H. Lee, H. Lee, and H. Kim, ―Botnet Detection by Monitoring Group Activities in DNS Traffic‖, in proceedings of 7th IEEE International Conference on Computer and Information Technology (CIT 2007), pp.715-720, 2007. [69] J. Goebel and T. Holz, ―Rishi: Identify Bot Contaminated Hosts by IRC Nickname Evaluation‖. HotBots‗07: Proceedings of the first conference on First Workshop on Hot Topics in Understanding Botnets, USENIX Association, Berkeley, CA, USA, 2007. [70] J.R Binkley, S. Singh, ―An algorithm for anomaly-based botnet detection‖, in Proceedings of the 2nd Conference on Steps to Reducing Unwanted Traffic on the Internet, vol. 2, USENIX Association, Berkeley, CA, USA, p. 7, 2006. [71] Carl Livadas, Robert Walsh, David Lapsley, W. Timothy Strayer, ―Using Machine Learning Techniques to Identify Botnet Traffic‖ in 2nd IEEE Local Computer Networks Workshop on Network Security (WoNS'2006), pp. 967 – 974, Nov. 2006. [72] M. C. Weigle, P. Adurthi, F. Hernández-Campos, K. Jeffay, and F. D. Smith, ―Tmix: a tool for generating realistic TCP application workloads in NS-2‖, in ACM SIGCOMM Computer Communication Review, Vol. 36, No. 3, pp.65–76, July 2006. [73] Robert Slade ―Dictionary of Information Security‖, Syngress Publishing, ISBN: 1597491152, 2006. [74] B. Saha and A, Gairola, "Botnet: An overview," CERT-In White Paper, CIWP-2005-05, 2005. [75] J. Binkley, and B. Massey, ―Ourmon and Network Monitoring Performance‖, in USENIX Conference, Freenix track, Anaheim, April 2005.
121
[76] S. Zander, T.T.T. Nguyen, G. Armitage, ― Automated Traffic Classification and Application Identification using Machine Learning―, IEEE 30th Conference on Local Computer Networks (LCN 2005), Sydney, Australia, 15-17 November 2005. [77] L. Spitzner, ―The Honeynet Project: Trapping the Hackers‖, in IEEE Security and Privacy, vol. 1, no. 2, pp. 15-23, 2003. [78] C. W. Hsu, C. C. Chang and C. J. Lin, ―A practical guide to support vector classification‖, Technical report, Department of Computer Science, National Taiwan University. July, 2003. [79] C. Ling, J. Huang, and H. Zhang, ―AUC: A better measure than accuracy in comparing learning algorithms‖, in Proceedings of Canadian Artificial Intelligence Conference, 2003. [80] Darrin Wasom ―Intrusion Detection System : An Overview of RealSecure‖, SANS Institute InfoSec Reading Room, SANS Institute 2001. [81] M. Roesch, ―Snort: Lightweight intrusion detection for networks.‖, in proceedings of the 13th Conference on Systems Administration (LISA-99), USENIX Association, pages 229-238, Berkeley, CA, Nov. 7-12, 1999. [82] I. H. Witten, E. Frank, L. Trigg, M. Hall, G. Holmes, and S. J. Cunningham, ―Weka: Practical Machine Learning Tools and Techniques with Java Implementations‖, in Proc. ICONIP/ANZIIS/ANNES \'99, Int. Workshop: Emerging Knowledge Engineering and Connectionist-Based Information Systems, pp.192 -196, 1999. [83] Paul S Bradley, Usama M Fayyad and Cory A Reina, ―Scaling clustering algorithms to large databases‖, in ACM SIGKDD International Conference on Knowledge Discovery and Data Mining, New York City, 1998. [84] A. P. Bradley, ―The use of the area under the ROC curve in the evaluation of machine learning algorithms‖, in Pattern Recognition 30, pp. 1145-1159, 1997.
122
[85] C. Cortes and V. Vapnik, ―Support-vector network‖, Machine Learning, Vol. 20, pp. 273– 297, 1995. [86] W. Cohen, ―Fast Effective Rule Induction‖, Proceedings of the 12th International Conference on Machine Learning, ICML, pages 115-123, Morgan Kauffmann, 1995. [87] J. R. Quinlan, ―C4.5: Programs for Machine Learning‖, San Mateo CA: Morgan Kaufman, 1993. [88] A. P. Dempster, N. M. Laird, D. B. Rubin, ― Maximum Likelihood from Incomplete Data via the EM Algorithm‖, in Journal of the Royal Statistical Society, Series B(Methodological), Vol. 39, No. 1, pp. 1-38, 1977.
123
Annexure-I Nugache Decision Tree Rule Set 1.
(APL 0.0196) Λ (TBLSP 0.000073) Λ (RTD 0) Λ (TBT > 0.00036) Λ (TBT > 0.000496) Λ (APL 0.0009)
47.
Class=bot
(RTD 0.0002) Λ (RTD > 0.00092) Λ (LSP > 0.0196) Λ (TBLSP 0.000073) Λ (RTD 134
0.002) Λ (RPD 0.03608) Λ (LSP > 0.02) Λ (APL > 0.012417) Λ (RPD 0.10977)
60.
Class=bot
(RTD 0.0002) Λ (RTD > 0.00092) Λ (LSP > 0.0196) Λ (TBLSP 0.000073) Λ (RTD > 0.03608) Λ (LSP > 0.02) Λ (APL > 0.012417) Λ (RPD 0.017992) Λ (TBT 0.03608) Λ (LSP > 0.02) Λ (APL > 0.012417) Λ (RPD 0.017992) Λ (TBT 0.222222) Λ (LSP > 0.1019)
62.
Class=bot
(RTD 0.0002) Λ (RTD > 0.00092) Λ (LSP > 0.0196) Λ (TBLSP 0.000073) Λ (RTD > 0.03608) Λ (LSP > 0.02) Λ (APL > 0.012417) Λ (RPD 0.017992) Λ (TBT > 0.000149) Λ (VPL 0.03608) Λ (LSP > 0.02) Λ (APL > 0.012417) Λ (RPD 0.017992) Λ (TBT > 0.000149) Λ (VPL 0.0196) Λ (TBLSP 0.000073) Λ (RTD > 0.03608) Λ (LSP > 0.02) Λ (APL > 0.012417) Λ (RPD 0.017992) Λ (TBT > 137
0.000149) Λ (VPL 0.002492) Λ (TBLSP 0.038776) Λ (TPT > 0.0006) 65.
Class=bot
(RTD 0.0002) Λ (RTD > 0.00092) Λ (LSP > 0.0196) Λ (TBLSP 0.000073) Λ (RTD > 0.03608) Λ (LSP > 0.02) Λ (APL > 0.012417) Λ (RPD 0.017992) Λ (TBT > 0.000149) Λ (VPL 0.002492) Λ (TBLSP > 0.00106) Class=bot
66.
(RTD 0.0002) Λ (RTD > 0.00092) Λ (LSP > 0.0196) Λ (TBLSP 0.000073) Λ (RTD > 0.03608) Λ (LSP > 0.02) Λ (APL > 0.012417) Λ (RPD 0.017992) Λ (TBT > 0.000149) Λ (VPL > 0.043342)
67.
Class=bot
(RTD 0.0002) Λ (RTD > 0.00092) Λ (LSP > 0.0196) Λ (TBLSP 0.000073) Λ (RTD > 0.03608) Λ (LSP > 0.02) Λ (APL > 0.012417) Λ (RPD > 0.001) Λ (LSP 0.03608) Λ (LSP > 0.02) Λ (APL > 0.012417) Λ (RPD > 0.001) Λ (LSP 0.0527)
69.
Class=bot
(RTD 0.0002) Λ (RTD > 0.00092) Λ (LSP > 0.0196) Λ (TBLSP 0.000073) Λ (RTD > 0.03608) Λ (LSP > 0.02) Λ (APL > 0.012417) Λ (RPD > 0.001) Λ (LSP 0.000064) Λ (LSP > 0.0506)
70.
Class=bot
(RTD 0.0002) Λ (RTD > 0.00092) Λ (LSP > 0.0196) Λ (TBLSP 0.000073) Λ (RTD 138
0.002) Λ (RPD 0.0552) Λ (LSP > 0.0754) Λ (RPD 0.0196) Λ (TBLSP 0.000073) Λ (RTD 0.002) Λ (RPD 0.0552) Λ (LSP > 0.0754) Λ (RPD 0.000826) Λ (TBLSP > 0.000974)
74.
Class=bot
(RTD 0.0002) Λ (RTD > 0.00092) Λ (LSP > 0.0196) Λ (TBLSP 0.000073) Λ (RTD 0.002) Λ (RPD 0.0552) Λ (LSP > 0.0754) Λ (RPD > 0.003) Λ (APL > 0.097)
75.
Class=bot
(RTD 0.0002) Λ (RTD > 0.00092) Λ (LSP > 0.0196) Λ (TBLSP 0.000073) Λ (RTD > 0.03608) Λ (LSP > 0.02) Λ (APL > 0.012417) Λ (RPD > 0.001) Λ (LSP > 0.0552) Λ (LSP > 0.0728) Λ (RPD 0.1) Λ (PLSP 0.03608) Λ (LSP > 0.02) Λ (APL > 0.012417) Λ (RPD > 0.001) Λ (LSP > 0.0552) Λ (LSP > 0.0728) Λ (RPD 0.1) Λ (PLSP 0.000602) Class=bot
77.
(RTD 0.0002) Λ (RTD > 0.00092) Λ (LSP > 0.0196) Λ (TBLSP 0.000073) Λ (RTD > 0.03608) Λ (LSP > 0.02) Λ (APL > 0.012417) Λ (RPD > 0.001) Λ (LSP > 0.0552) Λ (LSP > 0.0728) Λ (RPD 0.1) Λ (PLSP > 0.467742) Λ (VIT 0.00092) Λ (LSP > 0.0196) Λ (TBLSP 0.000073) Λ (RTD > 0.03608) Λ (LSP > 0.02) Λ (APL > 0.012417) Λ (RPD > 0.001) Λ (LSP > 0.0552) Λ (LSP > 0.0728) Λ (RPD 0.1) Λ (PLSP > 0.467742) Λ (VIT > 0.007451) Λ (TPT