International Journal on Advances in Intelligent Systems, vol 3 no 3 & 4, year 2010, http://www.iariajournals.org/intelligent_systems/
187
Development of a Rich Picture editor: a user-centered approach.
Andrea Valente
Emanuela Marchetti
Dept. Electronic Systems, Aalborg University EIT Esbjerg, Denmark
[email protected]
Warwick Business School, The University of Warwick Coventry, UK
[email protected]
Abstract— This paper describes the development of a software tool to support rich pictures creation for object-oriented analysis. This software is useful both as an e-learning tool for bachelor-level students, as well as for practitioners working with agile methodologies. The transposition of manual rich picture practice into software proved difficult, therefore, we decided to follow a user-centered approach: design and implement a prototype with basic functionalities, then run a usability test with a few students and professionals. The feedback collected in the test validated our hypothesis circa the need of software support for the authoring of rich pictures, but also forced us to re-consider the design of our prototype. To gain a deeper understanding of the students' working practice, we also reviewed rich pictures from past student projects. All the information gathered through our study is guiding us in the design of the tool next version. At a more general level we realized that modern object-oriented development methodologies, such as agile methods, are informed by design, hence they sometimes assume design skills that programmers do not have or do not value. Keywords- rich pictures; knowledge acquisition; objectoriented analysis; qualitative tests; learning
I. INTRODUCTION Rich pictures [1][2] are more and more part of objectoriented analysis and design courses (OOA and OOD courses). At our university, bachelor students in Computer Science as well as Engineers are required to perform analysis in small groups (3 to 6 members) and draw rich pictures as part of their project documentation [3]. Usually rich pictures are created with low-tech support, such as whiteboards or pen and paper. Students sometimes adopt some general purpose software, like a painter or a diagram-drawing tool. Rich pictures represent knowledge about a domain (similarly to Novak's concept maps [4]), and should guide the developers during the definition and construction of the system's early prototypes. However, using a generic tool instead of a specific one has known disadvantages (see [5]). In the case of OOA it means that fundamental concepts are missing and that the knowledge acquired is not immediately re-usable, especially for generative purposes. Hence, it is not possible for an analyst using a generic tool to translate rich pictures into rough software prototypes of the system under study. It would of course be possible to use one of the many formal-methods software tools, but they require training from the part of the students, and mostly work with rather complete and detailed knowledge of a system, being
therefore typically unusable in the analysis phase or when acquiring knowledge incrementally. Considering all this, we decided to develop a software tool specific for the creation of rich pictures, to be used in OOA. This software should be useful both as an e-learning tool for bachelor-level students learning OOA and OOD, as well as for practitioners, working in small teams adopting agile development methodologies. However, transposing the manual rich picture practice into a software tool proved difficult, so we decided to follow a user-centered approach and involve students in a usability test. The feedback collected during the test greatly eased the task of defining the main features of our tool. In the following section we present an early version of our tool and discuss our ideas, sources of inspiration, and related works. Section III explains how the usability test was constructed and run, and what we discovered observing our students interacting with the tool and later interviewing them. In Sections IV and V we discuss the test and how the feedback from the students is guiding the next iteration of the tool development. The new version of the tool, with a new GUI and extended features, is outlined in Section VI. Section VII concludes the paper. II.SOFTWARE SUPPORT FOR RICH PICTURES According to [1] a rich picture provides "a broad, highgrained view of the problem situation", and it shows structures, processes and concerns (or issues). It is also remarked that there is no best way to construct a rich picture. From this consideration we derive a requirement for our software tool: it should not impose a specific work-flow to its users. When rich pictures are used for OOA, structures become visual representations of objects or grouping of objects, while processes are understood as events, changing the state of one or more objects instantaneously (as explained in [3]). As for concerns, they are often simply notes written in natural language aside of the different objects in the picture. Our tool should therefore be a drawing program, and it should allow users to create frames (to visually represent objects), eventually nesting them, to group many frames together into one. Furthermore, users should be able to describe events involving many frames, i.e., specify the processes at work in the system model. It should also be possible to write natural language notes, to support concern identification. We want our software tool to help the user to
2010, © Copyright by authors, Published under agreement with IARIA - www.iaria.org
International Journal on Advances in Intelligent Systems, vol 3 no 3 & 4, year 2010, http://www.iariajournals.org/intelligent_systems/
188 explicit the knowledge captured by one or more rich pictures. This will provide support for an automatic generation of (skeletons of) executable prototypes. A.Related tools To our knowledge there is no software support specific for rich pictures, so we decided to proceed on two fronts: first we surveyed existing software tools that could generally relate to visual editing and conceptual modeling [6], and at the same time we established our own requirements for an authoring tool specific to RP, and to be used in objectoriented development. The survey covered concept maps [4] and text graphs [7]. Concept maps have a very established community, a clear definition and many good software tools. They have been used for many decades in fields like knowledge acquisition, e-learning and knowledge visualization. A concept map is typically a graph structure, constructed from labels containing natural language phrases, and arrows linking labels together. The focus is on the definition of concepts, type-like entities, while rich pictures show more concrete, instantiated examples of a system's state and dynamics. Text graphs are an interesting attempt at making concept maps meaning more precise. However, they are text-oriented and they offer no clear way to represent different steps in the evolution of a series of concepts. While text graphs are not developed with rich pictures in mind, they suggested a direction of inquiry: what happens when text is replaced with pictures, in a text graphs? We explored possible answers to this question in [8], where we also discuss criteria for conceptual modeling software tools. Another option for us was to adapt existing visual editors to RP [9], therefore we experimented with a few products as well as discussed the matter with our student testers (who have also independently tried to author their rich pictures with available software). The most interesting tools we considered are Visual Paradigm for UML [10], Microsoft Visio [11] and Dia [12], and Visual Knowledge Builder [13]. Visual paradigm for UML [10] is a specialized tools for UML-related development activities, such as design of state machines, use cases, class diagrams, and deployment diagrams. In the user guide, visual paradigm is defined as: “a powerful, cross-platform and yet the most easy-to-use visual UML modeling and CASE tool.” A very comprehensive tool, as other modern CASE programs, it can import an existing object-oriented program and automatically generate diagrams from the code. These tools are very good and integrate well many diagrams into a coherent detailed specification of a system. Systems can be defined incrementally, but the notation is built-in and standard (usually from the family of the UML diagrams). Visually appealing, visual paradigm provides a friendly and innovative GUI. However, its goal is not support knowledge acquisition: if a system is yet to be defined, what is the point of keeping strict relationships between its various subcomponents and views. We are more interested in
suspending validation and letting developers explore and correct their diagrams through discussion. Both Microsoft Visio [11] and Dia [12] are diagram editors; the first is proprietary, while the second is a GTKbased GNU tool and is often introduced as a free alternative to Visio. We analyzed Dia in greater detail and found it a good visual editor for diagrams, with many predefined shape packages (e.g., for UML diagrams, electronic circuits as well as various business diagrams). Dia has a palette and a drawing space, and users work by dragging shapes from the palette into the drawing space; then they can customize properties of the shapes and connect them by means of various types of connectors. Interestingly, the set of libraries can be extended, as new shapes can be described by XML files. It is also possible to design custom shapes directly in Dia, and the custom shapes can also be given special attributes. It is clearly possible to use Dia for RP, but being a generic tool, the burden of interpreting the diagrams as RP will reside solely on the users. As discussed in [5], it is not always the best choice to adopt general purpose tools for specific practices (as also emerged from our test, detailed in Section IV). Since working with RP requires spatial reasoning, it is relevant to consider software like the Visual Knowledge Builder (VKB) [13]. It uses incremental formalization to simplify the expensive and time-consuming task of defining knowledge. Many of the goals of VKB are strikingly similar to ours. VKB is visual, but the graphic elements at disposal are simple geometric shapes, little freedom of expression is left to the author. VKB allows users to proceed incrementally from concrete examples of structures, towards more general patterns, type-like in nature. However, VKB seems to be more oriented towards analysis than synthesis, and it bears little relations with object-orientation and OOA. Our general conclusion is that these tools fall into 2 opposite categories: they are in fact either too specialized (e.g., they work very well with a subset of UML diagrams), or too general. What we would like to achieve is a tool in between Visual paradigm and Dia, and that can adequately represent the concepts required for RP editing. This is why we decided to design and implement our own RP software. III.THE EARLY PROTOTYPE: FSSE 2009 The new tool is called Free Sketch for Software Engineering 2009 (called FSSE in the rest of the paper) [9]. The GUI of our tool is visible in Figure 1A. It is composed of 2 windows: the largest one is the main drawing area, where users draw their rich picture, and a smaller window called palette that contains type-level information about the elements drawn in the rich picture. The typical work-flow of a user creating a rich picture in FSSE would be: •Create a new, empty FSSE project. •Draw an image in the background of the main window (using an external painter program) or alternatively import a scanned hand-drawn image. This background image serves as initial draft of the rich picture (see Figure 1A).
2010, © Copyright by authors, Published under agreement with IARIA - www.iaria.org
International Journal on Advances in Intelligent Systems, vol 3 no 3 & 4, year 2010, http://www.iariajournals.org/intelligent_systems/
189
Figure 1: The GUI of FSSE. In the top-left part of the figure (A) the user imported a background image, representing some objects of her rich picture. The second part of the figure (B) shows how the user can convert background images into frames, with names and tags; in (B) “agenda” and “aBook” are frames, tagged with tag “Book”. The tag “Book” is also represented in the palette (on the right). In part (C), the image of the pencil is converted into a frame named “b2”, then nested into the “agenda” frame; the tag “Pencil” is now represented in the palette. The last part, on the bottom-right of the figure (D) shows how the user can use the “Pencil” tag to create a new “Pencil” frame, then place it close to “aBook”.
•Select
rectangles out of the background image. Each selection turns into a frame, that the user can move around and clone, to obtain multiple copies of the same frame. •Each frame can be given a name and a list of tags. Names do not need to be unique, and tags are like types. Tags in FSSE are a clustering device, like tags in blogs. •More and more frames will be defined, so that the initial background image will be reconstructed by frames. This structuring process starts from a flat image, and converts it into a rich pictures made of objects, i.e., frames (as in Figure 1B and 1C). •Frames can have internal details; to declare that a user simply selects a rectangular area inside a frame, and a new frame will appear, nested in the selected one. It is also possible to insert a frame into another one, via drag-and-drop. •The palette window is automatically populated, and contains at any given time a list of all tags used in every frame in the main windows (without repetition). This incremental creation of tags in the palette is visible in Figure 1B and 1C.
•A
tag in the palette (see Figure 1D) can be used to create a new frame, instance of that tag. Each tag also provides information about the relationships between itself and the other tags, such as cardinality and optionality of associations. Our tool does not force users to decide in which order to perform their structuring of a rich picture. For example the division of the initial background image into frames can be mixed with the declaration of the internal structure of the frames. Users can even decide not to assign names or tags to their frames. A frame without names nor tags could be used to group other frames. This means that frames do not correspond exactly to the objects in an OOA. Frames are in fact more un-structured than objects, and become representations of objects only when users decide to assign names and tags to them. To implement frames we drew inspiration from mobile ambients [14]. Dynamic tree-like structures with names and types, ambients can easily model objects and proved a good metaphor in the design and construction of FSSE. In our tool, a frame can have multiple tags, which corresponds to an object with multiple types (or classes). We
2010, © Copyright by authors, Published under agreement with IARIA - www.iaria.org
International Journal on Advances in Intelligent Systems, vol 3 no 3 & 4, year 2010, http://www.iariajournals.org/intelligent_systems/
190 designed FSSE to allow for multiple hierarchy, in this way a rich picture could have rich and/or loose relationships among tags, and the user can decide, at a later time, to clean up her tags into a single inheritance tag system. This kind of alteration of tags relationships (i.e., relationships among classes) reminds of refactoring practices. As soon as a tag is used for a frame, FSSE automatically adds it to the palette window. Moreover, our program analyzes the relationships among tags, and finds out the typical structure of a tag. According to what is depicted in Figure 1D, “agenda” is a “Book” and contains a “pencil”, that is tagged “Pencil”. However, the frame “aBook” is also tagged “Book”, but it does not contain any internal frame. Therefore, FSSE will describe the “Book”-tag as having an association 0 to 1 with the “Pencil”-tag. Events are not yet supported in FSSE. It was unclear to us, before running the usability test with our students, how to best add them. Concerns are not present either, but they can be expressed by writing comments directly on the background image of the rich picture. IV.TESTS A.A qualitative usability test: set up and task At the current development stage of FSSE, a preliminary usability test was needed in order to complete or even to change the tool radically. This test is based on our hypothesis that students may find RP more relevant and useful to their project work, if they could edit them on a specific software tool. Such tool should also allow them to re-use RP for generative purposes, turning RP into an integral part of OOA. Participants to our test were a professional programmer and four engineering students at the 5th semester of their bachelor, who have recently started a course about OOA and OOD. Our aim was to evaluate how users may perceive a tool like FSSE, if it is seen as useful, easy to use, and if it
adequately supports work-flow, for individuals and groups. The students were divided into two groups and were invited into a classroom, one group after the other. The students were sitting at a desk, with a laptop running FSSE, and we were in front of them, observing their reactions, taking notes and filming them with a video-camera. The laptop was connected to a projector, so that we could see (and film) their actions on the wall behind them (Figures 2A and 2B). The test was articulated into four stages: first we showed the students a 5 minutes video-tutorial, then we introduced them to a task, and we left them free to familiarize with the tool before starting; at this point we started filming. The task was similar to the one shown in the tutorial, they had to create one or more rich pictures, identifying objects, classes and events, regarding a pizza restaurant (see Figure 3). A customer can order a pizza from a menu talking to a waiter, the pizzas have to be baked and can be served with wine or other beverages. Finally the customer pays the waiter and a conflict may emerge between them about the order. After the task completion, we asked them a few open questions about their impressions of the tool. A list of questions was prepared, but it was intended mostly as a reference. •How did you like the tool? General impressions. •Given you experience with object-oriented modeling, do you think the tool can facilitates object-oriented analysis and design or no? How and what will you change? •Do you think that the tool makes object-oriented analysis and design more understandable for users or not? How and what will you change? •How do you think it will be possible to define events in Free Sketch, within the current user's interface and how could it work? •Do you think you would like in future to use a tool like this in your work or not? Why?
Figure 2: Two groups of students (on the left and on the right) trying to model events in FSSE. Since events are not actually part of the features of FSSE, each group freely invented a way to express them: the result was a couple of different approaches. The first group (on the left) modeled events by clustering of frames and arrows. The second (right) nested the frames involved in the event in a new frame, representing the event itself.
2010, © Copyright by authors, Published under agreement with IARIA - www.iaria.org
International Journal on Advances in Intelligent Systems, vol 3 no 3 & 4, year 2010, http://www.iariajournals.org/intelligent_systems/
191 •How
do you think the tool supported flow of team work? Did it facilitate team work or made it more complex? How could the tool be improved? •Other comments? What other changes will you suggest to make the tool more effective in supporting object-oriented analysis and design in software development or its understanding from a student's perspective? During the test in fact we started from the first question and then we adapted to the students' comments, who sometimes covered several issues at one time or even proposed new issues. For practical reasons we could not meet the programmer in person, we gave him the program and the tutorial, he solved the task in the tutorial and sent us feedback by e-mail. In designing our test we referred to user-centered qualitative approaches, like ethnographic observations and analysis of video recordings [15][16]. Our aim was to gain a detailed account from users about their working habits, their experience of the tool, how they would like to work and eventually be supported by a tool like ours. These data were intended to be used in a new development iteration. The task was designed as a typical modeling problem, of the kind they already faced during their OOA and OOD course, so that they could reflect upon their own experience to evaluate the tool. It was also our interest to observe how FSSE fitted within the team work-flow and how it affected reflection in action, intended as a process of critical thinking while performing a skilled practice [17]. Concerning the questions, we referred to the method of situated interviews [16], that prescribes to interview users in their context of practice, starting with open questions and gradually focusing on the details of users' statements and ask for examples. We preferred interviews to questionnaires to find out what really mattered to the students and to show
them that we cared for their contribution, and this was explicitly appreciated by one of them. B.Collected Data The students responded quite positively to the test and the prototype, it seemed as we were on the right track. They were relaxed with their mates, probably because they were already working together in the same group for the course and the semester project. They sat one aside of the other, one interacted with the computer, the other read from the paper with the task description and often pointed at the screen with one finger, then they talked a lot deciding together on what to do. We expected the time required for the test to be around half an hour for each group, but in fact it took one hour, as they used extra time to get familiar with the interface. However, they all said that the purpose and the interface of the tool were easy to understand. Surprisingly for us, drawing appeared as a main concern to all the testers, they felt visibly uncomfortable when they needed to draw new icons, specifically arrows and the menu for the restaurant. The first group expressed their uneasiness exchanging a worried, ironic look, then after several attempts they drew a menu and arrows to connect the pizzas to it (as visible on the back of in Figure 2A). A member of the second group said ironically: "Ok, we suck at drawing!", then they modeled the menu as a new frame with the pizzas nested inside, avoiding to draw. The feedback we received from the programmer was very similar, he wrote that he likes the tool, and he also remarked that he does "not want to play with graphics, it sucks!", when analyzing a system. He then suggested to add a library of free, pre-drawn icons and arrows. In this way he
Figure 3: The “pizzeria” task modeled by one of the students groups, using FSSE 2009.
2010, © Copyright by authors, Published under agreement with IARIA - www.iaria.org
International Journal on Advances in Intelligent Systems, vol 3 no 3 & 4, year 2010, http://www.iariajournals.org/intelligent_systems/
192 proposed a constructive solution to the same problem that was signaled also by the two groups. These reactions revealed programmers' perspective on agile methodologies, which include soft skills, such as prototyping and drawing to make rich pictures and storyboards. These skills are taken from the field of design, therefore do not belong to the curriculum of a computer scientist or an engineer, and are not even part of their system of values. Through the interviews we realized that drawing on paper is perceived as an annoying interruption in the process of reflection in action. According to them, it takes time to make a decent icon, approved by the whole group, as they have often "to draw, erase and draw it again", hence "just having a tool would help!". Moreover during the test they were quite precise in selecting icons and spent time erasing the superfluous parts in the external painter, to make them more readable. Their quotes and actions show that, despite their dislike for drawing they want nice icons in their rich pictures, but do not want to do them by themselves. In this sense, features like automatic insertion of pre-made icons or creation of icons through selection from background pictures (as currently available in FSSE), do provide a smoother workflow also from a team work perspective. It was also proposed, both from students and researchers, the possibility to introduce collaborative user interfaces, to turn the main drawing window of FSSE into a sort of shared, remote desktop. Definition of events is central during OOA, but events were missing in the prototype tool that we tested. Nevertheless, the task assigned to the students required to try and represent events. We wanted to see how the students might interpret events representation within the given FSSE interface. They all expressed their perplexity for the lack of support, but found their own way to solve the problem. Interestingly they all tended to represent events as scenes of a storyboard, but they kept the approach they used to define complex objects. The first students grouped a few frames and connected them with arrows (Figure 2A), while the others grouped frames by nesting them into a fresh new frame (Figure 2B). Finally the students seemed to find confusing the distinction between names and tags, so that they discussed with each other how to use the two labels to keep their rich picture coherent. However, it did not take long before they understood that tags work as types and names are just arbitrary identifiers to be assigned to the frames. One of the students showed to be a little frustrated by this ambiguity and said: "if it is a type, why do not call it type!". In FSSE we wanted to use the term tag, since tags are supposed to be used with more freedom than types (see Section II). Moreover, to facilitate overview of the system created, a student proposed that when a frame is selected, it should be highlighted, together with the other frames sharing its tag. Furthermore, FSSE was appreciated for its flexibility, enabling users to keep their favorite work-flow and their understanding of rich pictures making. Such flexibility
implies that users can start modeling from a chosen level of abstraction, and mix the various activities as they like. This is what is called middle-out modeling in [8]. One of the students, who tried a few generic software tools in RP editing, commented: "the nice thing is that this tool doesn't impose me a specific way of thinking, it doesn't assume I am stupid!". Hence we realized that work-flow flexibility can give a feeling of not being patronized, by providing users more control on their work. C.Theoretical framework for usability test Our usability test was conceived to actively involve the students in the design process, in a simple way. It is based on User Centered Design qualitative research principles [16] [18]. A prototype was provided to them and they were asked to solve a simple modeling task, simulating their everyday work practice augmented with our tool. The prototype was a working software, yet it was a mock-up as did not have all features implemented. Specifically no support for events was provided, so that the students could inspire us about how to design this particular feature, which appeared to be quite difficult. Therefore, our prototype did not support all the actions required by the task, providing only a rough feeling about how they might be supported by the finished product. We expected that when the students realized that a specific feature or a standard way to represent events were not given, they would have shown a feeling of perplexity, but found their own way to do it, bringing new ideas to the design process. Our approach involves principles similar to the ones discussed by Suchman [20][21]. She points out that to be able to reconstruct artifacts as objects of investigation it is necessary to alienate them, so to be rediscussed and understood in action, with the active involvement of users. In this case, we distanced ourselves from our program, by neglecting its completion, so that we could re-conceptualize it together with the students. We willingly introduced an incompleteness, which worked as a kind of provocation to the students, creating a bit of frustration. As expected the students were able to get over their initial uneasiness and to affiliate with the program, deciding on one important feature. In this way the program was designed as close as possible to the context of use, with users expressing their point of view about new possible versions. Some of them showed appreciation for being invited to the test, as they realized that we actually wanted to share with them our affiliation with FSSE, when it was still in the beginning of development. Another aspect that was fundamental at that stage and required involvement of groups of students, was to evaluate the impact of FSSE on team work. The test and the analysis of RP in fact showed that the students prefer to work with a software tool, for several reasons, including their dislike for hand-drawing. But as the activity of sketching on paper fits well team work, as it can be done by more individuals operating on single paper sheet, the same thing is not obvious regarding a software running on a computer. The computer itself has an affordance to support one individual operating and this was clearly visible during the experiment.
2010, © Copyright by authors, Published under agreement with IARIA - www.iaria.org
International Journal on Advances in Intelligent Systems, vol 3 no 3 & 4, year 2010, http://www.iariajournals.org/intelligent_systems/
193 The students participated at the test two at a time, and already like this we saw that one student worked at the computer, directly using the tool. The other student instead sat on one side and looked at the paper with the task description, but they both participated in decision making (as in Figure 2A and 2B). There was no strong reaction about this interaction style from the students' part. It is possible that they did not feel disturbed as the set-up suggested two different roles to be chosen within the pair, or simply because they are used to this kind of dynamics from their everyday practice of software development. However, it is our intention to run a user study with a new version of the tool in the fall semester and observe students in the act of analyzing their problem in groups. We expect that this study will allow us to see the program in action, evaluate our findings from the preliminary test, and to identify forms of emergent interactions that might facilitate group interaction in RP editing. These new data will be analyzed in order to improve the program and make designerly activities, such as OOA and RP editing, more engaging and meaningful from the perspective of technical students. In our view, this aim will be achieved re-situating RP creation, now perceived as an independent pedagogical activity, within software development, so to be perceived as an integral part of it and not as a superfluous exercise.
Interestingly all analyzed RP make use of explicative texts to clarify the situation described. Furthermore, the textbook for the object-oriented course [3] recommends to make a few RP during the system choice phase, as a way to generate discussion and facilitate requirements definition for the system under development, and some teachers also suggest to proceed like this in class. Despite all this, only one out of the 7 OOA&D reports has 2 RP representing the same situation from a different focus; all the other only contain 1 RP.
V.RE-CONCEPTUALIZATION A.Analysis of RP across past reports Reflecting on OOA&D courses through the past years, we had the impression that students generally fail to recognize the importance of RP in the development of a software, and certainly do not like to make them. Generally it seems as they consider RP as compulsory project documentation, explicitly required by the teachers, but not particularly meaningful for development, which is considered by our students the most relevant part of the project. In order to investigate further our impressions, we analyzed a few students' project reports containing RP (or sometimes loose re-interpretations of RP), to see how students actually related to the rich pictures as a tool, and as part of OOA&D. We collected 11 reports written through the past seven years: 7 of them were intended for a bachelor-level OOA&D course, for which RP are a specific requirement. The other 4 were instead intended for more advanced courses involving software development (for example a master-level course in computer games and interactive systems), for which RP are not mandatory, as the students are supposed to choose independently their method. All the 7 reports intended for the OOA&D course contain RP, 4 of them even provide a definition of RP. Instead only one report out of the four intended for more advanced courses has a RP. Hence it seems as RP are made only when explicitly required, in fact it was interesting to notice that in some cases the same group of students made a good RP for the OOA&D course but did not make any for more advanced courses.
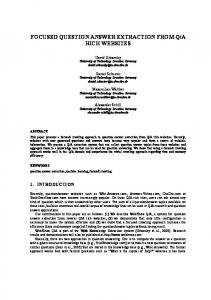
Figure 4: Rich Picture from an advanced course. In the report it is said that it was edited as a support for the reader, not for analysis.
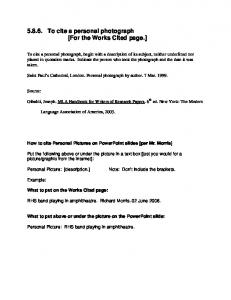
The diagrams provided in the other four reports (including the RP) might resemble RP, but they mostly describe use-cases or state diagrams, showing once more the focus of our students on the technical aspects of system development. Interestingly the only provided RP, visible in Figure 4, is used in a quite improper way. The students wrote that it was drawn to "show the problem domain and possible conflicts to the readers after all decisions were made”. This seems to confirm our impression that the students consider RP as a tool for readers (teachers of stakeholders), but not to support analysis as they are supposed to. In their RP, users and context of use are not represented, and conflicts are missing too. Representation is based mainly on written text, probably because of their general dislike for drawing. Furthermore, considering the representational details of the RP we could see that only 3 RP are handmade, all the others are instead edited on a computer tool. The students follow different approaches in representing the visual structure of RP: some follow a sequential structure while others prefer a circular representation, at which center is the system to be developed, the context of use or the users. Only four reports include two RP, one for the current situation and, in opposition, another for the new improved one. Finally, conflicts seem to be a bit neglected; only 4 reports out of all 11 show conflicts. One of them, represented in Figure 5, has only the “tradition versus change” metaconflict, as given by typical examples in making RP [1][3].
2010, © Copyright by authors, Published under agreement with IARIA - www.iaria.org
International Journal on Advances in Intelligent Systems, vol 3 no 3 & 4, year 2010, http://www.iariajournals.org/intelligent_systems/
194
Figure 5: Typical example of rich picture from a students' project. It is edited through a software tool and represents only the “Tradition versus Change” conflict.
B.Discussion Analysis of students' reports shows that students abandon RP as soon as they go further with their studies, cutting them out of their work practice. This phenomenon could be related to the fact that students underestimate or did not understand the importance of requirements gathering and analysis, preferring to get to the technical part. It might also be that they underestimate the use of sketching, still giving importance to knowledge acquisition. A possible reason could be that the tasks they receive for the projects are either too technology oriented or too simple to require a deep analysis. This certainly has to do with the fact that it happens quite seldom that the students receive tasks from potential clients/users from the real world. In most cases it is the teacher who defines such problems and assigns them to the students (in contrast with the “complex and messy problematic situations” discussed in [2]). Hence these problems might be too defined from the beginning, so that it is immediately visible how to capture the elements of the problem domain in terms of objectoriented features like classes and methods. In this way RP
making becomes a superfluous exercise, just to show the teachers that the prescribed path has been followed correctly. Assuming this explanation as correct, it means that knowledge acquisition and analysis in software development are in fact designerly activities, in the terms expressed by Rittel and Webber [22]. They define design as a process aimed at framing and solving “wicked problems”, in which the presence of messing factors, such as people and social interaction, makes it impossible to find easy or optimal solutions. However, still in more recent studies [2], problem framing is recognized as a valid tool, and it automatically embodies suggestions towards suitable solutions. Therefore, if the problems assigned to our students are not wicked enough, and they did not require any framing, then the technical part is the only one left for investigation. The same reason could also explain why conflicts are often left out of RP. If the problems are too easy, it might even be necessary for students to artificially invent possible conflicts for their RP. Conflicts should instead emerge through analysis of a messy situation, taken from the real world, that demands technology supported solutions. Exploring more this angle, it is no surprise that RP were originated within Soft Systems Methodology [1][2]. They are related to situation boards designers use to represent users' dilemmas and context of use. Situation boards provide a support for reflection and design, intended as a creative and exploratory process, within the design team eventually involving users too [15][18]. RP should be used in a similar way, therefore, they can be defined as a designerly tool. According to Stolterman's definition [19], there are no step by step instructions about how to make RP, as they are supposed to be flexibly adapted to the situation to be represented and preferences of individuals or the group. In fact we saw that the students are actually keen on structuring RP in different ways. But we could also notice in past years that this flexibility may generate confusion: there is no specific way to make a RP, yet students can still make them wrong, not rich enough or missing key elements needed when later modeling the system. Another source of confusion is the fact that rich pictures, use cases, and state diagrams all contain some of the same pieces (such as users or events). In face, some diagrams from the four reports intended for the game course tend to mix internal details of the system to be developed, with context of use, and conflicts about the application of the system. In conclusion these issues may be solved if students received their tasks from actual clients, like for example a company. If that was not possible, the teachers could make the effort to provide messy problems, maybe taken from news papers or other real-world informed materials. Hence students could be provided with heterogeneous stories describing the same problem from different perspectives (e.g., discussions about the different ways to administer existing power plants and renewable energy sources). At this point the students would be forced to analyze such material, to frame the general problem, isolate one or a few specific issues to focus on, identify core elements, actors, events, and potential conflicts in the original and in the new changed
2010, © Copyright by authors, Published under agreement with IARIA - www.iaria.org
International Journal on Advances in Intelligent Systems, vol 3 no 3 & 4, year 2010, http://www.iariajournals.org/intelligent_systems/
195 situation. Hence RP might gain recognition as a useful tool that allows developers to find a focus in the messy realworld and explore more before committing to a particular system definition. C.Re-conceptualization of RP as knowledge acquisition Reflecting on the results gained from the preliminary test and the analysis of RP in past project reports, we identified a typical work practice related to knowledge acquisition and pre-analysis, which are the initial phases of software development, and RP editing. This work practice is what our software tool should facilitate, when finished. RP creation is a preliminary design activity, the stage where developers must frame a messy problem in order to find adequate solutions, focused on object-oriented technology. The RP creation process is quite complex, and it is definitely a form of reflection-in-action as defined by Schön [17] regarding design and planning. In this practice experience and improvisation are deeply intertwined, as expressed by Ingold and Hallam [23]. Moreover, it is a social practice, since decisions must be taken by a group of developers. Schön, in his book “The Reflective Practitioner” [17] provides a deep analysis of professional practice, reconstructing how professionals act in their everyday work and reflecting on implications for education. In our case we are dealing with bachelor students from technical departments (Computer Science, Engineering, Medialogy), who have to learn object-oriented analysis and design in their curricula. During their course the students are supposed to learn theory and practice of object-oriented software development, usually by working at a mini-project that spans the duration of the course. Moreover, the students are typically developing their semester projects at the same time as they attend the OOA&D course, and can decide to apply some of the concepts learned to the larger semester projects as well. As discussed by Schön, the students are supposed to acquire a repertoire of examples ([17] p. 138) regarding application of techniques, theories and practical knowledge, based on their project experience, to support their future working practice. Working at their mini-projects, students are training in analyzing the given problems and in applying the knowledge they gained through lectures and text books, in order to develop technology supported solutions. This kind of practice is called by Schön reflection-in-action, and it is defined as a reflective conversation with the material of the design situation ([17] p. 165). Sketches, like RP, represent virtual worlds through which the practitioner can make exploratory experiments, to investigate possible solutions for her task. New decisions will be taken, reflecting on technical and social implications through these exploratory experiments, which talk back to the developer. Moreover, RP creation is also a social process, since all group members are supposed to participate. In this sense it involves an improvisational component, as defined by Ingold and Hallam [23]. Improvisation is a relational generative process, it is functional to the creation of new culture and
implies that all actors are responsive to each other and the context. It is also temporal as it embodies a certain duration, that is being defined by an organic sequence of actions articulated through time [23]. All these aspects are present in RP editing, which unfolds as a participatory knowledge acquisition, leading to the identify objects, users and dynamics of the system to be developed. Considering all this, the software tool we are developing must be re-conceptualized, to support reflection in action within a social context. Thus, as already mentioned, FSSE should be a designerly tool that does not impose a step by step guided practice, yet it must have a specific affordance for RP editing. Furthermore, FSSE should allow developers to structure their own elements (such as objects and events) when editing one RP. In this way developers should be able to create a sort of kit of tools, that is supposed to speed up the process of editing future RP too. In more general terms, developers should be supported in creating a rough visual domain specific language. Therefore, in designing FSSE, balance between specificity and openness represents a fundamental dilemma. VI.NEXT ITERATION: FSSE10 Considering the details analyzed in the RP we can deduce possible features for the new version of the program. First of all we noticed that only a few RP were handmade, this confirms our findings from the test that technical students dislike to draw and prefer to use a graphical software tools for their RP. This behavior is compatible with our hypothesis that students consider RP as something required by teachers, and if edited at the computer, they look better in their reports and are more readable. However, even when created with software tools, RP are clearly structured in a personal way, independently from the tool used. In terms of designing our tool this implies that we have to allow students to freely choose their representation style, a principle that fits within the definition of a designerly tool [19]. Refining FSSE to be a better designerly tool for RP is our main goal for the next iteration; the new version of the tool will be called FSSE10, since it will be finished and tested in 2010. From a functional point of view, FSSE10 needs to provide better support for the 3 central elements of RP: structure, processes and concerns, and possibly present a simpler and clearer graphical user interface (GUI). In the next sections we will discuss the design of FSSE10. A.Streamlined GUI and new palette Considering our observations circa the way students work with RP and with FSSE, we think nesting of frames complicates the GUI; therefore nesting will be replaced by stacks of re-positionable notes (a concept similar to piles in the BumpTop virtual desktop [24]). The new metaphor should be that when a frame B is stacked on top of another frame A, then B is inside A, or B part-of A. Moreover, the new GUI will integrate free-hand drawing: to draw we currently rely on a free external painter (Java Image Editor, by JH Labs). Internal painting capabilities will
2010, © Copyright by authors, Published under agreement with IARIA - www.iaria.org
International Journal on Advances in Intelligent Systems, vol 3 no 3 & 4, year 2010, http://www.iariajournals.org/intelligent_systems/
196 provide a more uniform environment and improve the flow when drawing rich pictures. Many students seem to like to add explicative comments to the RP or to single elements of it. This practice, related to RP concerns, will be supported by allowing them to place text bubbles in the rich picture. The palette is also undergoing significant changes: it will look much more like a simplified UML class diagram. The terminology used in FSSE10 will therefore be more in-line with object-oriented jargon. Tags will be called classes and frames will be referred to as objects (or rich picture objects). In the current version of FSSE, a frame can have any number of tags, but in the next version each frame (i.e., each rich picture object) will have a single class. This implies that FSSE10 will only support single inheritance, which is a sensible solution to keep the tool simple. Moreover, in our analysis of past rich pictures we discovered that multiple inheritance is virtually never considered by students' during OOA. Another change will be that each class in the new palette will contain typical instances, called prototypes. This idea originated from observing a particular pattern of use of FSSE during the test. A user would create some frames, give them names and tags, and cluster them in an empty area of the rich picture (an example of spatial reasoning within FSSE). Later the user will proceed to create new frames by cloning the ones in the cluster. The cluster itself can be considered as an extension to the FSSE palette. In FSSE10 we will therefore allow the user to drag a rich picture object (e.g., a drawing of a dog) from her rich picture into a class of her palette (the class “Dog”). The dragged object will then be referred to as a prototype of that class, i.e., a typical representative of the class. When a new object of the class is created (in this case a new dog) the prototype (i.e., the drawing of the dog) will be cloned, to provide an initial look for the newly created object. Proceeding in this way, the palette will contain more and more classes, each with its own prototypical objects, that the user stored during her exploration of the system concepts. A side-effect of supporting prototypes is that the palette becomes more persistent and easier to interpret even separated by the RP that generated it. This, in turn, opens the possibility of sharing a palette among many rich pictures, which is impossible in the current version. B.Processes: arrows, events and conflicts Processes, a very relevant aspect of RP, are not directly supported in FSSE. In FSSE10 we plan to use events to represent processes. We already decided to provide labeled arrows, since they were explicitly required by our students in the test, so events will be implemented as a arrows between rich picture objects. Finally, conflicts will be considered as a special kind of events. We are considering the possibility to implement events as hyperedges. Hyperedges are related to hypergraphs, a generalization of graphs [25]. A hypergraph can be defined as a set of vertices, and a set of hyperedges between the vertices; hyperedges are usually undirected, and represent relationship among 1 or more vertices. As an example,
consider a FSSE10 user who wants to define an event “serve cake”, involving 3 rich picture objects: a cake, a knife and a person. The user could select the objects and connect them via a single hyperedge labeled “serve cake”. Each object attached to the hyperedge will have a role, specified by a role name; in the example the roles could be: “item to cut” for the cake, “cut with” for the knife, and “who” for the person. Roles of an event should be typed: e.g., the “item to cut” needs to be an object of the same class of the cake. An event type can later be created from the “serve cake” event, and attached to the palette. The event type will keep information about the role names and their required types, providing a mechanism to constraint and validate events. In the cake example, to serve a cake you need to link the role “who” to an object of class person, and FSSE10 should issue a warning if the role is attached to a dog. Finally, in FSSE10 it would be easy to consider a conflicts as just another kind of events, i.e., labeled hyperedges among the parts of the rich picture that experience the conflict. However, we have noticed that conflicts tend to be neglected by our students, even if they are often necessary to make good RP. Therefore, we believe that our tool should provide an affordance for conflicts, for example in the form of a button for the specific creation of conflicts. C.New file format A FSSE10 project will be a collection of rich pictures, together with a single, common palette (as depicted in Figure 6), and for this we need to define a new file format for FSSE10. The new format also reflects the special role and importance of the palette: it contains all ontological and behavioral information about the set of RP in a project. The palette also provides examples of typical objects of a domain (i.e., complete objects that serve as prototypes for the various classes), and data in natural language about conflicts and reflections around the rich pictures, in the form of concerns. We propose to consider the new palette as the initial core of a Domain Specific Language, in the sense expressed by Fowler [26]: “If people want to think about [a system's] behavior with events, states, and transitions—then we want that vocabulary to be present in the software code too. This is essentially the Domain Driven Design principle of Ubiquitous Language--that is we construct a shared language between the domain people [...] and programmers.” This shared language in our case is a visual shared language, and the programmers should at least be able to use FSSE10 to agree among themselves, and whenever possible, with domain specialists and users too.
2010, © Copyright by authors, Published under agreement with IARIA - www.iaria.org
International Journal on Advances in Intelligent Systems, vol 3 no 3 & 4, year 2010, http://www.iariajournals.org/intelligent_systems/
197
Figure 6: The new FSSE10 file format. A FSSE10 project is saved as a folder (labeled “Project A” in the figure, and colored cyan). Inside the project folder there is a subfolder (yellow, labelled “Palette”) which contains definition of classes, events and concerns. Some classes might have prototypes (i.e., examples of one or more common instances of that class), and those are also stored inside the palette folder, Moreover, in the project folder there is an XML file describing each individual rich picture. This storage format reflects the fact that all rich pictures in the same project share a common palette. D.Intelligence, flexibility and cooperation In FSSE we implemented a few algorithms to analyze the way the user nests her frame, and infer aggregation relationships among tags, as well as cardinality and optionality. In the next version we would like to provide mechanisms for discovery of contextual information: the context of a frame can be defined as the types its the surrounding frames. Relationships could be discovered using heuristics based on this notion of context. We are also considering to improve the flexibility of our tool, by providing FSSE10 with a plug-in mechanism to enable users to define their own mapping from rich pictures to external formats, and perhaps to code. From a social point of view, FSSE should be reconceptualized in order to allow groups to actively interact with the program in their group rooms, and as it was suggested by one of our testers, also through the Internet from remote locations. It could be interesting to explore the effect of both synchronous and asynchronous virtual interaction.
E.Mock-up of FSSE10 To develop the new version of our RP authoring tool we are proceeding in an agile way, defining stories and selecting the most relevant ones to be the basis of the design and implementation incrementally more complex prototypes. Since we advocate the use of RP in the analysis phase of software development, we sketched our stories to be visual and similar to rich pictures. Figure 7 shows the new look of the FSSE10 GUI, some of the steps in the creation of two rich pictures, about the same domain, and the incremental definition of a palette. The images in Figure 7 show, from top-right to bottom-left: •the creation of visual representation for 3 objects: a house, a man and a car. The man is inside (a part of) the house. When the user assigns types to the 3 objects, the classes H (for the house), M (for the man) and C (for the car) are automatically added to the palette. The palette also detects that objects of class M can be inside objects of class H, and shows a 1-to-1 relationship between the 2 classes. •the user creates an event called “sleep” that relates a man and his house. The role of the man is labeled “who” and the role of the house is “place”. •After creating the event “sleep”, the user can declare an event type from the specific event. The “sleep” event type is added to the palette, at the bottom, and keeps information about the roles and their types: objects linked to the role label “who” should be of class M and objects with role “place” should be of class H. New events “sleep” can be created clicking on the event type in the palette. •the user can set the object “house” as prototype of class H, by dragging it to the class H in the palette. •now the user can save and close the current rich picture and start working on a fresh one, still keeping the same palette of classes and events. Populating the new rich picture should be quicker thanks to the knowledge in the palette. The user creates 2 new objects from class H, “house” and “myHouse”. The “myHouse” object is a clone of “house” with some details altered. Class H uses its prototype to initialize each new instances. •the user can declare that “me” sleeps in “myHouse”, by creating a new event from event type “sleep”, and linking the roles “who” to “me” and “place” to “myHouse”. Finally a concern is created, shaped like a text bubble, in the top-right of the last image. VII.CONCLUSION This paper describes the features and development of Free Sketch SE, a software tool to support rich pictures authoring for object-oriented analysis. To validate and complete the initial prototype of the tool, we ran a usability test. Although limited to a small group, the test provided meaningful feedback that is directing the next development iteration.
2010, © Copyright by authors, Published under agreement with IARIA - www.iaria.org
International Journal on Advances in Intelligent Systems, vol 3 no 3 & 4, year 2010, http://www.iariajournals.org/intelligent_systems/
198
Figure 7: The new GUI of FSSE10. The images show (top-right to bottom-left) the progression of steps needed to create two rich pictures about the same problem. The palette is defined incrementally during the creation of the first rich picture; classes and events are specified and will be permanently stored in the palette. The second rich picture can then be built, leveraging on the elements already in the palette. Notice how all typical elements of a rich picture are now supported in FSSE: classes, events and constraints (bottom-left step).
2010, © Copyright by authors, Published under agreement with IARIA - www.iaria.org
International Journal on Advances in Intelligent Systems, vol 3 no 3 & 4, year 2010, http://www.iariajournals.org/intelligent_systems/
199 After the test we reflected upon patterns of use and analyzed rich pictures in projects from various past semesters. From these we obtained a better understanding of how students create their rich pictures and what role they see for rich pictures in their project reports. The user-centered approach we followed proved of great help in better defining our tool's features: for example, the feedback received suggested us how to include support for events. Moreover, we discovered something important about programmers and their values. They like to use authoring software tools at different phases of their project and they are happy to experiment with new ones. Furthermore, we realized that a software-supported activity makes immediately more sense to them and they are more willing to engage in it. They definitely dislike hand-drawing and try to avoid it. On a more general level, designerly activities, which are by nature open, are generally considered confusing and frustrating. An important lesson to keep in mind while developing designerly tools for programmers. On the long run, we plan to improve Free Sketch, test it further, and deploy it as the main tool for a bachelor-level object-oriented analysis and design course.
[10] [11] [12] [13] [14]
[15] [16]
[17] [18] [19] [20]
ACKNOWLEDGMENT We thank the participants to our study and the anonymous referees who provided valuable suggestions to improve our paper. REFERENCES [1]
[2]
[3]
[4]
[5]
[6]
[7]
[8]
[9]
A. Monk and S. Howard, “Methods & tools: the rich picture: a tool for reasoning about work context”. In Interactions, vol. 5, n. 2, pp 2130, March 1998. K. Kotiadis and S. Robinson, “Conceptual modelling: knowledge acquisition and model abstraction.” In proceedings of the 40th Conference on Winter Simulation, Miami, Florida, pp. 951-958, December 07 - 10, 2008. L. Mathiassen, A. Munk-Madsen, P. A. Nielsen, and J. Stage, “Object-Oriented Analysis & Design”. Marko Publishing, ISBN: 877751-150-6, 1st edition, 2000. A. J. Cañas, R. Carff, G. Hill, M. Carvalho, M. Arguedas, T. C. Eskridge, J. Lott, and R. Carvajal, “Concept Maps: Integrating Knowledge and Information Visualization Export”. In Knowledge and Information Visualization journal, pp. 205-219, 2005. B. A. Nardi and J. A. Johnson, “User Preferences for Task Specific vs. Generic Application Software”. In Conference on Human Factors in Computing Systems CHI 1994, Boston, Massachusetts, USA, 1994. H. C. Mayr and C. Kop, “Conceptual Predesign - Bridging the Gap between Requirements and Conceptual Design”. In proceedings of the 3rd international Conference on Requirements Engineering: Putting Requirements Engineering To Practice, ICRE, IEEE Computer Society, Washington DC, April 06 - 10, 1998. E. Nuutila and S. Torma, “Text Graphs: Accurate Concept Mapping with Well-Defined Meaning”. In proceedings of the First International Conference on Concept Mapping, CMC 2004, Sept. 1417, 2004. A. Valente, “Visual Middle-Out Modeling of Problem Spaces”. In International Conference on Information, Process, and Knowledge Management, pp. 43-48, February 01-07, 2009. A. Valente and E. Marchetti, "Please Don't Make Me Draw!: Lesson learned during the development of a software to support early analysis of object-oriented systems". In proceedings of the Second
[21]
[22] [23]
[24] [25]
[26]
[27]
International Conference on Information, Process, and Knowledge Management (eKnow 2010) Saint Maarten, Netherlands, Antilles, pp 94-99, 2010. "VP-UML User's Guide" http://www.visual-paradigm.com/ support/documents/vpumluserguide/12/13/5963_aboutvisualp.html Last visited 19 January 2011. Microsoft Visio. http://www.microsoft.com/office/visio/ Last visited 19 January 2011. DIA tutorial. http://live.gnome.org/Dia/Documentation Last visited 19 January 2011. H. Hsieh and F. Shipman, “Manipulating Structured Information in a Visual Workspace”. In proceedings of ACM Conference on User Interface Software and Technology, pp. 217-226, 2002. L. Cardelli and A. D. Gordon, “Mobile ambients”. In Theoretical Computer Science, vol. 240, Issue 1, pp. 177-213, June 6, 2000. J. Löwgren and E. Stolterman, “Thoughtful Interaction Design. A design perspective on information technology”. MIT Press, USA, 2005. S. Yliriksu and J. Buur, “Designing with video”. Springer, 2007. D. Schön, “The reflective practitioner. How professionals think in action”. Ashgate, London, UK, 1991. J. Preece, Y. Rogers, and E. Sharp, “Interaction Design. Beyond Human Computer Interaction”. John Wiley and Sons, USA, 2002. E. Stolterman, J. MacAtee, D. Royer, and S. Thandapani, “Designerly Tools”. In Undisciplined! proceedings of the Design Research Society Conference 2008, Sheffield, UK, pp. 116/1-14, July 2008. L. Suchman, J. Blomberg, J. E. Orr, and R. Trigg, “Reconstructing Technology as Social Practice”. In American Behavioral Scientist, vol. 43 n. 3, Sage Publications, pp. 392-408, November/December 1999. L. Suchman, “Affiliative Objects”. In Organizations 2005, vol. 12, n. 3, Sage Publications, pp. 379-399, 2005. H. W. J. Rittel and M. M. Webber, “Dilemmas in a general theory of planning”. In Policy Sciences, n. 4, 1973, first edition American Association for the Advancement of Science, Boston USA, pp. 155169, December 1973. T. Ingold and E. Hallam, “Creativity and Cultural Improvisation”. Berg Publishers, 2008. A. Agarawala and R. Balakrishnan, “Keepin' it real: pushing the desktop metaphor with physics, piles and the pen”. In proceedings of the SIGCHI Conference on Human Factors in Computing Systems, CHI '06, ACM, New York, NY, Montréal, Québec, Canada, pp. 1283-1292, April 22 27, 2006. DOI http://doi.acm.org/10.1145/1124772.1124965 F. Drewes, B. Hoffmann, and D. Plump, “Hierarchical graph transformation”. In Journal of Computer and System Sciences, vol. 64, n. 2 pp. 249-283, March 2002. DOI http://dx.doi.org/10.1006/jcss.2001.1790 M. Fowler and R. Parsons, “Domain Specific Languages”. AddisonWesley Professional, 2010. ISBN: 0321712943.
2010, © Copyright by authors, Published under agreement with IARIA - www.iaria.org