Available online at www.sciencedirect.com
ScienceDirect Procedia Engineering 132 (2015) 895 – 902
The Manufacturing Engineering Society International Conference, MESIC 2015
Development of a robust and accurate positioning system in micromachining based on Camera and LCD screen O. de Francisco-Ortiza,*, H.T. Sánchez-Reinosob, M. Estrems-Amestoyc a Mecánicas Bolea S.A., Aeronautics Division, Avda. Bruselas s/n, Cartagena 30353, Spain Dpto. de Ing. de Mat. y Fabricación, Univ. Politécnica de Cartagena, C/ Doctor Flemming s/n, Cartagena 30202, Spain c Dpto. de Ing. Mecánica, Univ. de Navarra, Paseo de Manuel Lardizabal 13, Donostia 20018, Spain
b
Abstract In this proceeding, a positioning system based on a camera-screen control in micromachining has been developed. With this control system, the position of the cutting tool with respect to the workpiece coordinate system during a machining operation, has been controlled by an artificial vision algorithm. The positioning system consists of setting a path of target positions, each defined in the form of lighted LEDs on a smartphone, in order to capture them by a camera. As a result, each LED has been magnified and turned into a set of pixels due to the higher resolution of the camera. Afterwards, the developed artificial vision algorithm has used a filtering method to detect the pixels with weighted intensity values over a given threshold. The quality of the micro-machining positioner has been proved by means of two calibration tests: Back-step Test without the use of artificial vision, and an Artificial Vision Test using the camera-screen control system. The results demonstrate that the use of a screencamera closed loop control system provides appropriate accuracy in positioning the workpiece in a micro-machine tool. © Published by by Elsevier Ltd.Ltd. This is an open access article under the CC BY-NC-ND license © 2015 2016The TheAuthors. Authors. Published Elsevier (http://creativecommons.org/licenses/by-nc-nd/4.0/). Peer-review under responsibility of the Scientific Committee of MESIC 2015. Peer-review under responsibility of the Scientific Committee of MESIC 2015 Keywords: Machine tool; Precision; positioning; Accuracy; Micro-milling.
1. Introduction The development of micro components has increasingly grown over the last decades due to its application to mechanical, electrical, biochemical and optical devices. Within this framework, researchers have focused on
* Corresponding author. Tel.: +34-968-324-718 E-mail address:
[email protected]
1877-7058 © 2015 The Authors. Published by Elsevier Ltd. This is an open access article under the CC BY-NC-ND license
(http://creativecommons.org/licenses/by-nc-nd/4.0/). Peer-review under responsibility of the Scientific Committee of MESIC 2015
doi:10.1016/j.proeng.2015.12.575
896
O. de Francisco-Ortiz et al. / Procedia Engineering 132 (2015) 895 – 902
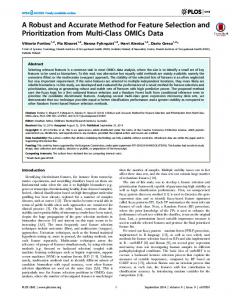
studying the cutting parameters, milling strategy, workpiece material and the cutting tool in order to improve the quality of micro-parts [1-3]. Nevertheless, techniques used in the positioning control of a micro-machine tool (MMT) are usually based on closed-loop systems. Although it is well known that the electronic devices in closed loop systems provide robust position control, they are considered expensive for many low-cost applications. Other methods are based on the development of positioning algorithms that analyse a pattern shown in a photo image [4, 5]. Within this approach, Montes et al. [6] developed an improvement on the control system, whereby a LCD screen was used as a reference system, with refreshed images as regards the type of machining operation. The method presented in this proceeding simplifies the above-mentioned method by using an artificial vision algorithm (AVA) that detects the positioning target points of a tool path shown on a screen. The control tool path is shown in the form of a pattern of LEDs, which is developed by a programming application. The camera, which is placed in front of the tool path image, takes a photo at the end of each displacement produced by the MMT actuator devices along a given axis. Furthermore, the intensity of a single lighted LED on the screen image is usually defined according to an 8-bit scale. Since the camera resolution is higher than the resolution of the screen, the lighted LED on the screen is magnified into a set of pixels. Then, the AVA filters the pixels in order to remove those which have intensity weight level under a given intensity threshold. In addition, the AVA calculates the centre of mass of this group of pixels, so as the coordinates of the target position are determined in pixel units. As a result, the axis displacement in the MMT calibration and its error can be determined. This proceeding is organized as follows. The MMT with specifically performed and improved robust design will be described in Section 2. Thereafter, the artificial vision methodology used in this research work is developed in Section 3. In section 4, the MMT has been proved by means of two tests. The first test consists of a Back Step Test, where a Coordinate Measurement Machine (CMM) carries out the measurements. The second test, consists of using the positioning system and the AVA in order to determine the positioning and repeatability errors. Finally, the conclusions related to this research work are presented. 2. Micro-machine design The research presented in this proceeding is implemented into a two-dimensional control system. Fig. 1 shows the 3D model design of the MMT demonstrator, which has been developed for this research. In the MMT demonstrator, the positioning system consists of two movable platforms that are moved by the action of two stepper motors and the use of a precision guide. The upper platform, which keeps the workpiece in held, is moved along the Y-axis guide, whilst the bottom platform is moved along the X-axis guide. Below this platform, a camera is mounted upside-down, so that its objective is located opposite to a LCD screen. The fixed positioning MMT structure, which is located on the bedplate, has been designed to contain a smartphone. The control system consists of displaying an image according to a given target tool path on the LCD screen and capturing the target position by the camera. Thus, the AVA processes the captured image in order to produce the necessary movements of the MMT axes, which jointly move with the camera.
Fig. 1. 3D model of the MMT demonstrator.
As seen in Fig. 2, both stepper engines are controlled by the digital output signals provided by a NI-USB-6001 data acquisition card connected to the USB port of a laptop. Such logic outputs are treated by a pre-amplification power stage, which is composed of two L293 H bridges. Finally, the necessary feedback for controlling the position of the workpiece is given by the USB Webcam connected to the laptop. Meanwhile, a control software program programmed in VBA embedded in Ms-Excel receives the captured image given by the camera. In addition, it
O. de Francisco-Ortiz et al. / Procedia Engineering 132 (2015) 895 – 902
processes the image according to the AVA and provides the needed feedback positioning signals to move the X and Y axes.
Fig. 2. Electronic device scheme used for controlling the machine axis position.
3. Artificial Vision Methodology The control tool path shown on the smartphone screen is based on a pattern of lighted LEDs in red color on a black background. Fig. 3 shows an example of lighted LEDs pattern, which was used to locate the movable axis platforms during the cutting operation. Each lighted LEDs pattern represents a set of possible target positions for a cutting operation (i.e. a micro drilling operation). As it will be described in the following sections, the calibration process of the MMT will follow a travel axis along a selected path of lighted LEDs. The above described pattern was made by another program, which was created in VBA, using an uncompressed bitmap BMP format. The next step accounts for the selection of one of the screen LEDs as the origin of the reference positioning system (i.e. the led in the upper-left position of the pattern).
Fig. 3. Screen pattern of lighted LEDs.
Afterwards, the AVA follows the following procedure. 1) Gap distance definition: The gap distance between the lighted LEDs is defined in order to get a minimum unit for controlling the displacements in the positioning system. For example, an Iphone 5S, with 326 ppi resolution, has a minimum gap between lighted LEDs of 0.07791 mm (which is related to 1’’/326 ppi). 2) Image magnification: After a photo is taken by the camera, all the lighted LEDs on the screen are magnified and turned into a set of pixels. Such set of pixels has different intensity levels according to a bitmap format. It is due to the fact that the resolution of the HD Camera is higher than the resolution of the screen. Fig. 4 shows one of the magnified set of pixels of the camera-image regarding a given lighted LED.
Fig. 4. Magnified camera-image of a set of pixels.
3) Filtering and fine point location: Having obtained the bitmap file with the colour intensity weights of the pixels, the next step consists of reducing the brightness and filtering according to an intensity threshold grade (i.e. 60 in a scale between 0-255). Afterwards, the fine point location consists of calculating the centre of mass of each set of pixels. For a discrete-valued function related to the intensity grade of each pixel B(i,j), where i varies in pixel
897
898
O. de Francisco-Ortiz et al. / Procedia Engineering 132 (2015) 895 – 902
units over a horizontal array of pixels, with i [1, n]. In addition, j varies over a vertical array of pixels, with. j [1, m]. As a result, the coordinates xg and yg of the centre of mass of each set of pixels can be obtained as:
xg =
n
m
i=1
j =1 i, j m
n i=1
n
x ×B(i, j )
j=1
(1)
yg =
B(i, j )
m
i=1 n
y ×B(i, j )
j=1 i, j m
i=1
j=1
(2)
B(i, j )
It is noted that n and m are the width and height, respectively of the transition area between the weighted pixels and those with value below the transition threshold. 4) Average distance between axis displacements: Having obtained the centre of mass for each control position set of pixels, the next step consists of processing the image and calculating the average for each axis displacement. For example, the average displacement depends on the differences between the xg and yg coordinates, after and before the movement. Therefore, for two consecutive images related to a given axis displacement (k+1 and k) the average distances d x and d y can be achieved according to the following equations: n
dx =
i=1
(xg k+1,i
m
xg k,i )
(3)
dy =
n
j =1
(yg k+1, j
yg k, j )
(4)
m
where k is the number of the processed image; i and j are the number of rows and columns of the matrix, respectively; and n and m are the overall number of evaluated rows and columns, respectively. 5) Aspect ratio between the LCD screen and the camera: Assuming that the smartphone image distance between two lighted control LEDs is known (i.e. 0.7791 mm is the screen gap between two consecutive lighted LEDs in a 326 ppi screen), the aspect ratio controlled by the artificial vision algorithm Gk+1,k is obtained as follows:
Gk+1,k =
Gap distance dk+1,k
(5)
where d k+1,k is the average difference between the centre of mass coordinates of two consecutive lighted LEDs within the same captured image.
d y , the next step accounts for transferring their coordinates from pixel image-units into Pm units. It is simply realized by multiplying them by their related aspect ratio Gk+1,k . Having measured
dx
and
The next step consists of activating the necessary stepper motors so as the workpiece machining coordinate (x, y) will achieve the target point coordinate on the smartphone screen, which is measured by the AVA according to the above described procedure. 4. Experimental study The experimental study has been carried out on the MMT demonstrator shown in Fig. 5, which mounts a webcam (Trust©1280×1024 pixel) and an Iphone 5S. Two stepper motors (ST28, 12V, 280 mA) moves two precision guides (IKO© BSR2080 50mm stroke), each connected to one ball screw/nut (M3). The smartphone LCD screen has a definition of 1136×640 pixels. Both stepper motors are controlled by the digital signal outputs of a low cost NIUSB-6001 data acquisition card. The output signal of the NI-USB-6001 are treated by a pre-amplification power stage composed of two L293 H bridges. The system is controlled by the software programmed in VBA embedded in MS-Excel. The specifications of the Iphone 5S LCD screen are shown in Table 1. Table 1. Specifications of the LCD screen Device
Resolution
Pixels per inch
Screen Size (mm)
Dot pitch(mm)
IPhone 5S
1136×640
326
88.5×49.9
0.078
O. de Francisco-Ortiz et al. / Procedia Engineering 132 (2015) 895 – 902
Fig. 5. MMT demonstrator manufactured for the study.
Since the aim of this study is to know the positioning and repeatability errors of the MMT, two different tests have been performed. The first test consists of a standard calibration process, which is well-known as Back-Step Test (BST), where the stepper motor moves the machine axis according to a calibration displacement without the use of artificial vision. The second test uses the AVA as the control positioning method. Both tests are described as follows. 4.1. Back-Step Test (without artificial vision) In this test the stepper motors, moves the axis according to short tracks of 0.5 mm, which is the pitch of the M3 screw. The VBA program used in the experiments controls a revolution of the stepper by sending 4096 digital pulses to the NI-USB 6001. For the calibration, two travels of 5 mm length (forward and backward) have been divided into 10 calibration tracks of 0.5 mm. Each of the travels has been repeated three times in both forward and backward directions, according to the VDI/DGQ 3441 standard [7, 8]. For each of the calibration tracks, the position of the Y axis has been measured by a Coordinate Measuring Machine (CMM), model Trimex TL Manual 2072 (with accuracy of 0.018mm). Fig. 6 shows the MMT demonstrator measured by the CMM probe.
Fig. 6. Micro-positioning system in the CMM bench.
The graph on Fig. 7 shows the positioning error results for the three forward travels along with the average error. As a result, it has been obtained a maximum positioning error Pa=0.036 mm. Y AXIS POSITIONING ERRORS
0,010 0,005
0,003 Forward Travel - Error Average
0,000
Positioning error (mm)
-0,002
-0,005
-0,006
-0,004
Forward Travel 1
-0,009 -0,009
-0,010
-0,012
-0,015 -0,017
-0,020
-0,017
-0,020
-0,018
-0,022
-0,024
-0,025 -0,026
-0,030
-0,027
-0,027 -0,027 -0,032
-0,022
-0,023 -0,025
-0,023 -0,025 -0,027
-0,031
-0,032
Forward travel 2
-0,018 -0,023
-0,023
Forward travel 3 -0,029
-0,029
-0,027 -0,032
-0,032
-0,035
-0,033 -0,033
-0,033
-0,036
-0,040 0,0
0,5
1,0
1,5
2,0
2,5
3,0
3,5
4,0
4,5
5,0
Travel positions (mm) VDI 3441 - Lineal Machine: Serial #: Date: By:
MICROMACHINING Demonstrator v1 12:46 Abril 08 2015 Mecanicas Bolea
Axis: Location: Umean: Psmean:
Y Cartagena (Murcia) 0,002 0,012
Umax: P: Ps max: Pa:
Fig. 7. Positioning and repeatability errors for the Y axis forward travel.
0,038 0,049 0,026 0,036
899
900
O. de Francisco-Ortiz et al. / Procedia Engineering 132 (2015) 895 – 902
For the backward travel, the results are represented in Fig. 8. As a result, the maximum absolute positioning error Pa=0.036 mm, the average repeatability error Ps mean=0.012 mm, and the maximum repeatability error Ps max=0.026 mm. Y AXIS POSITIONING ERROR
0,015
0,013 0,011
0,010
0,007 0,007
0,005
0,005 0,003
Positioning error
Backward Travel Average error
0,000 0,003
0,000
0,000 -0,007
-0,005
-0,010
-0,010
-0,011
-0,015
-0,014
-0,015
-0,025
-0,021 -0,025
-0,024
-0,023 -0,025
-0,025 -0,026
-0,030
-0,035
-0,015
-0,021
-0,019
-0,020
-0,029 -0,028 -0,029
-0,027
-0,032
Backward Travel 2
-0,026 -0,026
Backward Travel 3
-0,025
-0,029
-0,028 -0,029
-0,012
-0,019
-0,022
-0,021
-0,029
-0,026
Backward Travel 1 -0,009
-0,030 -0,036
-0,040 0,0
0,5
1,0
1,5
2,0
2,5
3,0
3,5
4,0
4,5
5,0
Travel positions (mm) VDI 3441 - Lineal Machine: Serial #: Date: By:
P Pa Umax Umean Ps mean Ps max
MICROMACHINING Demonstrator v1 12:46 Abril 08 2015 Mecanicas Bolea
Axis: Location: Umean: Psmean:
Y Cartagena (Murcia) 0,002 0,012
Umax: P: Ps max: Pa:
0,038 0,049 0,026 0,036
Notation Average positioning error Max absolute positioning error Max round path difference Average round path difference Average Repeatability error Max Repeatability error
Fig. 8. Positioning and repeatability errors for the Y-axis backward travel.
4.2. Artificial Vision Test This test was performed by capturing the 326 ppi resolution screen of the smartphone by a Trust©webcam with 1280x1024 resolution. Following the AVA described in Section 3, a screen of LEDs was lighted-up in red color (as seen in Fig. 3) with a separation between lighted LEDs of 0.7791 mm. The Artificial Vision Test (AVT) consisted of moving the platform of the MMT through two travels (forward and backward) along the Y axis, from 0 to 5 mm with short tracks of 0.5 mm. At the end of each track, a camera shoot was made, thus resulting 10 bmp images. As was described in Section 3, each LED of the smartphone screen has been magnified into a set of pixels with different color intensity weights. Afterwards, the bitmap image with regard to each calibration track has been processed by the AVA. The AVA takes into account the weighted intensity values related to a lighted LED (e.g. Fig. 9 represents the weighted values matrix of a LED on the upper-left corner of the screen).
Fig. 9. Weighted intensity values for the lighted led on the top of the upper-left image corner.
The most favorable control system should be positioned on the centre of mass of a given set of pixels, which can be assessed by equations (1) and (2). For the calibration along the Y axis, each captured image is composed of 400
O. de Francisco-Ortiz et al. / Procedia Engineering 132 (2015) 895 – 902
lighted LEDs (which means that there is a grid of 20 rows by 20 columns of lighted LEDs). Since the number of rows of lighted LEDs captured by the camera is of 20, it was then calculated a number of 19 average distances d y . Table 2 shows the average distance values, where the third column is obtained by multiplying each value of the first column by its related aspect ratio Gk+1,k . Table 2. Values of the estimated distance measured by the AVA for the first track of the forward travel 1.
Number of average distances
dy
Gk+1,k
dy
(pixel units)
(Pm/pixel)
(Pm)
1
32,535
15,239
495,788
2
32,470
15,302
496,861
3
32,470
15,314
497,248
4
32,289
15,347
495,555
5
32,330
15,365
496,770
6
32,212
15,402
496,112
7
32,192
15,404
495,898
8
32,159
15,453
496,948
9
32,117
15,461
496,543
10
32,077
15,480
496,538
11
32,015
15,498
496,163
12
32,010
15,445
494,403
13
32,013
15,570
498,438
14
31,978
15,525
496,466
15
31,967
15,535
496,603
16
31,948
15,525
495,987
17
31,970
15,537
496,728
18
31,917
15,533
495,772
19
31,947
15,558
497,019
Average of the first track dtrack1
496.414
Following a similar procedure for each of the tracks of an axis travel, 10 estimated values of d y have been obtained. Table 3 represents the d y of the measured displacements of each track position of the Y axis travel. The positioning and cumulative errors of the tests developed in this work (BST with CMM and AVT) are also shown. Noted that the positioning errors are worked out from the difference between the d y and the nominal track movement of 500 Pm. Table 3. Positioning and cumulative error for the AVT and the BST tests.
Calibration track number
Measured distance
dtrack (Pm)
1
496,413
BST CMM
BST CMM
error
(Pm)
positioning error
cumulative error
(Pm)
(Pm)
(Pm)
-4
-4
-4
-4
AVT positioning error
AVT cumulative
Difference between AVT-BST cumulative errors (Pm) 0
901
902
O. de Francisco-Ortiz et al. / Procedia Engineering 132 (2015) 895 – 902 2
485,208
-15
-19
-13
-17
2
3
504,328
4
-15
-15
-32
-17
4
494,458
-6
-21
1
-31
-10
5
500,643
1
-20
4
-27
-7
6
489,433
-11
-31
-5
-32
-1
7
495,610
-4
-35
5
-27
8
8
499,832
0
-35
0
-27
8
9
491,333
-9
-44
-6
-33
11
10
507,533
8
-36
-3
-36
0
It is noted that the average value of the cumulative error differences between the AVT and the BST is only of 0.6 Pm. In addition, no difference has been observed between the cumulative errors at the end of the axis travel. 5. Conclusions An artificial image processing method with a screen-camera micro-positioner has been implemented in a MMT. The MMT image positioner has been embedded in a feedback loop to realize a precise position control. The results showed that the control image positioner achieved a good degree of positioning accuracy with good robustness. This two-dimensional positioner is a preliminary experimental device that will be enhanced in the future with the application of mechanical and electronic improvements to be performed implemented in the MMT. The installation of a new camera with higher resolution and further accounting for the gap distance between the screen and the camera is under investigation. With this implementation, it will be possible to achieve a decrease of the aspect ratio (Pm/pixel) and thus, a positioning accuracy improvement. Acknowledgements This research work was not supported by any specific grant coming from any public, commercial or non-profit agency. It is part of the author’s duty for research at work at the Technical University of Cartagena and University of Navarra. The authors would like to thank the student Francisco Vidal for the assistance with the AVM programming and test as well as Mecánicas Bolea S.A. for allowing the use of the CMM. References [1] J. C. Aurich, I. G. Reichenbach, G. M. Schüler. Manufacture and application of ultra-small micro end mills, CIRP Annals - Manufacturing Technology, 61 (2012), pp. 83-86. [2] S. Min, H. Sangermann H, C. Mertens, D. Dornfeld. A study on initial contact detection for precision micro-mold and surface generation of vertical side walls in micromachining. CIRP Annals - Manufacturing Technology, 57 (2008), pp.109–112. [3] T. Özel, T. Thepsonthi, D. Ulutan, B. Kaftanoglu. Experiments and finite element simulations on micro-milling of Ti–6Al–4V alloy with uncoated and CBN coated micro-tools. CIRP Annals - Manufacturing Technology, 60 (2011), pp. 85–88. [4] D. Leviton. Method and Apparatus for Two-dimensional Absolute Optical Encoding. U.S. Patent 6,765,195 B1. (2002). [5] D. Chu, H. Trujillo, E. Whitney, J. Young. Rapid High Resolution Absolute 2-D Encoding by Low Resolution Digital Imaging of a Mathematically Generated 3-Tone Target. ASPE Proceedings (2006). Santa Clara, CA, USA. [6] C. A. Montes, J. C. Zieger, C. Wong, L. Mears, T. Tucker. 2-D absolute positioning system for real time control applications. ASPE Proceedings (2010). Atlanta, GA, USA. [7] B. Denkena, F. Hollmann. Process Machine Interations. Springer Verlag (2013). Berlin, Germany. [8] VDI/DGQ 3441. Statistical Testing of the Operational and Positional Accuracy of Machine Tools. Basis; (2003).