DEVELOPMENT OF ACTIVITIES INTEGRATING PHET INTERACTIVE SIMULATION FOR TEACHING LINEAR EQUATION Christy Namae M. Bellingan, Amelia T. Buan Mary Khryss A. Calang Roselyn C. Gabuya Department of Science and Mathematics Education, College of Education Mindanao State University -Iligan Institute of Technology E-mail:
[email protected],
[email protected] and
[email protected] Abstract. In this study, activities that involve topics of slope, slope-intercept and point-slope form of a line integrating PhET Interactive Simulation in graphing lines were developed and validated. It was conducted in the two sections of grade 8 students of Iligan City National High School-Tambacan Annex using the comparative experimental research design. The two groups were matched according to their gender and grade in Mathematics for the first quarter. The development of activities involved; (a) determining the topic; (b) mapping of K-12 curriculum standards to the learning competencies; (c) writing the activities; and (d) validating and revising the activities. Findings showed that the activities integrating PhET Interactive Simulation are good instructional materials based on the provided rubric which was evaluated by the in- service and pre-service teachers. Results using one tailed t-test showed that there was a significant difference between the performances of the control group and experimental group in the activities and worksheets. This implies that the developed activities integrating PhET Interactive Simulation are better than the developed activities without the integration of Simulation. Furthermore, the students attributed positive perceptions on the developed activities integrated with PhET Interactive Simulation in graphing lines.
INTRODUCTION In the academe, it is undeniably true that one of the problems that the students are greatly facing nowadays is the area of Mathematics. Often, students get anxious even with the talks of it. At the beginning of the lesson, most students already have fears and negative thoughts on themselves which hinder them in learning the course (Lewis, 2013). Learning Mathematics can be difficult when you do not have the right tools or the right materials, especially if a child grew up believing that Math is hard and that it will never be understood. As a complementary tool, dynamic Mathematics software is a good attribute. Physics Education Technology (PhET) is a project hosted by Colorado University which created more than 110 freely available well-researched interactive simulations for teaching physics, chemistry, mathematics, and other sciences. The PhET website authorizes that simulations may be freely used and/or redistributed by third parties (e.g, students, educators, school districts, museums, publishers and etc.). PhET provides fun, free, interactive, research-based science and mathematics simulation. In connection to this, the researchers used the graphing lines simulation of PhET and developed three activities that involved topics in linear equation, specifically the lessons on slope of a line, slope intercept form of a line and point-slope form of a line. Thus, this study aims to utilize the developed activities integrating the online software of PhET Interactive Simulation in graphing lines.
Scope and Limitations This study focused on the development and evaluation of three PhET Interactive Simulation supported activities, embedded in the 5E’s lesson plan. The researchers measured the performance of the control group and the experimental group which will undergo treatment. The study was conducted on October 2017 and lasted only 5 days and it was limited to the use of PhET Interactive Simulation in Graphing Lines. In this study, the lack of computers and connectivity are some difficulties faced by the researchers. Since the ICNHS-Tambacan Annex does not have enough computers in the computer laboratory, the researchers used several laptops to allow the respondents to do the activity. Conceptual Framework The researchers integrated the use of PhET Interactive Simulation in teaching linear equation since the researchers believed that students learn best when they have hands-on experience on the lessons.
PRIOR
Development of the activities in slope, slopeintercept and point-slope.
Skill on plotting points Validation of the developed activities
Develop activities in slope, slopeintercept and point-slope. Better understanding in Graphing lines of Linear Equations. Perception of the students
Implementation of the activities.
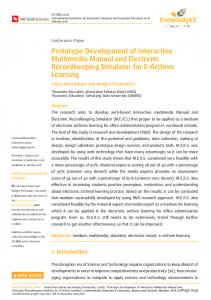
Figure 1. Schematic Paradigm of the Flow of the Study In this study, the grade 8 students already had a skill on plotting points. Then, the students were exposed to different atmosphere of teaching-learning engagements; one was subjected to a teachinglearning process using the traditional method, while the other group was exposed to a process of integrating PhET Interactive Simulation. The researchers developed anofactivity on slope, slope-intercept and pointImplementation slope. The developed activities were validated through face validation by the adviser, and in-service and Phet pre-service teachers. After the revision, the Simulation activity items were implemented. Lastly, a perception for Graphing questionnaire was given to the students to know their insights on the developed activities integrating PhET Interactive Simulation. Lines
METHODOLOGY Subject of the study The target respondents of the study were two sections of Grade 8 students in ICNHS- Tambacan Annex, Iligan City, chosen purposely such that they have more or less the same intellectual capabilities. The basis of choosing the sample was their compatibility in terms of their gender and grades in Mathematics for the first quarter that ranges from 81 to 88. There were two selected group of respondents but only those who have the same gender and grade would be considered. One group was the experimental group exposed to the use of PhET Interactive Simulation in Graphing Lines, and the other one was the control group which experienced the traditional way of teaching. Sixty-five (65) respondents from experimental group were matched to the sixty-five (65) respondents from control group. There were 15 respondents from experimental group and 15 respondents from control group who have the same gender and grade in Mathematics. There were activities given to two groups; one group with the integration of the simulation and the other group without the integration of the simulation. Also, there were worksheets given to both groups. The results of the activities and worksheets would determine which is more effective between the two presented ways. Research Design In this study, the researchers used the comparative experimental research design. The researchers wanted to know if the result of the developed activities integrating PhET Interactive Simulation of the experimental group is better than the result of the developed activities without the integration of the PhET Interactive Simulation of the control group in teaching linear equations. This study was done through a purposive sampling method utilizing the developed activities with two groups approach – the control and experimental group, with qualitative support. The qualitative support was in the form of questionnaire. Research Instruments a. Developed Activities. The researchers created three activities (slope of a line activity, slopeintercept form of a line activity and point-slope form of a line activity) integrating PhET Interactive Simulation. Also, the researchers created three activities without the integration of PhET Interactive Simulation. b PhET Interactive Simulation. This refers to an interactive web-based visual presentation of a dynamic object that presents opportunities for mathematical knowledge. PhET Interactive Simulation was integrated in the classroom discussion on Linear equation. c. Perception Questionnaire. The researchers made three items open-ended questions to know how the respondents perceive the developed activities in slope of a line, slope-intercept form of a line and pointslope form of a line with the integration of PhET Interactive Simulation in Graphing Lines. d. Lesson plan. These were the researchers’ detailed description of the course of instruction in a class. A daily lesson plan in slope of a line, slope-intercept form of a line and point-slope form of a line for the control and experimental group were developed to guide the teacher during the implementation of the activities. It was patterned with the K-12 Basic Education Curriculum Guide and followed 5E’s Learning Cycle. e. Worksheets. This served as an assessment for every lesson presented to the students to evaluate their conceptual understanding in every topic.
f. Rubric. The researchers adapted a rubric from Neas (2015) which was used by the six (6) in-service teachers in evaluating the reliability of the researcher-made lesson plan. The same rubric was used for the evaluation of the developed activities integrated with PhET Interactive Simulation which was evaluated by 6 in-service teachers and 8 pre-service teachers. The rubric was valid instrument for evaluating the activities based on the inter-rater reliability result which showed reliability of 0.76. Data Gathering Procedure In this study, the whole process for gathering the data were (a) development of the activities, (b) validation and evaluation of the activities, (c) implementation of the activities, (d) perception administration. Development of the activities
Validation and Evaluation
Implementation of PhET Interactive Simulation
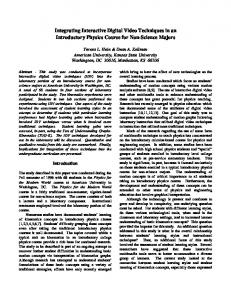
Perception Administration Figure 2. Data Gathering Procedure The first step was the mapping of the objective to the Grade 8 competency under the K to 12 Basic Education Curriculum. After mapping, the researchers used PhET Interactive Simulation on graphing lines as instrument for the activity. The face validation of the activities was validated by the adviser and some experts in the field. It was then piloted to the selected grade 8 students. Before the implementation, revisions of the activities were done by integrating all the comments, suggestions of the mathematics education experts and the result of the pilot testing. The researchers created 6 lesson plans: three lesson plans for the experimental group embedding the activities integrated with PhET Interactive Simulation and another three lesson plans for the control group using an activity without the integration of PhET interactive simulation. Face validation for the lesson plans was also done by the adviser and in-service teachers. Revision of the lesson plan was done according to the comments and suggestions of the adviser and the in-service teachers. Before conducting the implementation, the researchers sought permission from the principal of ICNHS- Tambacan Annex to handle two sections of grade 8 students for five school days. A permission letter addressed to the school principal was made. The researchers conducted an orientation to the respondents specifically the experimental group regarding the activities and the use of PhET simulation in graphing lines. The lesson was given on the second day; first session for the experimental group embedding the activity; and second session for the control group with traditional method of teaching. A worksheet was made to evaluate the performance of the students in linear equation. The implementation lasted for 5 days only. The results of the worksheets of the control and experimental group were compared and analyzed. The respondents’ perception about PhET Interactive Simulation supported activities was also considered.
FINDINGS Preparation and Planning of the Activity A. Lesson Plan. This was the researcher’s detailed description of the course of instruction in a class. Daily lesson plan on slope of a line, slope-intercept form of a line and point-slope form of a line were developed to guide the respondents during the implementation of the activities. Aligned with the K-12 Basic Education Curriculum Guide, the researcher-made lesson plans consisted of six (6) sets, three with an embedded activity integrating PhET Interactive Simulation in Graphing Lines and another three lesson plans without the integration of PhET Interactive Simulation in Graphing Lines for the control group. The researchers followed 5E’s (Engage, Explore, Elaborate, Explain, Evaluate) Learning Cycle Model because it is a first-hand computer program for the grade 8 students. It is necessary for the researchers to give introduction about PhET Interactive Simulation software which was in fact the Engagement stage. Also, it is important to allow students to manipulate the software for them to familiarize the application tools, which marked Exploration stage. In Explanation stage, students acquired opportunities to connect their previous experiences with current learning of the main idea of the topic. Wherein in Elaboration stage, students applied or extended previously introduced concepts and experiences to new situations. Lastly in Evaluation stage, students, together with their teachers, reviewed and assessed what they have learned and how they have learned the topic studied. B. Worksheet. The researchers made three worksheets, one for each lesson on Linear Equation (slope of a line, slope-intercept form of a line and point-slope form of a line) which served as an assessment in every lesson presented to the respondents in order to evaluate their understanding on the topic. Development of the Activities PhET Interactive Simulation was utilized to develop three Mathematics activities particularly on the topic Linear Equation. The following constructions of sections were made to derive three activities integrating PhET Interactive Simulation on graphing lines. A. Determining of Topic. The researchers made the determination of topic based on the PhET Interactive Simulation features and limitations to be used for the experimental and control group. The researchers first determined the appropriate topic that the PhET simulation can perform taking into consideration the features and limitations of the software. Furthermore, the researchers also considered the factor of time in gathering the data. B. Mapping of K-12 Curriculum Standards to the Learning Competencies. After the researchers selected specific topics to incorporate in the activity, alignment of the learning competencies was followed. The objectives of the activities were aligned with the K-12 Curriculum Guide to assure total learning compliant to the educational goals of the Department of Education. C. Writing of the Activities. After the determination of topic and alignment of the learning competencies were made, the researchers’ next step was to develop three activities integrating PhET Interactive Simulation and three activities without the integration of PhET Interactive Simulation. Each activity consisted of title, introduction, objectives, materials, time duration, procedures, data analysis and calculation. Evaluation of the Developed Activities The developed activities integrated with PhET Interactive Simulation were evaluated by six (6) inservice and eight (8) pre-service teachers using a rubric adapted and modified by the researchers from Neas (2015), which was later face-validated by the adviser. Rating of the Developed Activities
The overall ratings of the 6 in-service and 8 pre-service teachers who evaluated the researchers’ developed activities entitled “How Steep Am I”, “Can’t Move Side by Side” and “Drag me anywhere” based on the provided rubrics. The results showed that the rating of the Title, Objective, Introduction, Procedures, Materials, Layout, and Teaching Approach ranges from 7.00 to 8.54 for activity 1, 6.46 to 8.88 for activity 2 and 7.00 to 8.54 for activity 3. Its overall rating is good. This shows that the developed activity 1 is acceptable and can be used as instructional materials for grade 8 students. Revisions of the Developed Activities Prior to its implementation, revisions on the developed activities were done based from the results of the pilot testing, ratings, comments and suggestions of the in-service and pre-service teachers for further improvement. Evaluation of the Lesson Plan The researchers made three lesson plans for the control group and another three lesson plans for the experimental group. These were evaluated by the in-service Mathematics teachers using rubric adapted from Neas (2015) and was face-validated by the adviser. Implementation of the Activity Comparison of the Control and Experimental Group in the Activities and Worksheets Table 1. Performance of the Control and Experimental Group in the Activities. Mean SD Group n ̃ SD Diff. Diff. t p – value 𝒙 Control 15 31.6 2.08 10.33 3.54 1.71** 8.31 × 10⁻¹² Experimental 15 41.93 2.87 **Highly Significant 𝒂 = 𝟎. 𝟎𝟓 𝑯𝟎𝟏 : There is no significant difference between the performance of the control and experimental group in the activities. Table 1 shows that the performances of control group and experimental group differ significantly. The control group (𝑥̃=31.6, SD=2.08) showed lower performance compared to the experimental group (𝑥̃=41.93, SD=2.87). As shown by the very small p-value, data guaranteed that the mean difference of 10.33 is highly significant at 𝑎 = 0.05. This means that there is a significant difference in the performances of the control and experimental group in the developed activities. Furthermore, this implies that the developed activities integrated with PhET Interactive Simulation are better than the developed activities without the integration of PhET Interactive Simulation. Table 2. Performances of the Control and Experimental Group in the Worksheets Mean SD Group n ̃ SD Diff. Diff. t p – value 𝒙 Control 15 23.13 1.30 5.67 1.76 2.05** 7.38 × 10⁻¹³ Experimental 15 28.8 1.19 **Highly Significant 𝒂 = 𝟎. 𝟎𝟓 𝑯𝟎𝟐 : There is no significant difference between the performance of the control and experimental group in the worksheet.
Similarly, Table 2 shows that the result on the test of significant difference of the control and experimental group is highly significant. The control group (𝑥̃=23.13, SD=1.30) displayed lower performance compared to the experimental group (𝑥̃=28.8, SD=1.19). The mean scores differ by more than 5 points, which is highly significant at the 0.05 level. This means that there is a significant difference in the performance of the control and experimental group in the worksheet. This further implies that the developed activities integrated with PhET Interactive Simulation are better than the developed activities without the integration of PhET Interactive Simulation. Respondents’ Perception The respondents’ perception on the PhET Interactive Simulation Graphing lines activity on the first question (What are the things you liked about the activities integrating PhET Interactive Simulation?). The students’ expressed that the things they like about the activities were its colorful graphics, hands-on application and guided procedure. For the second question (In what way does the activity help you understand the concept of linear equation?), majority of the respondents answered that the activity helped them in knowing the trends of linear equation, understanding the concept of Slope, Slope-intercept and point-slope form of a line. And for the third question (What are the challenges you encountered in the activities?), the students’ described that the challenges they have encountered in the activities were the activities itself, time management and answering the activities using the computer. They do not have the expertise on using the computer but still managed to perform the activity successfully.
CONCLUSIONS The developed activities integrating PhET Interactive Simulation software are valid and effective instructional materials as supported and sustained by the evidences drawn from findings. To summarize: 1.
2.
3.
4.
The developed activities are Good and useful instruments for teaching linear equation in the K12 Curriculum based on the ratings of six in-service teachers and eight pre-service teachers using the rubric that was adapted from Neas (2015). The adopted rubric from Neas (2015) was valid instrument for evaluating the activities based from the result using inter-rater reliability which has the reliability of 0.76. The developed activities were embedded in the 5E’s lesson plan for the classroom implementation. There is a significant difference in the performance of the respondents in the control group and experimental group in the developed activities and worksheets based on the result of the t-test conducted. This implies that the developed activities integrating PhET Interactive Simulation is better than the activities without the integration of the simulation. The respondents attributed positive perceptions on the developed activities. The respondents claimed that the developed activities integrating PhET Interactive Simulation helped them to have a better understanding of the slope of a line, slope-intercept form of a line and point-slope form of a line. Based on the perception of the respondents, the PhET Interactive Simulation made the activity easier to answer because of its hands-on application and guided procedure. The result of the study confirms the result of Buan and Rodriguez (2018) and Masthur and Buan (2016) that asserts that the integration of technology in the teaching-learning process yields positive effects in students’ performance and behaviors.
Recommendations The researchers strongly recommended the use of PhET Interactive Simulation Graphing lines in Mathematics classes. The researchers encourage the Mathematics Teachers in Grade 8 to conduct this activity in their classroom. However, it is also recommended that the possible teacher-user and some future researchers to: 1. Modify activities, if necessary and construct more questions for the activity. 2. If available, use wireless mice. 3. Extend the duration of the study to a longer number of days to also determine the extent of the integration of PhET Interactive Simulation in teaching Linear Equations. 4. Utilize other PhET simulations in Mathematics and develop other enrichment activities to maximize PhET’s potential to be integrated in teaching mathematics lessons. 5. Use the potentials of Physics Education Technology (PhET) in other fields like Biology, Chemistry, Earth Science and General Science. 6. Use the rubric for evaluating the activity since it was valid based from the result of inter-rater reliability that has reliability of 0.76. References Adams, W.K. (2008). PhET look and feel. Retrieved on September 30, 2016 from University of Colorado, Physics Education Technology website http://phet.colorado.edu/webpages/publication/PhETlookandfeel.pdf. Buan, A. & Rodriguez, R. (2018). Development of a microlesson in teaching energy levels of atoms (Published thesis). Retrieved on January 5, 2018 from American Institute of Physics site https://doi.org/10.1063/1.5019503. Corpuz, B.B. and Paz I. L. (2008). Educational Technology I Quezon City: Lorimar Publishing INC. . Gahala, J. (2001). Accepting New Roles for Teachers in the classroom. In critical Issue: Promoting technology use in school. http://www.ncrel.org/sdrs?areas/issues/methods/teachnology/ te200htm.
Hurme, E. (2005). Continuing education for mathematics teachers of secondary education to use computer more Effective and Improve Education. Retrieved on September 22, 2016, from http://edtechreview.in/news/705-benefits-of-technology-in-education. Le Master (2010). PhET: Interactive Simulation for Teaching and Learning Physics. Retrieved on September 30, 2016 from http://phet.colorado.edu/ teacher_ideas/browse.php. Leu, R. Y. (2001). The Benefits of Technology in Education. Retrieved on September 22, 2016, from EdTechReview website http://edtechreview.in//705-benefits-of-technology-in-education. Linog, B. L. (2013). PhET Simulation-Aided Lessons and Demonstrations: Approach to Enrich Students Understanding on the Least-Learned Competency in Physics Education (Unpublished master’s thesis). School of Graduate Studies. MSU-IIT. Lucido, P. (2008). Curriculum Development. Quezon City: Lorimar Publishing INC. Masthur, Zohayrah Dumaraya. (2016). Development of an Activity in Hisab Utilizing Physics Education Technology (PhET) Simulation. (Unpublished master’s thesis). School of Graduate Studies. MSU-IIT.
Mckagan, S. (2008). PhET: Interactive Simulation for Teaching and Learning Physics. Retrieved September 30, 2016 from http://phet.colorado.edu/teacher_ideas/browse.php Metiri Group. (2003). EnGauge 21st Century Skills: Literacy in the Digital Age. Retrieved on October 10, 2016 from http://www.metiri.com/21/21%20Century%20Skills%20Final.doc. Moursund, D. (2016). Education World.Inc.All. Retrieved (September http://www.educationworld.com/a_curr/mathchat/ mathchat018.shtml.
30,
2016)
from
Neas (2015). Assessment Validation. Retrieved on February 15. , 2017 from http://www.neas.org.au Novak, J. (1998). Learning, Creating and Using Knowledge: Concept Maps as Facilitative Tools in Schools and Corporations. American Educational Research Journal, 47(4), 833–878. Oak, M. (2011). Technology in Schools: The Importance of Technology in Schools. Retrieved on September 22, 2016, from http://www.buzzle.com/articles/importance-of-technology-in-school.html. Partnership for 21st Century Skills. (2004). Framework for 21st Century Learning. Retrieved on October 10, 2016 from http://www.21stcenturyskills.org/index.php?option=com_content&task=view&id=254&Itenid=120. Perkins (2006). PhET look and feel. Retrieved September 30, 2016 from University of Colorado, Physics Education Technology website http://phet.colorado.edu/webpages/publication/PhETlookandfeel.pdf. Plowman, Y.N and Piu, I.S. (2005). Teachonoly in Schools: The Importance of Technology . Retrieved on September 22, 2016 from http://www.buzzle.com/articles/importance-of-technology.html. Pololefsky (2010). Use of Analogy in Learning Physics: The role of representation. Physical Review, Special topics : Physics Education Research. Retrieved from University of Colorado, Physics Education Technology website http://phet.colorado.edu/web-pages/publication/PhET. Santos, J.P. (2005). The Personal Experience of Language Teachers Using Computers as an Instructional Tool (Unpublished undergraduate thesis). BEE-General Education, College of Education, MSU-Iligan Institute of Technology. Smith,
R. D. Simulation Article. Retrieved on http://www.modelbenders.com/encyclopedia/encyclopedia.html
October
8,
2016
from
Vega, V. A., Preito, N.G, & Carreon, M.L . (2006). Social Dimension of Education. Quezon City: Lorimar Publishing INC. Wieman, C.E. (2008). PhET look and feel. Retrieved on September 30, 2016 from University of Colorado, Physics Education Technology website http://phet.colorado.edu/webpages/publication/PhETlookandfeel.pdf.