Hindawi Publishing Corporation Journal of Sensors Volume 2016, Article ID 8425758, 8 pages http://dx.doi.org/10.1155/2016/8425758
Research Article Development of Ammonia Gas Sensor Using Optimized Organometallic Reagent J. Aubrecht and L. Kalvoda Faculty of Nuclear Sciences and Physical Engineering, Czech Technical University in Prague, Brehova 7, 11519 Prague, Czech Republic Correspondence should be addressed to J. Aubrecht;
[email protected] Received 27 November 2015; Accepted 6 March 2016 Academic Editor: Ming Tang Copyright © 2016 J. Aubrecht and L. Kalvoda. This is an open access article distributed under the Creative Commons Attribution License, which permits unrestricted use, distribution, and reproduction in any medium, provided the original work is properly cited. Reliable, continuous, and spatially distributed monitoring of dangerous or irritating chemical substances belongs to standard functions of contemporary industrial and public security systems. Fiber-optic-based detection provides feasible platform to fulfill such aims. This paper deals with characterization of ammonia sensing elements based on multimode polysiloxane-clad silica-core optical fibers sensitized with 5-(4 -dioctylamino phenylimino) quinoline-8-1 cobalt bromide complex reagent immobilized into the cross-linked polymer matrix from a proper mixture of organic solvents and a radical scavenger contributing to the desired longterm stability of optical properties. The applied sensing mechanism combines optical detection principle with chemical reaction of the reagent and ammonia resulting in changes in the visible near-infrared optical absorption spectrum of the cladding layer, influencing via evanescent optical field interactions the spectral distribution of the guided light intensity. Reaction kinetics of short fiber sections exposed to ammonia/nitrogen mixture of various ammonia concentrations is tested and evaluated. The obtained sensitivity, limit of detection, and forward response time of the prepared sensors amount to 1.52 ∗ 10−5 ppm−1 , 31 ppm, and 25 s, respectively. The obtained results are promising for fabrication of distributed fiber-optic sensors applicable to detection and location of ammonia gas leaks in industrial as well as general public premises.
1. Introduction Precise and reliable detection of gaseous ammonia is of common interest due to its broad and diversiform range of roles in various environmental processes and industrial technologies [1]. Owing to the physical properties of ammonia gas, such as the low boiling temperature or large heat capacity, ammonia is in the wholesale use as the coolant medium in large-scale refrigeration facilities [1]. The possible ammonia leakage and later exposition to ammonia gas can cause serious health problems for humans and ecosystems, even at low concentrations in range of tens ppm. Thus, rapid and trustworthy leak detection and location are of high importance for all security systems used in industrial facilities dealing with ammonia gas. In the last decades, many measuring schemes of ammonia gas have been proposed and developed. The metal oxide sensing heads (mostly based on SnO2 thin layers) are widely applied at present. These sensors are rugged and
inexpensive and operate on the principle of conductance changes due to adsorption of gas molecules on the sensing layer surface [1]. However, these sensing devices show also several substantial drawbacks, such as the low gas selectivity or insufficient long-term stability [2]. Improvement of ammonia selectivity has been recently achieved with the sensors registering changes of conductivity of thin semiconductor layers [3]. Another class of ammonia sensors involves catalytic sensors. The charge carrier concentration in the catalytic metal is altered due to the change in concentration of the gas of influence. Selectivity of these sensors is limited by morphology of the metal layer and the operating temperature [4]. In order to enhance the detection selectivity, polymer materials have been also studied. Chemical reduction of the polymer film causes a change in its electric conductivity evaluated by a resistometric or amperometric method. An additional regenerative mechanism must be applied in order to achieve reversible operation of the sensor.
2 An alternative to application of conductivity sensors for ammonia detection is provided by the sensors incorporating optical fibers. These sensors utilize interaction of the guided light field with its environment; via carefully selected detection mechanism leading to proper changes of optical properties, the fibers can be in principle used for repeated and selective detection of ammonia gas. The so-called direct fiberoptic sensors take advantage of intrinsic ammonia absorption bands located in ultraviolet (UV) spectral region. Cross-sensitivity to presence of water vapors and/or other atmospheric gases is the main feature limiting application of these sensors [5]. Stable and reversible response with sensitivity in range of ppm is obtained for plastic optical fiber sections sensitized by suitable reagent using sol-gel technique. However, slow response limits practical applications of such sensing elements [6]. Polymer-clad silica (PCS) fibers with silica-core and polymer cladding have been intensively explored in construction of indirect fiber-optic chemical sensors, especially those utilizing a distributed sensing schema. One of the classical detection concepts is based on registration and analysis of changes occurring in optical absorption of an immobilized (molecular) reagent in presence of the selected target analyte. Such reagents can be prepared to show a strong absorption bands in the spectral interval 700–900 nm coinciding with the emission range of common fiber-optic light sources, as well as with one of the high transmittance windows of silica optical fibers. In comparison with other types of ammonia sensors, fiber-optic sensors are potentially superior with regard to their distributed sensing features and safety level aspects and competitive in respect to their selectivity and sensitivity [7]. To use sensors fibers in the length of (at least) several hundred meters, the technology applied to the sensing transducer fabrication must not seriously degrade the transmitting quality of the fiber and, at the same time, provide the desired sensing functionality. Although subjected to longtime intensive research, successful fabrication of a practically applicable distributed fiber-optic ammonia gas sensor of the latter type has not been achieved yet. The main difficulty lies in preparation of chemically stable, selective, and reversible chemooptical transducer. In this paper, we describe our results achieved in preparation and characterization of improved chemooptical converting layers based on a standard poly(dimethylsiloxane) (PDMS) matrix doped with optimized ammonia-selective organometallic reagent by using an immobilization procedure performed from the suitable organic solution of the reagent. In comparison with the former studies attempting to utilize the same immobilization technology [8, 9], the key improvement is provided by use of the 5-(4 -dioctylamino phenylimino) quinoline-8-1 cobalt bromide complex and its chemical stabilization in the cross-linked PDMS environment. A good control of the sensitization process is possible due to the moderate lipophilicity of the reagent caused by presence of two octyl sidechains and bromide counter-anion. Cobalt (II) as the central ion of the reagent complex provides balanced affinity (necessary for the fast and concentrationcontrolled operation of the final sensor) to both the quinoline ligand and the target ammonia molecules.
Journal of Sensors
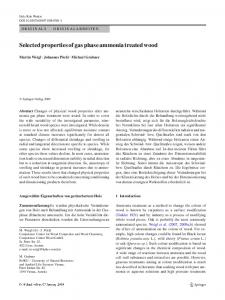
2. Experimental 2.1. Preparation and Characterization of Reagent in Solution. Heptane, isopropyl alcohol, cobaltous bromide, and other chemicals and solvents were obtained from Lach-Ner and Sigma Aldrich. The organic ligand (5-(4 -dioctylamino phenylimino) quinoline-8-1, further on referred to as L) was synthetized according to the general procedure described by Kubo et al. [10]. The solution of organometallic complex was prepared by stirring a given amount of ligand in nonpolar solvent mixture followed by addition of metallic salt dissolved in polar solvent (more details are given below). All solutions were prepared under room conditions. The absorption properties of ligand solutions and formation of complex were checked by means of VIS-NIR absorption spectroscopy. 2.2. Reagent Immobilization and Preparation of Fiber Sections. The custom-made PCS optical fibers (polysiloxane cladding and quartz core, 200/280 𝜇m core/cladding in diameter) were used in the experiments. Short sections of optical fibers (about 30 cm in length) were washed in a mixture of heptane and isopropyl alcohol for several hours in order to remove the residual cross-linking catalysts prior to further sensitization. The pretreated fibers were then inserted into the reagent solutions and the reagent was soaked into the fiber polymer cladding from the heptane/isopropyl alcohol solution. The ligand was dissolved in heptane solution and cobalt bromide in isopropyl alcohol solution; fibers with enhanced chemical stability were prepared from reagent solutions containing small amount of testosterone. After removal from the solution, the fibers were washed in ethanol to clean up the polymer cladding surface. Sensitized fibers were left to dry for several hours at room temperature under either air or argon atmosphere. A virgin fiber (without the reagent soaked in) was taken as the reference sample. 2.3. Optical Absorption Measurements. Changes of optical absorption of the tested sensitized fiber during its interaction with ammonia were evaluated by means of VIS-NIR absorption spectroscopy. The experimental setup consisted of a wideband deuterium/wolfram light source (DTM 6/10 UV/VIS Lamp module; 200–1100 nm wavelength range), multimode optical patch cords, measuring chamber with separated input and output of the testing gas mixture, and optical spectrometer (Ocean Optics S 1000, 200–1200 nm spectral region). Schema of the experimental setup is shown in Figure 1. Reference conductometric sensor was situated in the testing chamber. The concentration of the ammonia/nitrogen mixture was adjusted by two mass flow controllers (MFC; Celerity U1661) operated by an external programmable DC power supply (NDP-4303, Manson, output range 0–30 V, 0– 3 A), and the real analyte concentration was read from the voltage outputs of the particular MFC using a 4-channel voltmeter. Various analyte concentrations were injected into the testing chamber and the related spectral changes of light transmitted through the tested fiber recorded and evaluated. Successive expositions by the analyte were followed by nitrogen
Journal of Sensors
3 Table 1: Calculated parameters of the calibration curves. (a) −4
Parameters of the linear fit Channel (770–630 nm) Channel (810–630 nm)
𝐵 [10−4 ppm−1 ]
𝐴 [10 ] Value 2.13 −8.17
ESD ±1.54 ±10.83
Value 0.152 0.298
ESD ±0.0034 ±0.0201
𝑅2 0.999 0.989
(b)
Parameters of the exponential fit Channel (770–630) Channel (810–630)
𝐴 [—] Value 0.02374 0.04211
𝐵 [—]
ESD ±0.00061 ±0.01086
Value 0.02421 0.04396
𝐶 [—]
ESD ±0.00064 ±0.01011
Value 0.99911 0.99905
ESD ±0.00006 ±0.00040
𝑅2 0.993 0.975
4-channel voltage device
N2
NH 3
DC power supply
MFC
MFC
DC power supply
PC
Out In Light source
PCS fiber
Optical spectrometer
Ref. sensor Testing chamber
Figure 1: The experimental setup used in optical characterization of reaction of the tested optical fiber sections to ammonia/nitrogen gas of various concentrations.
purging within the each measuring cycle. The sensitivity (𝑆) and the limit of detection (LOD) were calculated from the concentration dependence of the optical absorbance. In the interval of low concentrations (0–750 ppm), the linear fits were plotted by using general equation 𝑦 = 𝐴 + 𝐵𝑥. In the full range of concentrations (0–4000 ppm), the exponential equation 𝑦 = 𝐴 − 𝐵𝐶𝐷𝑥 was used (with the scaling coefficient 𝐷 set to 1 ppm−1 ). Routines embedded in Origin 8.0 software were employed in the fitting. Parameters of the obtained calibration curves are summarized in Table 1. 2.4. Ammonia Detection Principle. The employed detection principle is based on the ligand exchange process running within the polysiloxane matrix, accompanied by changes of the VIS-NIR absorption spectrum. Preparation of the reagent can be symbolized as [11] 𝑛L + Co2+ + 2Br− ⇒ [𝑛L-Co]2+ + 2Br− .
(1)
Ammonia, as the stronger electron donor than L, replaces the latter in the metallic complex giving rise to a new [(NH3 )n Co]2+ complex ion. Such decomposition of the original chromatic complex results in the observed changes in optical absorption spectrum. A reversible chemical conversion between the metallic and the ammonium complex ion is desirable in order to prepare a correctly working sensing element. These reactions can be symbolized as [𝑛L-Co]2+ + 2Br− + 𝑛NH3 ⇐⇒ [(NH3 )𝑛 -Co]
2+
+ 2Br− + 𝑛L.
(2)
2.5. EPR Experiments. Possible presence of residual free radicals in cured PDMS material was tested by means of electron paramagnetic resonance (EPR). Two oblong specimens (0.15 × 3.5 × 7 mm3 ) were prepared from Dow Corning Sylgard 184 formulation by spinning at 600 rpm/30 sec on PTFE
4
Journal of Sensors
substrates and curing at 80∘ C and vacuum of 1 kPa for 15 h. One of the layers was then annealed at 200∘ C and vacuum of 1 kPa for 48 h. EPR spectra were recorded with Bruker ELEXSYS E580 EPR spectrometer at room temperature.
1.0 0.9 0.8
3. Results and Discussion The lipophilic organic ligand L with octyl sidechains was chosen in view of its optochemical properties. In solution, the ligand shows strong optical absorption bands in the interval 400–850 nm, with the principal maximum at 565–630 nm depending on polarity of the solvent. From the group of transition metals forming a complex compound with the selected ligand, bivalent cobalt ion was chosen. The corresponding complex was found to be feasible as ammoniasensitive reagent both in solution and when embedded in the polysiloxane fiber cladding. The problem which had to be overcome is the fundamentally limited solubility of cobalt salts in nonpolar solvents. Thus, the bivalent organometallic complex was prepared from the ligand solution miscible with cobalt bromide solution in ethanol or isopropyl alcohol. Bromide anion was selected for its relatively weak electron affinity. Creation of the organometallic complex ions was accompanied by red shift of the optical absorption spectrum of the solution, as a consequence of the widening of the electronic resonant systems [14]. Addition of ammonium hydroxide to solution of the complex reagent caused decomposition of the original organometallic ion after the reaction (2) demonstrated by blue shift of the absorption maximum back to the position corresponding to the free ligand (Figure 2). Surface of polysiloxane fiber cladding is generally hydrophobic. Change of this chemical compatibility was essential for incorporation of the moderately hydrophilic reagent into the fiber cladding. In a mixture of heptane and isopropyl alcohol, the fiber cladding intensively swelled. It was found that the diffusion of reagent molecules into the polymer cladding significantly speeds up with extend of the polymer swelling. Omission of the pretreatment preceding the reagent soaking resulted in remarkable and undesirable decrease in intensity of the corresponding absorption band of reagent. Using the described procedure, sensitization of the sample optical fibers by the complex reagent was successfully performed as proved by well-resolved absorption spectra (Figure 3).
0.6 0.5 0.4 0.3 0.2 0.1 0.0 450
500
550
600 650 700 750 Wavelength (nm)
800
850
900
nL in ethanol [nL-Co]Br2 [(NH3 )n -Co] + Br2 + nL
Figure 2: Absorption spectra indicating the reversible changes of absorption bands of [𝑛L-Co]Br2 in ethanol solution. 0.8 0.7 0.6 Absorbance
2.6. Computer Simulations of the Ligand Stability. Ab initio simulations utilizing the DFT method implemented in module DMol3 (Materials Studio, Accelrys Software Inc.) [12, 13] were employed to elucidate chemical stability of the ligand. B3LYP functional and DNP3.5 numeric basis set characterize the level of theory used. Methyl derivative of L, 5-(4 -dimethylamino phenylimino) quinoline-8-1 (further referred to as Me-L), was selected in order to reduce the computing time while maintaining the key features of the ligand structure. After geometrical optimization of structure, main indicators of chemical molecular stability were calculated (Fukui functions, electrostatic potential, charge density, and HOMO and LUMO location).
Absorbance
0.7
0.5
Δ𝜆
0.4 0.3 0.2 0.1 0.0 400
500
600
700
800
900
1000
Wavelength (nm) nL [nL-Co]Br2
Figure 3: Optical absorption spectra of PCS fiber with incorporated [𝑛L-Co]Br2 reagent. The spectral shift Δ𝜆 is indicated corresponding to transition between the complexed and isolated ligand state.
3.1. Long-Term Stability of Optical Properties. Under storage at ambient conditions, a slow decay of the optical absorption was observed for all tested fiber specimens. In order to analyze the possible chemical origin of the deterioration, EPR spectra (Figure 4) were at first recorded for the annealed (A) and nonannealed (N) PDMS samples. The spectrum recorded for sample N is characterized by the strong resonance line at the resonance magnetic field 1461 G with 𝑔-factor 𝑔 = 4.5954. In spectrum A, such the line could hardly be detected; however, it is very broad and spreads over the magnetic field region 66–5000 G, having the same 𝑔-factor as the resonance line mentioned above in the sample “N.” These two lines
Journal of Sensors
5 15 1.0 0.5 b 0.0 −0.5 −1.0 −1.5 −2.0 −2.5 2000
EPR intensity (a.u.)
10 5 0
Polysiloxane, T = 295 K, f = 9403 MHz
3000
4000
5000
b −5
a
−10 −15
1.2 0.9 0.6 0.3 0.0 −0.3
a
2500 0
2000
4000 Magnetic field (G)
3000 6000
3500
4000 8000
Sample “N” Sample “A”
Figure 4: EPR spectra of PDMS films measured at RT, magnetic field G parallel with the film surface. (a) The EPR line in the spectrum of the nonannealed sample “N.” (b) The EPR line in the spectrum of the annealed sample “A.”
(a)
(b)
Figure 5: Calculated radical Fukui function. (a) The Me-D5 ligand structure. (b) The radical Fukui function projected on the electron density surface (isovalue of 0.9). The places of high radical attack risk are marked by red color.
most probably originate from the free radicals found in the materials. Nevertheless, the spectra contain the unidentified weak resonance lines as well near 3263 G with the 𝑔-factor 2.0589 (shown in Figure 4 in upper and lower inset, resp.). The free radicals concentration was obtained by doubled integration of the experimental spectra. The double integral values are SN = 4.91 ⋅ 1011 and SA = 0.43 ⋅ 1011 cm−3 , for the N and A sample, respectively. In order to improve accuracy of the concentrations ratio determination, the SN and SA values must be corrected by subtraction of the contributions from the unknown lines, which are SN U = 0.159 ⋅ 1010 and SA U = 1.23 ⋅ 1010 cm−3 for N and A sample, respectively. The ratio of the free radicals concentrations is then (SN − SN U) /(SA − SA U) ≈ 16. Thus, sample prepared by the standard curing procedure (the nonannealed sample) contains significantly higher amount of free radical species than its annealed counterpart; the free radicals can be then responsible for deterioration of the conjugated system of ligand accompanied by changes in optical absorption.
The possible decomposition of the quinoline conjugated system is also suggested by the results of the calculated chemical stability indicators. According to the values of HOMO-LUMO gap amounting ca. 2.45 eV, the family of the tested quinoline derivatives can be considered as chemically soft and Fukui functions can be considered as primary stability indicators [15, 16]. The radical Fukui function shows several maxima corresponding to the weak points sensitive to a radical attack, with the most pronounced one located on the carbonyl oxygen atom (Figure 5). Suitable stabilization against radical attack should thus help to improve the long-term stability of the fibers. Unfortunately, the direct use of annealed fibers has been found as unfeasible: after annealing, the polymer swelling (necessary for the efficient reagent soaking) was radically reduced. So, we had to look for a suitable radical scavenger. Testosterone was chosen for its remarkable lipophilicity, compatible with the PDMS matrix. Figure 6 shows the long-term evolution of the optical absorbance observed for two fibers sensitized
6
Journal of Sensors Table 2: Parameters of the tested sensing fibers. The best obtained values are marked in bold. 𝑆 [ppm−1 ] 𝑆 = 1.27 ∗ 10−5 𝑆 = 1.12 ∗ 10−5 𝑆 = 2.00 ∗ 10−5 𝑆 = 2.40 ∗ 10−5 S = 1.52 ∗ 10−5 S = 3.00 ∗ 10−5 𝑆 = 2.00 ∗ 10−5 𝑆 = 2.97 ∗ 10−5
Channel
770 nm
810 nm
2
𝜎 𝜎2 𝜎2 𝜎2 𝜎2 𝜎2 𝜎2 𝜎2
1.1 1.0 Relative absorbance drop
0.9 0.8 0.7 0.6 0.5 0.4 0.3 0.2 0.1 0.0 0
20
40
60 80 100 Time evolution (days)
120
140
160
(a) With testosterone (T+) (b) Without testosterone (T−)
Figure 6: Long-term evolution of the optical absorption. The PDMS cladding stabilized (a) with testosterone and (b) without testosterone.
𝜎2 [—] = 0.000254 = 0.000358 = 0.000230 = 0.000480 = 0.000154 = 0.000350 = 0.000593 = 0.001083
LOD [ppm] LOD = 60 ppm LOD = 96 ppm LOD = 35 ppm LOD = 60 ppm LOD = 31 ppm LOD = 35 ppm LOD = 89 ppm LOD = 109 ppm
From the temporal courses such as those shown in Figure 7, the dependence of optical absorption on the analyte concentration can be obtained. Example of such course is shown in Figure 8, together with the linear and the exponential fit used to calculate the calibration curve in range of the low and the high concentration, respectively. The sensor characteristics obtained from the calibration curves for the PCS fibers under test are summarized in Table 2. The sensitivity 𝑆 is defined as the slope of the linear part of the calibration curve and reflects the change of absorbance measured at the indicated wavelength caused by 1 ppm change of ammonia gas concentration. Apparently, a slightly higher sensitivity (steeper calibration curve) is achieved in case of the absorbance reading performed on the 810 nm. In the latter case, the drop of the optical absorbance of the complex is less compensated by the rising red shoulder of absorption band of isolated ligands than in case of the 770 nm channel. The sensor operated reversibly for 15 cycles. LOD was calculated from the observed noise level and the calculated sensitivity values (𝜎2 , 𝑆, cf. Table 2) using the relation LOD =
in solution with (T+) and without (T−) testosterone added. It is apparent that presence of the radical scavenger in the cladding leads to the remarkable improvement of the longterm stability. 3.2. Sensitivity of Sample Fibers to Gaseous Ammonia. Sensitivity to ammonia exposition was determined from the difference of the tested fiber absorbance measured close to the maximum (770 nm, 810 nm) and on side (630 nm) of the absorption band of the embedded complex reagent (cf. Figure 3). The background absorbance was subtracted to eliminate influence of the ambient environment. After the analyte injections, the recorded absorbance value decreased (Figure 7) due to decomposition of the reagent complex ion following the forward reaction in (2). The average time response to ammonia injection of the tested fiber sensors was estimated as 25 s. When the purge with pure nitrogen is applied, the partial relaxation of the system occurs after approximately 5 minutes. This phenomenon is demonstrating itself by slight rise of absorbance (Figure 7). Full relaxation occurs within ca. one hour of purge.
3 ∗ 𝜎2 . 𝑆
(3)
The level of saturation concentration estimated from the calibration curves of the tested sensing fibers amounts to approximately 4000 ppm.
4. Conclusions Fiber-optic sensing elements for detection of gaseous ammonia based on absorption of evanescent waves by organometallic reagent were prepared and characterized. The reagent with improved compatibility to polysiloxane matrix was synthetized and immobilized by means of diffusion process into the fiber cladding. The resulting fibers showed strong absorption bands in VIS-NIR spectral region and a significant reactivity to ammonia gas demonstrating itself by wellresolved optical absorption changes. Long temporal stability of the optical and kinetic properties could be achieved by special free radical-suppressing treatment of the cladding polymer. The average limiting sensitivity and the limit of detection of the prepared sensors operating at low ammonia
0.100 0.095 0.090 0.085 0.080 0.075 0.070 0.065 0.060 0.055 0.050 0.045 0.040
7 0.085
NH3
Δ Absorbance
Δ Absorbance
Journal of Sensors
N2
0
2000
4000 6000 Time (s)
8000
10000
Channel (770–630 nm)
0.080
300 ppm
400 ppm
600 ppm
750 ppm
0.075 0.070
N2
0.065 0.060 1500
2000
N2
N2
2500 3000 Time (s)
N2 3500
4000
Channel (770–630 nm)
(a)
(b)
Δ Absorbance
Figure 7: Temporal evolution of the indicated absorbance function during the repeated analyte injections: (a) the full course, (b) the detail view. The recording spectral channels and applied ammonia concentrations are indicated.
0.026 0.024 0.022 0.020 0.018 0.016 0.014 0.012 0.010 0.008 0.006 0.004 0.002 0.000
Competing Interests The authors declare that they have no competing interests.
Acknowledgments
0
500
1000 1500 2000 2500 3000 3500 4000 NH 3 concentration (ppm)
Channel (770–630 nm)
Figure 8: Example of the calibration graph. The full points mark the measured values (experimental errors are indicated). The linear (dash line) and exponential (dot line) fit to the data is shown.
concentrations were determined as 1.52 ∗ 10−5 ppm−1 and 31 ppm, respectively. The average forward response time to ammonia injection of fiber sensor was 25 s. The partial system relaxation under nitrogen purge occurred after 5 minutes. The saturation ammonia level of the tested sensors was estimated as 4000 ppm. The results obtained on short fiber sections provide a promising base for further effort focused on construction of distributed sensing systems of ammonia gas based on NIR interrogation of a long fiber section by means of optical time domain reflectometry method [11]. The procedure of preparation of chemooptical transducer described here is compatible with usage of standard low loss PCS fibers and suits well for preparation of long (several hundred meters at east) sensing fibers. As shown in the results of our already performed theoretical analysis [11], the inevitable increase of transmission loss of the sensing fiber due to the sensitization with the complex reagent can be reduced and the fiber sensitivity is enhanced by creating an optimized noneven radial concentration profile of the reagent within the PCS fiber cladding. Substantial modification of the current sensitization procedure is however required in order to achieve such goal.
The research has been supported by the Czech Science Foundation Grant no. 14-36566G and by Grant SGS13/219/ OHK4/3T/14 of the Czech Technical University in Prague. Authors thank Maksym Buryi from Institute of Physics, AS CR, for kindly performing the EPR measurements.
References [1] B. Timmer, W. Olthuis, and A. van den Berg, “Ammonia sensors and their applications—a review,” Sensors and Actuators B: Chemical, vol. 107, no. 2, pp. 666–677, 2005. [2] M. Aslam, V. A. Chaudhary, I. S. Mulla et al., “Highly selective ammonia gas sensor using surface-ruthenated zinc oxide,” Sensors and Actuators A: Physical, vol. 75, no. 2, pp. 162–167, 1999. [3] B. Karunagaran, P. Uthirakumar, S. J. Chung, S. Velumani, and E.-K. Suh, “TiO2 thin film gas sensor for monitoring ammonia,” Materials Characterization, vol. 58, no. 8-9, pp. 680–684, 2007. [4] F. Winquist, A. Spetz, I. Lundstr¨om, and B. Danielsson, “Determination of ammonia in air and aqueous samples with a gassensitive semiconductor capacitor,” Analytica Chimica Acta, vol. 164, pp. 127–138, 1984. [5] H. Manap, G. Dooly, R. Muda, S. O’Keeffe, and E. Lewis, “Cross sensitivity study for ammonia detection in ultra violet region using an optical fibre sensor,” in Proceedings of the 3rd International Conference on Sensor Technologies and Applications (SENSORCOMM ’09), pp. 75–81, Athens, Greece, June 2009. [6] C. Malins, A. Doyle, B. D. MacCraith et al., “Personal ammonia sensor for industrial environments,” Journal of Environmental Monitoring, vol. 1, no. 5, pp. 417–422, 1999. ˇ [7] P. Simon, M. Landl, M. Breza, and F. Kvasnik, “New NIR dyes for ammonia sensing,” Sensors and Actuators B: Chemical, vol. 90, no. 1–3, pp. 9–14, 2003. ˇ [8] E. Scorsone, S. Christie, K. C. Persaud, P. Simon, and F. Kvasnik, “Fibre-optic evanescent sensing of gaseous ammonia with two forms of a new near-infrared dye in comparison to phenol red,” Sensors and Actuators B: Chemical, vol. 90, no. 1–3, pp. 37–45, 2003.
8 [9] L. Kalvoda, J. Aubrecht, and R. Klep´acˇek, “Fiber optic detection of ammonia gas,” Acta Polytechnica, vol. 46, no. 2, pp. 41–46, 2006. [10] Y. Kubo, K. Sasaki, H. Kataoka, and K. Yoshida, “Synthesis of novel near-infrared absorbing metal complex dyes with indoaniline-type ligands,” Journal of the Chemical Society, Perkin Transactions 1, vol. 1, pp. 1469–1472, 1989. [11] L. Kalvoda, J. Aubrecht, and P. Levinsky, “Development of distributed sensor of ammonia gas,” in Ammonia: Structure, Biosynthesis and Functions, V. A. Fekete and R. E. Molnar, Eds., pp. 33–60, Nova Science Publishers, New York, NY, USA, 2012. [12] B. Delley, “An all-electron numerical method for solving the local density functional for polyatomic molecules,” The Journal of Chemical Physics, vol. 92, no. 1, pp. 508–517, 1990. [13] B. Delley, “From molecules to solids with the DMol3 approach,” The Journal of Chemical Physics, vol. 113, no. 18, pp. 7756–7764, 2000. [14] J. Aubrecht and L. Kalvoda, “Development of absorption fiber optic sensor for distributed measurement of ammonia gas,” in Optical Sensors, vol. 8774 of Proceedings of SPIE, Prague, Czech Republic, May 2013. [15] J. S. M. Anderson, J. Melin, and P. W. Ayers, “Conceptual density-functional theory for general chemical reactions, including those that are neither charge- nor frontier-orbitalcontrolled. 1. Theory and derivation of a general-purpose reactivity indicator,” Journal of Chemical Theory and Computation, vol. 3, no. 2, pp. 358–374, 2007. [16] W. Yang and R. G. Parr, “Hardness, softness, and the Fukui function in the electronic theory of metals and catalysis,” Proceedings of the National Academy of Sciences of the United States of America, vol. 82, no. 20, pp. 6723–6726, 1985.
Journal of Sensors
International Journal of
Rotating Machinery
Engineering Journal of
Hindawi Publishing Corporation http://www.hindawi.com
Volume 2014
The Scientific World Journal Hindawi Publishing Corporation http://www.hindawi.com
Volume 2014
International Journal of
Distributed Sensor Networks
Journal of
Sensors Hindawi Publishing Corporation http://www.hindawi.com
Volume 2014
Hindawi Publishing Corporation http://www.hindawi.com
Volume 2014
Hindawi Publishing Corporation http://www.hindawi.com
Volume 2014
Journal of
Control Science and Engineering
Advances in
Civil Engineering Hindawi Publishing Corporation http://www.hindawi.com
Hindawi Publishing Corporation http://www.hindawi.com
Volume 2014
Volume 2014
Submit your manuscripts at http://www.hindawi.com Journal of
Journal of
Electrical and Computer Engineering
Robotics Hindawi Publishing Corporation http://www.hindawi.com
Hindawi Publishing Corporation http://www.hindawi.com
Volume 2014
Volume 2014
VLSI Design Advances in OptoElectronics
International Journal of
Navigation and Observation Hindawi Publishing Corporation http://www.hindawi.com
Volume 2014
Hindawi Publishing Corporation http://www.hindawi.com
Hindawi Publishing Corporation http://www.hindawi.com
Chemical Engineering Hindawi Publishing Corporation http://www.hindawi.com
Volume 2014
Volume 2014
Active and Passive Electronic Components
Antennas and Propagation Hindawi Publishing Corporation http://www.hindawi.com
Aerospace Engineering
Hindawi Publishing Corporation http://www.hindawi.com
Volume 2014
Hindawi Publishing Corporation http://www.hindawi.com
Volume 2014
Volume 2014
International Journal of
International Journal of
International Journal of
Modelling & Simulation in Engineering
Volume 2014
Hindawi Publishing Corporation http://www.hindawi.com
Volume 2014
Shock and Vibration Hindawi Publishing Corporation http://www.hindawi.com
Volume 2014
Advances in
Acoustics and Vibration Hindawi Publishing Corporation http://www.hindawi.com
Volume 2014