Jun 24, 2008 - Amplitude of electric field has a gaussian (bell-curve) probability density function (PDF). ⢠RFI is man-made. â PDFs will often be non-Gaussian.
2008 NASA Science Technology Conference University of Maryland Inn and Conference Center June 24, 2008
Development of an Agile Digital Detector for RFI Detection and Mitigation on Spaceborne Radiometers Chris Ruf, Steve Rogacki, Curt Cooper, Sid Misra, Steve Gross Space Physics Research Laboratory, University of Michigan Joel Johnson Dept. of Electrical Engineering, Ohio State University Jeff Piepmeier NASA Goddard Space Flight Center
Introduction •
RFI can cause significant errors in science data – L- and C-Band soil moisture measurements over land – L-, C- and X-band ocean measurements
•
High levels of RFI are relatively easy to detect – Mitigate using analog parallel subband filter approach
•
Low levels of RFI present more difficulty – Low integrated energy looks like science signal – High-power, short-duration � low integrated energy – Many sources (e.g. air-traffic control radars) match this profile
•
Digital signal processing approach – Based on statistical properties of natural emission vs. man-made interference
Ruf et al., ADD RFI, ESTC 2008
2
Project Objectives • Technical Objectives – Design, develop and field test candidate RFI mitigation detectors – Develop RFI mitigation algorithms and characterize their performance • Empirical field testing • Analytical performance models – Develop a space qualified candidate point design
• Technology Infusion – Integrate RFI mitigation detectors with established ground based and airborne microwave radiometers – Demonstrate capabilities to the science community
Ruf et al., ADD RFI, ESTC 2008
3
Progress of Technology Infusion • Spaceflight Opportunities – SMAP mission (recommended by NRC Earth Science Decadal Survey) has included the ADD subsystem in their baseline design – IPO NPOESS MIS radiometer design studies include versions of ADD in their trade space
• National Radio Astronomy Observatory – Frequency Agile Solar Radiotelesope (FASR) national facility includes ADD RFI detection and mitigation subsystem in its baseline design
Ruf et al., ADD RFI, ESTC 2008
4
Project Schedule • Year 1 (7/05-6/06) – Prototype RFI Detector development – Ground based & airborne campaigns
• Year 2 (7/06-6/07) – Campaign data analysis – Define space flight detector requirements
• Year 3 (7/07-6/08) – Advanced detection and mitigation algorithm development – Spaceflight detector brassboard development
• Follow On – Working with SMAP and MIS Programs
Ruf et al., ADD RFI, ESTC 2008
5
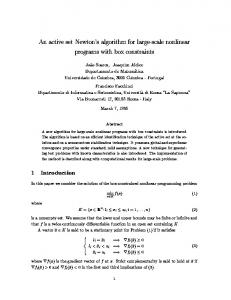
Theory of Operation • Desired radiometric (science) signals generated by thermal noise – Amplitude of electric field has a gaussian (bell-curve) probability density function (PDF)
• RFI is man-made – PDFs will often be non-Gaussian
• Exploiting this distinction is the basis of the Agile Digital Detector (ADD)
Ruf et al., ADD RFI, ESTC 2008
6
Thermal Noise Amplitude Probability Distribution
Thermal waveform
Gaussian PDF
Ruf et al., ADD RFI, ESTC 2008
Sinusoidal waveform
Non-Gaussian PDF
7
Outdoor Sky Cal with sinusoidal RFI 8 Subband Probability Density Functions
•
TB = 40 K plus ~260 K sine wave injected into subband 5
Ruf et al., ADD RFI, ESTC 2008
8
RFI Detection Using Higher Order Moments •
The kurtosis of a random variable, x, is defined as
< ( x � < x >) 4 > k= < ( x � < x >) 2 > 2 •
k=3 for a gaussian distributed r.v., independent of �x2 (i.e. k=3 for natural thermal noise, independent of brightness temperature)
•
The standard deviation of an estimate of k after a finite integration time is
24 �k = B� • •
For prototype radiometer operation (B=3 MHz & �=0.3 s), �k = 0.005 RFI Detection Flag if |k – 3| > 3�k
Ruf et al., ADD RFI, ESTC 2008
9
C-Band Field Deployment – with NOAA/ETL PSR •
Operated on WB-57 over Texas, 25 August 2005
Ruf et al., ADD RFI, ESTC 2008
10
Example of PSR Flight Data Kurtosis and 2nd Moment Spectra •
•
ch = 50-80 (~6 GHz), intermittent times – –
•
Kurtosis (left) and 2nd moment (below) 5.5-7.5 GHz spectra v. time over Dallas Metro area
Strong non-gaussian kurtosis Strong, correlated effect on TB
ch = 170-180 (~7.5 GHz), t = 0-60s – –
Strong non-gaussian kurtosis Not so noticeable effect on TB
Ruf et al., ADD RFI, ESTC 2008
11
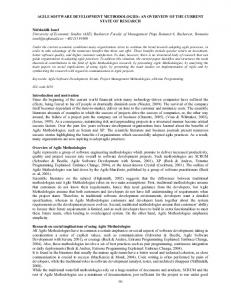
Radiometer Brightness Temperature and Kurtosis Images
Brightness Temperature Image
Kurtosis Image
• Overflight of Galveston, TX coastline – TB image (left) sensitive to both natural and artificial emission (artificial emission, coastline and islands all affect TB) – Kurtosis image (right) only sensitive to artificial emission Ruf et al., ADD RFI, ESTC 2008
12
Kurtosis Algorithm Detection Concepts
FAR
PD Rth,a Ruf et al., ADD RFI, ESTC 2008
13
False Alarm Rate and Probability of Detection of Pulsed Sinusoidal RFI •
• •
For RFI power level at brightness temperature equivalent to 2NE�T, detection threshold can be set to give: – 90% probability of detection – 3% false alarm rate 0.1% duty cycle case corresponds to ARSR-1 operating mode Higher duty cycle reduces detection
TPS = 2.2 NE�T
Ruf et al., ADD RFI, ESTC 2008
TPS = 0.55 NE�T
TPS = 0.14 NE�T
d = 0.1%
14
False Alarm Rate and Probability of Detection of Pulsed Sinusoidal RFI
•
Plot comparing the ROC area for the kurtosis algorithm under various data rates schemes and subbands with the matched peak detection algorithm (blue *) (RFI power = 0.5NEDT) Ruf et al., ADD RFI, ESTC 2008
15
Development of ADD Flight Brassboard
Ruf et al., ADD RFI, ESTC 2008
16
ADD Brassboard Requirements • Two Channel, V and H polarization • Input (from RF front end) – 1401.75 to 1425.75 MHz band limited (24MHz BW) – (-10 dBm) signal amplitude
• Use ADC to – downconvert the RF input – Sample at Nyquist rate for subsequent digital filters
• Signal Processing – 1st, 2nd, 3rd, and 4th moments for V and H (full BW) and each of 16 subbands – 16 equally spaced subband filters (24MHz/16 = 1.5MHz each) – Complex correlation of full BW and each of 16 subbands: • Real + • Imag - Ruf et al., ADD RFI, ESTC 2008
17
ADD Brassboard Objectives •
Purpose – Test and characterize ADC and FPGA digital signal processing. • System SNR, with analog radiometer data as benchmark • Power requirements • Mass and physical configuration estimates. – Establish requirements • ADC clock rate • ADC clock jitter specification • Power regulation and noise limits, for ADC in particular.
•
Design – Brassboard parts to be functionally equivalent to space qualified parts. – Circuit board layout is critical at high frequency. Successful layout to be duplicated in flight design.
Ruf et al., ADD RFI, ESTC 2008
18
Brassboard Block Diagram
Ruf et al., ADD RFI, ESTC 2008
19
Conclusions • • • • • •
Direct measurement of higher order moments (1st, 2nd, 3rd and 4th) can be used to reliably detect non-gaussian RFI The signal kurtosis is a very robust statistic on which to base a detection algorithm Digital subbanding allows RFI to be removed Experimental verification demonstrates performance in a relevant science application environment In design trade space for two pending spaceborne radiometer programs Flight brassboard testing planned for Summer 2008
Ruf et al., ADD RFI, ESTC 2008
20