Procedia Manufacturing Volume 1, 2015, Pages 27–34 43rd Proceedings of the North American Manufacturing Research Institution of SME http://www.sme.org/namrc
Development of an Inspection System for Micro Level Void Detection Hong-Seok Park1 † Upendra M. Tuladhar2‡ and Chintal Shah2 1
University of Ulsan, Ulsan, Republic of Korea University of Ulsan, Ulsan, Republic of Korea
[email protected],
[email protected],
[email protected] 2
Abstract In this paper we discussed a method to carry out a roughness inspection on the surface of fuel injection nozzle of ship engines. The nozzles are manufactured using hot isostatic pressing (HIP) technology. Microscopic blowholes are likely to be created during the process of manufacturing the nozzles, which causes the roughness on the surface even after fine machining. The objective of this research is to develop a technique to detect these microscopic blowholes. Digital image processing and a computational system are used to measure the roughness level. Length and breadth of the blowhole is measured using edge detection technique associated with a Gaussian filter and then edge drawing algorithm is used to draw fine edges along the detected edges. Based on the difference of intensity gradient along x-and y-direction, the edges of the blowholes are drawn. These detected edges are used to measure the size of blowhole. Keywords: Hot Isostatic Pressing (HIP), Edge Drawing (ED), threshold, anchors, contour
1 Introduction Hot Isostatic Pressing (HIP) is a unique combination of high pressure and high temperature which makes it possible to produce materials and parts with substantially improved properties. The low sintering temperatures and the high isostatic pressure give better control of grain growth as well as isotropic properties resulting in superior performance characteristics. The HIP process heals internal cracks and porosity in sintered and cast parts. This improves the mechanical properties and reduces the scatter allowing greater freedom of design. That is why this process is adopted in the manufacturing process of nozzles for ship engines which requires high level of smoothness on the surface. As * †
Corresponding Author: First Author:
Tel.: +82-52-259-2294
2351-9789 © 2015 Published by Elsevier B.V. This is an open access article under the CC BY-NC-ND license (http://creativecommons.org/licenses/by-nc-nd/4.0/). Peer-review under responsibility of the NAMRI Scientific Committee doi:10.1016/j.promfg.2015.09.028
Development of an Inspection System for Micro Level Roughness Detection
Park et al.
mentioned HIP is used for elimination of closed porosities in castings or sintered parts, there are still some defects at micro level which cannot be neglected. Therefore a close and careful inspection is necessary to be carried out to assure the quality of the product. Currently, the inspection task is carried out manually by visual inspection using optical microscope which requires highly experienced manpower to carry out the task effectively. This research focuses on developing an automated inspection system which is capable of detecting defects, measure the dimensions of defects and make a decision whether the sample is good or bad. For this purpose we propose to use image processing technology for processing the data obtained from microscope. The sample is thoroughly scanned under high resolution microscope where it is possible to visualize microscopic roughness present on the surface. The roughness present on the surface can be characterized with edges. So in this paper we have presented edge segment detection technique with edge drawing algorithm. The edge segment detected is then analyzed to find the dimension, lengthwise and breadthwise to determine the quality of workpiece.
2 Literature Review Edge detection is one of the essential steps in most of the image processing methods. Hence, it constitutes a very crowded set of studies in the image processing literature [1-3]. Many studies for evaluating the efficiency of edge detection technique have been carried out whereas some studies focus on improvement of the perceptual structure of produced edge maps by several post-processing techniques [4-10]. These methods take a binary edge map as input and try to improve the edge quality by performing rule-based techniques with pixel-wise templates. In these studies the smooth, contiguous, thin and well-localized edges are qualified as the high quality edges in these studies. Thus, they track and test the edge structures with the templates and try to link possible discontinuities [5]. Although these methods help optimize the modal characteristics of the edges with morphological operations, they cannot provide a certain solution to having a high-quality edge map. There is also a substantial demand for detecting the edges in segment fashion. After an edge segment (edgel) is obtained, it can be chain-coded with the relative position vectors in between the consecutive edgels. Thus significant information about the geometric structure and orientation of the segment can be derived by analyzing the distribution and moments of the chain code. To obtain the edge segments using the methods as mentioned, the binary edge map should be obtained initially, and then a connected component analysis should be applied on the edge image. Such analysis typically results in segments with ragged, discontinuous and multi-pixel wide edges [7]. This is because the conventional edge detectors evaluate pixels in an isolated manner without considering the edge status of neighboring pixels and they generate edge maps consisting of discontinuous and unattended pixels. On the contrary, Edge Drawing (ED) is a novel detector that obtains one-pixel wide, smooth and contiguous edges in real-time. It works by computing a set of points most likely to lie on an edge, called anchors, and linking them by a set of predefined rules which we call smart routing. In other words, ED draws the edges by using the information derived from the image; whereas, conventional methods obtain the edges by filtering and eroding the image elements. The inspiration for the method name comes from the smart routing operation, i.e., drawing the edges between the anchor points just like a human would do. Obtaining edges in high level qualifications is not the only competence of ED, but also getting the edge map in vectorial fashion, i.e., array of segments instead of a 2D binary edge image. By its highlevel cognitive reasoning algorithm, ED behaves as if it has a perceptual distinguishing ability just like humans. Thus, it can detect edge segments as separated pixel chains even if those chains are connected in a complex structure, i.e. having multiple branches.
28
Development of an Inspection System for Micro Level Roughness Detection
Park et al.
In the rest of the paper, system architecture of the inspection system is given in section 3, followed by an overview of the ED algorithm in Section 4, Segmentation results are given in Section 5, and the paper is concluded in Section 6.
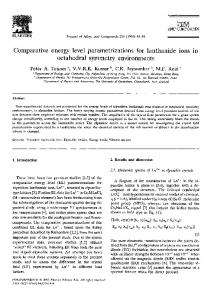
3 Schematic Procedure As shown in the figure 1, the inspection task is carried out by scanning the work piece surface for roughness search. Roughness is characterized by the edges, so the edges present on the surface are searched. On the detection of edges, the dimensions are measured for the detected edges. This way, a two dimensional measurement of roughness can be carried out. If the measured edges are within the threshold value the scan is continued whereas if the measurement exceeds the threshold value, intensity level of the detected edges is checked. The nozzle surface also contains some carbon deposits apart from roughness. Carbon deposits can be characterized by dark spots with comparatively low intensity. Therefore, the greyscale value of the spot can be measured and carbon deposits can be differentiated from the real roughness. For this purpose intensity level of the detected spots are measured and if the intensity value is above the threshold value the spots can be recognized as roughness else the spot can be carbon deposit. To make sure that the detected spot is carbon deposit the scan is stopped and z-axis scan is carried out with the help of 3D profilometer of the microscopic scanner and the 3D surface can be generated and it can be ensured whether the detected spot is actual roughness or just a carbon deposit. After the 3D profile is generated the z-direction value is analyzed. If the detected spot is ensured to be a carbon deposit the scan is continued else the work piece is scrapped. The process is carried out until the entire scan is completed.
Figure 1: System architecture of defect detection system for ship engine nozzles
29
Development of an Inspection System for Micro Level Roughness Detection
Park et al.
4 Overview of Edge Drawing Algorithm Edge drawing algorithm mainly constitutes of four major steps:
Figure 2: Construction of gradient magnitude and edge direction map
1. 2. 3. 4.
Noise reduction with Gaussian filtering, Determination of edge areas and edge direction map construction, Extraction of anchor points Linking anchor points with smart routing
4.1 Noise Reduction The very first step of ED is similar to most of the image processing methods. We simply convolve the image with a Gaussian kernel to reduce the effect of noise.
4.2 Finding the Edge Areas and Direction Map After smoothing, the first order horizontal and vertical derivatives of the image are computed to determine the edge areas and the edge direction map. Edge areas can be defined as the regions where the pixels have a gradient magnitude greater than a certain threshold. Although the Sobel operator [1] serves well in this task, one-dimensional simpler kernels can also be used for the sake of performance. Because the major efficiency of ED comes with the edge drawing procedure, various gradient operators, e.g., Prewitt, Scharr, etc., would also work fine. The horizontal and vertical gradients (Gx and Gy) are first obtained for each pixel by the derivative operator. Next, a gradient magnitude image is obtained by simply adding G x and Gy , i.e., G = |Gx| + |Gy|. Finally, a threshold is applied to determine if a pixel lies on an edge area. In figure 3 (b) gradient magnitude image of the original image of roughness (a) on the nozzle surface is shown. Simultaneously with the gradient image computation, edge direction map is also constructed in order to route the linking process of anchor points at the last step. The direction map is constructed in the same size with the image by comparing the |Gx| and |Gy| values. The edge passing through the pixel is assumed to be horizontal if |Gx | < |Gy|, vertical otherwise. Direction information is not computed for pixels whose gradient magnitudes are smaller than the threshold. The block diagram shows the first two steps of the ED algorithm in figure 2.
4.3 Extraction of Anchor Points The next step is the extraction of some points which must be lying on an edge with a high probability, called anchors. Anchors can be defined as local maxima points of the gradient magnitude image and are selected by scanning the image in horizontal and vertical directions. The density of the anchors can be tuned on demand. For instance, if only the detection of the major edges is desired, anchors can be extracted sparsely. If a lot of detail is required, anchors can be 30
Development of an Inspection System for Micro Level Roughness Detection
Park et al.
extracted more densely. Figure 3 (c) shows anchors extracted from the image with microscopic roughness.
(a)
(b)
(c) Figure 3: (a) Original image of microlevel roughness on nozzle surface, (b) gradient magnitude image, (c) anchors extracted from gradient magnitude image
4.4 Linking of Extraction points by Edge Drawing In the last step of ED, anchors are linked together with the help of the gradient magnitude image and direction map with a smart routing algorithm. The gradient magnitude image is raster scanned for the anchor points and the first encountered one is picked up. Then the edge direction of the selected anchor point is checked from the direction map. According to the edge direction, horizontal or vertical routing is performed over the gradient 31
Development of an Inspection System for Micro Level Roughness Detection
Park et al.
magnitude image. During routing, neighboring pixels in the linking direction are checked, and the one having the greatest gradient magnitude is selected as the next hop. The routing continues until we hit the boundary of the thresholded gradient magnitude image or a previously computed edge segment is encountered. Thus obtaining one-pixel wide, contiguous and smooth edges is guaranteed. Localization is another important edge quality metric for edges and it is also provided by selecting the pixel which has the maximum response to the gradient operator. Figure 4 shows the edge results of the edge drawing on the roughness captured on the surface of the nozzle.
Figure 4: Anchor points linked using gradient magnitude image
5 Rough Area Segmentation The algorithm discussed in the previous section yields numerous fine edge segments which are in vectorial fashion. These edge segments having the vectorial behavior can be used to detect the contours connecting each of these edge segments. In this piece of work our research focused on using of edges obtained from above discussed algorithm to construct an exterior contour that includes all the edge segments scattered close to each other. Later these enclosing contours can be used for measuring the dimension of the rough spot. Region based segmentation was implemented in the result obtained from the Edge Drawing algorithm to draw an external contour of the rough area. In order to get external contour the edge result obtained from ED algorithm was firstly smoothened using Gaussian filter to suppress noise. Then region based segmentation was applied. Figure 5 (a) shows a section of the result obtained from ED algorithm in figure 4. Then using this section we calculated the external contour. Figure 5 (b) shows the contour curve obtained from the region based segmentation. Figure 5 (c) is the segmented area within the contour curve. The segmented region obtained is then used to measure the maximum length and the width. The measurement information then is used to compare with the threshold value for which rule based algorithm based on the experience of the quality inspector is implemented. If the roughness area is above the threshold value, the developed system warns the inspector by highlighting the contour curve with specific color.
32
Development of an Inspection System for Micro Level Roughness Detection
(a)
Park et al.
(b)
(c) Figure 5: (a) Edges obtained from edge draw-ing algorithm, (b) contour curve enclosing the area of roughnes, (c) region based segment
6 Conclusion In this paper a design of a microscope inspection system capable of self-decision making has been discussed. The image processing module is capable of measuring the dimension of the roughness at microscopic level and display the decision according to the rule based algorithm designed for deciding whether the work piece is good or bad. The level of roughness to be detected in this work is approximately 5 micrometer which requires highly experienced manpower if done manually. In this paper we tried to solve the problem of automatic detection of roughness present on the nozzle surface based on edge detection technique. As the roughness present on the surface are scattered we obtain segments of edges which increases the difficulty in measuring the size of roughness. To ease our task of segmentation we smoothened the obtained edges and then region based segmentation was implemented which could easily differentiate rough area from the rest of the surface. Apart from the roughness the nozzle surface also contain the carbon deposits on the surface which makes the inspection task more challenging. The task to differentiate between the blowhole and the actual roughness needs very highly experienced manpower. This research focuses on collecting the rules based on the experience of the inspector and designing an algorithm not only to measure the roughness dimension but also to develop a system capable of differentiating between carbon deposit and actual roughness. The number of the blow holes presented on the surface is also one of the inspection criteria. If the number of the blowholes below 5 micrometer are scattered all over the surface in high amount, the work piece will be rejected as well. Based on all these rules we have
33
Development of an Inspection System for Micro Level Roughness Detection
Park et al.
designed an algorithm capable of detecting the defect on the nozzle surface without a highly experienced manpower. Contrary to the existing off-line inspection system, the developed nozzle inspection system places more weight on inter-process inspection system in the in-line inspection process and active detection and treatment of process problems which may be occurred in the manufacturing process.
7 Acknowledgement This work was supported by Business for Cooperative R&D between Industry, Academy, and Research Institute funded Korea Small and Medium Business Administration in 2013.
References Sobel E. Camera Models and Machine Perception. PhD thesis 1970; Stanford Univ. Nalwa VS and Binford TO. On Detecting Edges. In: IEEE Trans. Pattern Anal. Machine Intelligent, 1986; (PAMI), 8(6), pp.669-714. Canny J. A Computational Approach to Edge Detection. In: IEEE Trans. Pattern Anal. Machine Intelligent, 1986; (PAMI), 8(6), pp.639-643. Hajjar A and Chen T. A VLSI Architecture for Real-Time Edge Linking. In: IEEE Trans. Pattern Anal. Mac. Intell., 1999; (PAMI), 1(21), pp.89-94. Wang Z and Zhang H. Edge Linking Using Geodesic Distance and Neighborhood Information. In: IEEE/ASME Int’l Conf. Advanced Intelligent Mechatronics (AIM), 2008; pp. 151-155. Wong YP, Soh VC-M, Ban KW and Bau YT. Improved Canny Edges Using Ant Colony Optimization. In: Int’l Conf. Computer Graphics, Imaging and Visualisation (CGIV), 2008; pp.197-202. Jevtic A, Melgar I and Andina D. Ant based edge linking algorithm. In: IEEE Int’l Conf. Industrial Electronics (IECON), 2009; pp. 3353-3358. Rahebi J, Elmi Z, Farzamnia A, and Shayan K. Digital image edge detection using an ant colony optimization based on genetic algorithm. In: IEEE Int’l Conf. Cybernetics and Intelligent Systems (CIS), 2010; pp.145-149. Lin Q, Han Y and Hahn H. Real-Time Lane Departure Detection Based on Extended Edge-Linking Algorithm. In: Int’l Conf. Computer Research and Development, 2010; pp.725-730. Topal C, Akınlar C and Genç Y. Edge Drawing: A Heuristic Approach to Robust Real-Time Edge Detection. In: Proc. of Int. Conference on Pattern Recognition (ICPR), 2010; pp.2424-2427.
34