Atmos. Meas. Tech., 9, 2093–2101, 2016 www.atmos-meas-tech.net/9/2093/2016/ doi:10.5194/amt-9-2093-2016 © Author(s) 2016. CC Attribution 3.0 License.
Development of automated preparation system for isotopocule analysis of N2O in various air samples Sakae Toyoda1 and Naohiro Yoshida1,2,3 1 Department
of Environmental Science and Technology, Tokyo Institute of Technology, Yokohama, 226-8502, Japan of Environmental Chemistry and Engineering, Tokyo Institute of Technology, Yokohama, 226-8502, Japan 3 Earth-Life Science Institute, Tokyo Institute of Technology, Tokyo, 152-8550, Japan 2 Department
Correspondence to: Sakae Toyoda (
[email protected]) Received: 18 January 2016 – Published in Atmos. Meas. Tech. Discuss.: 8 February 2016 Revised: 5 April 2016 – Accepted: 30 April 2016 – Published: 11 May 2016
Abstract. Nitrous oxide (N2 O), an increasingly abundant greenhouse gas in the atmosphere, is the most important stratospheric ozone-depleting gas of this century. Natural abundance ratios of isotopocules of N2 O, NNO molecules substituted with stable isotopes of nitrogen and oxygen, are a promising index of various sources or production pathways of N2 O and of its sink or decomposition pathways. Several automated methods have been reported to improve the analytical precision for the isotopocule ratio of atmospheric N2 O and to reduce the labor necessary for complicated sample preparation procedures related to mass spectrometric analysis. However, no method accommodates flask samples with limited volume or pressure. Here we present an automated preconcentration system which offers flexibility with respect to the available gas volume, pressure, and N2 O concentration. The shortest processing time for a single analysis of typical atmospheric sample is 40 min. Precision values of isotopocule ratio analysis are < 0.1 ‰ for δ 15 Nbulk (average abundances of 14 N15 N16 O and 15 N14 N16 O relative to 14 N14 N16 O), < 0.2 ‰ for δ 18 O (relative abundance of 14 N14 N18 O), and < 0.5 ‰ for site preference (SP; difference between relative abundance of 14 N15 N16 O and 15 N14 N16 O). This precision is comparable to that of other automated systems, but better than that of our previously reported manual measurement system.
1
Introduction
Long-term monitoring of trace gases that are increasingly abundant in the atmosphere is fundamental for the analysis of the imbalance of their sources and sinks and for the prediction of future environmental change on Earth. Nitrous oxide (N2 O) is one such trace gas, with global warming potential that is 220 times as great as that of carbon dioxide (CO2 ), and is the most important stratospheric ozone-depleting gas of this century (Myhre et al., 2013; Ravishankara et al., 2009). Its globally averaged concentration, given as a mole fraction, was about 324 nmol mol−1 (10−9 moles per mole of dry air) in 2011 (Hartmann et al., 2013) and increases by 0.73 nmol mol−1 a−1 (Ciais et al., 2013). Sources of N2 O include natural and agricultural soils, aqueous environments such as oceans, rivers, and lakes, industrial processes such as fossil fuel combustion, biomass burning, and animal and human wastes (Ciais et al., 2013); its major sink is photochemical decomposition in the stratosphere. Although concentration analyses yield quantitative information related to trace gases straightforwardly, it is often difficult to differentiate the sources contributing to the increase of such gases in the atmosphere, especially for N2 O. Natural abundance ratios of stable isotopes of the elements that compose trace gas molecules have qualitative information related to the origin and production–decomposition processes of the gases because isotope ratios are generally different among different substrates. Moreover, they can change during physical, chemical, and biological processes. Regarding N2 O, measurements of the nitrogen isotope ratio (15 N /14 N) for the atmosphere and various sources since the 1980s have
Published by Copernicus Publications on behalf of the European Geosciences Union.
2094
S. Toyoda and N. Yoshida: Development of automated preparation system for isotopocule analysis of N2 O
revealed that the imbalance of isotopically light N2 O from surface sources and isotopically heavy N2 O refluxed from the stratosphere after its partial decomposition causes a progressive decrease in the 15 N /14 N isotope ratio of tropospheric N2 O (Ishijima et al., 2007; Röckmann et al., 2003a; Sowers et al., 2002). Furthermore, a technique developed for measuring isotopomers of N2 O (14 N15 N16 O and 15 N14 N16 O) expanded conventional isotopic analysis to isotopocule analysis by which ratios of NNO molecules substituted with stable isotopes of nitrogen or oxygen at any site relative to 14 N14 N16 O are obtained and by which production and decomposition pathways can be differentiated in greater detail (Toyoda et al., 2015 and references therein). Compared to concentration analysis, stable isotope and isotopocule analyses require (1) larger sample amounts, (2) more time and labor to extract and purify the target compound from the sample, and (3) larger and more expensive apparatus. Although recently developed tunable diode laser absorption spectroscopy (TDLAS) relaxes some of the requirements above, and although it has some potential for onsite monitoring of stable isotope / isotopocule ratios of trace gases (Harris et al., 2014; Mohn et al., 2012; Tuzson et al., 2008), mass spectrometry combined with flask sampling still holds advantages for high-precision isotopic monitoring at polar regions or remote areas and flight observation using a balloon or an airplane because of smaller sample volume requirements. In most currently used mass spectrometric analytical methods for N2 O isotopocules, air samples are first passed through chemical adsorbents to remove CO2 and water vapor. Then, N2 O is concentrated on chemically inert adsorbents or inner walls of narrow tubes at liquid nitrogen temperatures. It is further purified on a capillary column of a gas chromatograph (GC) and is introduced directly into an isotope ratio monitoring mass spectrometer (IRMS). The analysis of a single sample takes 30–60 min. The precision reported in earlier studies is typically 0.1–0.5 ‰ for 1 nmol of N2 O (e.g., Toyoda et al., 2001) (See Sect. 2.4 for notation of isotopocule ratios), which is worse than the ultimate precision expected from the shot-noise limit of the IRMS (Potter et al., 2013) and which is insufficient to resolve the secular trend of atmospheric N2 O isotopocule ratios. This low precision is partly caused by incomplete separation of interfering components such as CO2 and fluorinated hydrocarbons, or by imprecise manual handling during sample preparation. To improve the precision of the isotopocule ratio analysis of atmospheric N2 O and to reduce the labor for complicated sample preparation procedures for mass spectrometric analysis, several automated methods have been reported. Röckmann et al. (2003b) improved the precision of fragment ion (NO+ ) analysis by modifying the gas chromatographic purification of N2 O from interfering species such as halocarbons and less volatile compounds (Röckmann et al., 2003b). Röckmann and Levin (2005) and Potter et al. (2013) reported further improvement in the precision by partially or fully auAtmos. Meas. Tech., 9, 2093–2101, 2016
tomating sample preparation steps and by slightly increasing the sample size. In addition to the mass spectrometric method, an automated sample preparation system has been reported, which can be coupled to a quantum cascade laser absorption spectrometer (QCLAS) for the monitoring of atmospheric isotopocules of N2 O (Harris et al., 2014; Mohn et al., 2010). However, previously reported automated methods entail several shortcomings. For example, they are designed to measure pressurized air samples such as ambient air drawn by pumps or air collected into glass bottles or metal cylinders using pumps. For that reason, they are not applicable to samples at ambient or subambient pressure. Here we present an automated preconcentration system that offers enhanced flexibility in terms of sample gas pressure and N2 O concentration. The novel system encloses a vacuum line and a computer program that controls valves to inject samples of a designated amount. 2
Preparation system
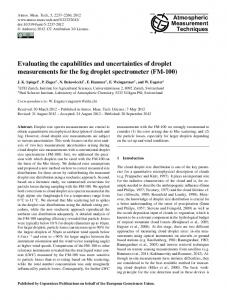
The preparation system developed in this study consists of a sample injection unit, cryogenic concentration unit, purification unit, and cryofocusing unit (Fig. 1). It is placed in a steel rack (60 cm width, 80 cm depth, 150 cm height) with wheels attached, and is connected to a gas chromatograph–isotope ratio monitoring mass spectrometer (GC-IRMS). Details of each unit are presented below. 2.1
Sample injection unit
This unit consists of a multi-position six-port switching valve (E4SD6MWE; Valco Instruments Co. Inc., Houston, TX, SV1 in Fig. 1) equipped with an electric actuator, air-actuated diaphragm shut-off valves (FPR-ND-71-6.35-2; Fujikin, Osaka, Japan, V1−V5 in Fig. 1), a pressure gauge (VSHT21; Valcom Co. Ltd., Toyonaka, Japan, PG1 in Fig. 1), a capacitance manometer (Barocel Model 600; BOC Edwards, Wilmington, MA, PG2 in Fig. 1), a Pirani vacuum gauge (GP2A; ULVAC, Inc., Chigasaki, Japan, VG in Fig. 1), a vacuum pump system (turbo drag pump TMH 071 P and diaphragm pump MVP 015-2 with a controller; Pfeiffer Vacuum GmbH, Asslar, Germany, VP in Fig. 1), three custom-made glass bottles, and stainless steel (ss) tubing. A sample flask (made of either glass or ss) or a gas cylinder is manually connected to one of the switching valve ports with an ss connector (Cajon Ultra-Torr or Swagelok; Swagelok Company, Solon, OH). The tubing between the diaphragm valve (V1, V2, or V3) and the flask/cylinder valve is evacuated by manually operating the valves and vacuum pump via control software (see below). Then, all the diaphragm valves are closed, the flask valve is opened by hand, and a computer program for sample preparation (see Sect. 2.5) is started.
www.atmos-meas-tech.net/9/2093/2016/
S. Toyoda and N. Yoshida: Development of automated preparation system for isotopocule analysis of N2 O
2095
Sample V3
V2
5
4
6
SV1
Standard
A~11.5
3 2
1
VG V8
PG2 V6
PG1
D=126.70
V10
B=27.53
V4
VP
PC
V1
V11 V9
V7
V5
He
He Vent OS
FM
TCD 6
5 4
3
PC
2
6
SV2
MFC
Vent
3
4
1 2
6
GC2
SV3 5
3
4
T1
TCD
P He
V15
1
5
2
T2
P
Vent GC1
1
SV4
CT
He
NV
Dryer Ref N2O
V13 E=483.09
Sample IRMS
V14
V12
C=73.30
LN2
He
LN1
Load (A) Inject (B)
Figure 1. Schematic portraying the sample preparation system developed in this study: CT, chemical trap; FM, flow monitor; GC, gas chromatograph; IRMS, isotope ratio mass spectrometer; LN, liquid nitrogen; MFC, mass flow controller; NV, needle valve; OS, open split interface; P, pressure regulator; PC, purification column; PG, pressure gauge; SV, electrically actuated switching valve; T, trap; V, air-actuated diaphragm valve; VG, vacuum gauge; VP, vacuum pump. A–E denote parts of the vacuum line or glass bottles that are used to expand the sample, the volume (cm3 ) of which is also shown.
First, sample gas pressure in the flask is measured using the pressure gauge by expanding the sample gas into the vacuum line until V4. Based on the pressure and the volume of the flask and the sample size to be injected, the “sample expanding option” and final pressure of the sample injected into the vacuum line is calculated. Seven options exist for sample expansion into the calibrated volume in the vacuum line from 100 cm3 (option no. 1) to 510 cm3 (option no. 7). This expansion is realized by a combination of the three glass bottles (C, D, and E in Fig. 1) with different volumes. Next, an aliquot of the sample in the flask is expanded by sequential open–close operation of diaphragm valves. The pressure is monitored using the manometer. When the pressure agrees with the precalculated value within ±5 %, either V1 or V3 (when sample is analyzed, Fig. 1) or V2 (when standard gas is analyzed) and V4 are closed, the pressure is recorded, and the injected sample amount is calculated. 2.2
Concentration unit
This unit consists of a chemical trap (CT in Fig. 1), an electrically actuated two-position six-port switching valve (E4C6UWE; Valco Instruments Co. Inc., Houston, TX, SV2 in Fig. 1), a U-shaped concentration trap (T1 in Fig. 1), and a mass flow controller (SEC-E40; Horiba Stec Co. Ltd., Kyoto, Japan, MFC in Fig. 1). The chemical trap is a glass tube (9 mm outer diameter (o.d.), 20 cm long) packed with Mg(ClO4 )2 (8–24 mesh; Wako Pure Chemical Industries www.atmos-meas-tech.net/9/2093/2016/
Ltd., Osaka, Japan), NaOH on support (Ascarite, 20–30 mesh; Thomas Scientific), and Mg(ClO4 )2 (20–48 mesh) in series with approximately equal length. The T1 is an ss tube (1/4 inch o.d., 30 cm long) packed with glass beads (Flusin GH 60–80 mesh; GL Sciences Inc., Tokyo, Japan). First, the concentration trap is purged with ultra-pure He (> 99.9999 %, Japan Air Gases Ltd., Tokyo, Japan) at 100 cm3 min−1 for > 10 s by switching SV2 to the “inject” position. The He is purified in advance through a column packed with molecular sieves 5A, active charcoal, and molecular sieves 13X in series (PC in Fig. 1). Next, SV2 is switched to the “load” position and the trap is cooled with liquid nitrogen in an ss dewar which is driven up and down by a custom-made air-actuated stage and which is filled with liquid nitrogen from an automatic liquid nitrogen supply system (Koshin Ltd., Tokyo, Japan). Then V5, V15, and valves relevant to the sample injection option (V9–V14) are opened. The sample gas in the calibrated volume is transferred to the concentration trap through the chemical trap by He carrier gas at 30 cm3 min−1 . The He is purified in a similar manner to that described above. When more than two glass bottles are filled with the sample gas, the transfer is conducted sequentially. The transfer time is set so that the total volume of He which flows through the bottle is twice the bottle volume.
Atmos. Meas. Tech., 9, 2093–2101, 2016
2096
S. Toyoda and N. Yoshida: Development of automated preparation system for isotopocule analysis of N2 O
2.3
δ 18 O=18 Rsample /18 Rstandard − 1
Purification and cryofocusing unit
15
This unit consists of two electrically actuated two-position six-port switching valves (SV3 and SV4 in Fig. 1, E4C6UWE; Valco Instruments Co. Inc., Houston, TX), a gas chromatograph (GC-8AIT; Shimadzu Corp., Kyoto, Japan. GC1 in Fig. 1) equipped with a thermal conductivity detector (TCD), and a U-shaped cryofocusing trap (T2 in Fig. 1). The GC column is an ss tube (4 mm o.d., 3 m length) packed with Porapak Q (80–100 mesh; Waters Corp., MA). It is kept at 60 ◦ C. The cryofocusing trap is an ss tube (1/16 inch o.d., 70 cm long) with no packing material. Initially, SV3 and SV4 are set to the load position. After the sample concentration step is completed, SV2 is switched to the inject position. The concentration trap is heated to 70 ◦ C by lowering the liquid nitrogen dewar and turning on a sheathed electric heater attached to the trap. The concentrated trace gases are transferred to the GC column with purified He at 20 cm3 min−1 . When 2 min have passed after the GC injection, the cryofocusing trap is cooled with liquid nitrogen by moving up another ss dewar. Three minutes later, SV4 is switched to the inject position. Purified N2 O from the GC is focused on the trap for 2 min. 2.4
Injection to GC-IRMS
After the cryofocusing step is completed, SV4 is switched to the load position, the liquid nitrogen dewar is moved down, and the cryofocus trap is heated to 70 ◦ C similarly, as in the case of the concentration trap. The N2 O is injected into another GC (GC6890; Agilent Technologies Inc., Santa Clara, CA, GC2 in Fig. 1) with He (2 cm3 min−1 ). It is further purified with the GS Carbon PLOT column (0.32 mm inner diameter (i.d.), 3 µm film thickness, 30 m; Agilent Technologies Inc.) maintained at 35 ◦ C. The purified N2 O is finally injected into an IRMS (MAT252; Thermo Fisher Scientific K.K., Yokohama, Japan) via an interface that includes a gas dryer with a permeation tube and two open split interfaces for the sample and reference gas (GC-combustion interface; Thermo Fisher Scientific K.K., slightly modified). Mass spectrometric analysis of N2 O isotopocules is conducted as described elsewhere (Toyoda and Yoshida, 1999; Toyoda et al., 2015). Briefly, molecular (N2 O+ ) and fragment (NO+ ) ions of N2 O are analyzed in independent runs. Solving the following equations and applying correction for the rearrangement or scrambling reactions during fragmentation, the isotopocule ratios are obtained as delta values. 45
R=15 R α +15 R β +17 R
(1)
46
R=18 R + (15 R α +15 R β )17 R+15 R α 15 R β
(2)
31
R=15 R α +17 R
(3)
17
R = A(18 R)γ
(4)
15
i
δ N=
15
i i Rsample /15 Rstandard − 1(i
= α, β, or bulk)
Atmos. Meas. Tech., 9, 2093–2101, 2016
(5)
α
15
SP = δ N − δ N
β
(6) (7)
In Eqs. (1)–(6), 45 R and 46 R respectively denote the measured ion-beam intensity ratios of m/z 45/44 and 46/44 in molecular ion analysis; 31 R shows a 31/30 ratio by fragment ion analysis; 15 R α , 15 R β , 17 R, and 18 R respectively denote the abundance of ions 14 N15 N16 O+ , 15 N14 N16 O+ , 14 N14 N17 O+ , and 14 N14 N18 O+ relative to 14 N14 N16 O+ . In Eq. (4), A = 0.00937035 and γ = 0.516 (Kaiser et al., 2003). In Eq. (5), δ 15 Nbulk denotes the average isotope ratios for 15 N /14 N. The subscripts sample and standard respectively denote the isotope ratios for the sample and the standard. SP denotes site preference. International standards for N and O isotope ratios are atmospheric N2 and Vienna Standard Mean Ocean Water (VSMOW), respectively. 2.5
Operation by PC software
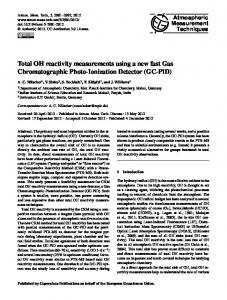
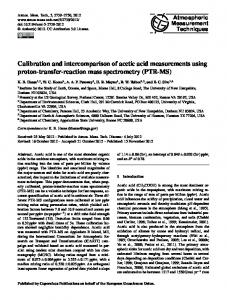
A personal computer (NI PXI-1042Q with a controller NI PXI-8196 and I/O boards NI PXI-6221, NI PXI-4351, NI PXI-8421, and NI PXI-6514; National Instruments Corp., Austin, TX) and programming software (LabVIEW Ver. 8.2; National Instruments Corp., Austin, TX) were used to activate the solenoid valves that regulate compressed air for airactuated shut-off valves and the air-actuated up–down stages, the multi/two-position switching valves, the vacuum pump system, the automatic liquid nitrogen supply system, and the temperature controller for the heaters. The PC also received analogue data from the pressure and vacuum gauges and from the manometer, received the TCD signal, and synchronized the GC-IRMS data acquisition with the end of the sample preparation procedure. The timing of each regulation function is presented in Fig. 2. The program developed in this study includes a special algorithm to adapt the sampling procedure to the prevailing sample pressure and N2 O concentration. As described briefly in Sect. 2.1, it has a user interface to obtain information related to the sample: the flask volume and the sample size to be injected. When the actual sample gas pressure is measured and obtained, it automatically determines the optimal procedure for sample injection. Figure 3 shows a flow chart for the algorithm. 3 3.1
Results and discussion Sample injection to the system
The time required for sample injection depends on the sample expanding option (see Sect. 2.1). It takes about 5 min when a 300 cm3 aliquot of air, which contains ca. 4 nmol of N2 O in the case of ambient air (ca. 320 nmol mol−1 ), is injected from a 1 L flask pressurized to about 2.5 atm (option no. 7). When the flask volume or inner pressure is lower, more time is needed because the number of repetitive sample www.atmos-meas-tech.net/9/2093/2016/
S. Toyoda and N. Yoshida: Development of automated preparation system for isotopocule analysis of N2 O
2097
(a) (next run) (b) (next run) (a) Devices
Swiching valves
Shut-off valves
Liquid N2 supply system and up-down stages Heaters
Gauges and instruments
t (min) SV1 SV2 SV3 SV4 V1 V2 V3 V4 V5 V6 V7 V8 V9 V10 V11 V12 V13 V14 V15 Liq N2 no. 1 Liq N2 no. 2 Heater no. 1 Heater no. 2 PG1 PG2 VG VP TCD GC-IRMS
0
(b) 5
(c) 10
(e)
(d)
15
35
40
(f)
45
50
// Position no. 1 Inject Load
Position no. 3
Close Open Open/Close
On
Off
On
Off Idling
Monitoring
Recording On
Off
Idling (previous run)
Monitoring Column baking
Running
Figure 2. Time sequence of the sample preparation procedure. Horizontal arrows on the top indicate the periods for evacuation of the inlet line (a), sample injection (b), cryogenic concentration of N2 O on T1 (c), purification of N2 O by GC1 (d), cryofocusing of N2 O on T2 (e), and injection of N2 O into GC2 (f). See also Fig. 1.
diffusion steps increases and one valve was operated 5 s after actuating another valve to equilibrate the pressure in the inlet line and to avoid potential fractionation of isotopocules. When a smaller sample volume with high N2 O concentration is measured, sample injection is completed in a minute or less. However, the performance of quantitative sample injection becomes poor for samples with more than 10 µmol mol−1 N2 O because the system cannot fully adjust the introduction of a small amount of sample (< 10 cm3 ). Moreover, the relative error of the pressure measurement increases for low pressure. Such highly concentrated samples are better introduced after dilution with N2 or He. Modification of one glass bottle (e.g., bottle C) to enable manual injection with a microsyringe is also possible. 3.2
Concentration, purification, and cryofocusing of N2 O
During cryogenic concentration of N2 O, the flow rate and flowing time of the He carrier gas should be optimized carefully to ensure quantitative recovery of N2 O and thus also minimize contamination of subsequent analyses (blank values). Our preliminary tests showed that each glass bottle (C, D, or E) is purged completely when the total volume of He is more than twice the bottle volume. This result indicates that laminar flow is predominant in the bottle. Turbulent flow, which is expected to cause exponential dilution and to result www.atmos-meas-tech.net/9/2093/2016/
in the consumption of a larger amount of He to sweep out the initial sample gas, is negligible. The main purpose of the purification step is separation of N2 O from CO2 and compounds that are less volatile than N2 O. CO2 is 1000 times more abundant than N2 O in ambient air samples. Its isotopocules have the same mass as those of N2 O. Therefore, it often interferes with mass spectrometric analysis of N2 O molecular ions. We tested two column packing materials for this purpose: Porapak Q and silica gel (dimension of the column was identical to that of Porapak Q, 60–80 mesh; GL Sciences Inc., Tokyo, Japan). Although silica gel has the unique property of eluting N2 O before CO2 , their separation took longer than in Porapak Q. The separation was not complete, even at 50 ◦ C with the flow rate of 15– 50 cm3 min−1 . We also strove to separate CO2 and N2 O without using chemical adsorbents, which revealed a condition under which CO2 and N2 O are separated almost completely in preliminary experiments using a thermal conductivity detector and a mixture of CO2 and N2 O in N2 bath gas (mixing ratios of CO2 and N2 O were ca. 250 µmol mol−1 ). However, a small CO2 peak was observed on the m/z 44 chromatogram after separation by the second GC. Mass ratios 45 R and 46 R showed dependence on the area of CO2 peak, which indicates that separation on the first column was insufficient for precise isotopocule ratio analysis of N2 O. Therefore, we inserted the chemical CO2 trap before cryogenic concentration. Volatile compounds such as halocarbons and hydrocarbons Atmos. Meas. Tech., 9, 2093–2101, 2016
2098
S. Toyoda and N. Yoshida: Development of automated preparation system for isotopocule analysis of N2 O
Start b Read n
Calculate Pcalc(i) = 101*n/(vb+v(i)) for i = 1 to 7
Open V1, Read PG1(1)
PG1(1) < 133
no
j=1
PG1(j) 450 Close V1, Open V4
yes Open V4 & V6
Close V1, Open V4 & V6
Read PG1(2) & PG2(1) vS = PG1(2)*(vb+0.03)/(PG1(1) – PG1(2))
Open V9
Calculate PG2calc(i) = PG2(1)* vS/(vs+v(i)) for i =1 to 7
Open V9
Open V6
Close V4 Read PG2(j)
Determine i which minimize Pcalc(i) – PG2calc(i)
nmeas(j) = PG2(j)*(vb+v(4))/101
i i=1
j2
Open V10 & V11 Write nmeas
Open V9
i=5
i=7
nmeas = nmeas(j)
Open V10
i=4
i=6
nmeas(j)/n