Preprint https://doi.org/10.1016/j.jlp.2016.11.002
Development of collision risk indicators for autonomous subsea inspection maintenance and repair Jeevith Hegde*, Ingrid Bouwer Utne, Ingrid Schjølberg Department of Marine Technology, NO 7491 Trondheim, Norway Norwegian University of Science and Technology (NTNU) J. Hegde, E-mail:
[email protected] (*corresponding author) Abstract The objective of this article is to present a method for developing collision risk indicators applicable for autonomous remotely operated vehicles (AROVs), which are essential for promoting situation awareness in decisions support systems. Three suitable risk based collision indicators are suggested for AROVs namely, time to collision, mean time to collision and mean impact energy. The proposed indicators are classified into different thresholds; low, intermediate and high. An AROV flight path is simulated to gather input data to calculate the proposed indicators and three collision targets are established, i.e., subsea structure, seabed and a cooperating AROV. The proposed indicator development method together with the case study show a proof-of-concept that the combination of mean time to collision and mean impact energy indicators can identify risk prone waypoints in the AROV path. The method results in an overall risk picture for a given AROV path. The results may provide useful input in replanning of mission paths and for implementation of risk reducing measures. Even though the method focuses on collision risk, it can be used for other accident scenarios for AROVs. Keywords: Collision risk, risk indicators, subsea IMR, autonomy, planning tool, risk picture
1
Introduction
Technology development initiatives in the oil and gas industry are necessary to realize the vision of subsea factories (Ramberg et al. 2013). Operational availability of these future subsea factories depend on safe operation of the subsea infrastructure and related intervention systems. In the oil and gas industry, Remotely Operated Vehicles (ROVs) are used to install, operate, and maintain subsea production systems. Currently, the need for subsea intervention systems, such as ROVs, are increasing across the world due to the increased number of subsea production wells. A subsea intervention system is also termed as an inspection, maintenance and repair system (IMR system), where inspection refers to visual inspection of subsea production system (SPS), maintenance refers to preventive maintenance and repair refers to corrective maintenance. The cost of subsea intervention is one of the key factors affecting future subsea maintenance. One alternative to reduce the cost of maintenance of future subsea fields is to introduce autonomy in the subsystems of both SPS and IMR systems (Schjølberg and Utne, 2015). However, increased autonomy in subsea intervention operations introduce technology and knowledge gaps (Hegde et al., 2015). When autonomous functionalities are implemented into a ROV, in the following denoted AROV, a system safety perspective is necessary to ensure safe functioning of the AROV during IMR operations. Future IMR operations may partly be remotely operated and partly be performed autonomously. The subsea equipment manufacturers and operators predict use of autonomous IMR systems in the next 5 to 10 years (Ramberg et al. 2013). In such a scenario, monitoring the AROV condition becomes paramount to ensure operational uptime and avoid costly incidents.
1
Preprint https://doi.org/10.1016/j.jlp.2016.11.002
The development trend towards AROVs can be observed in recent literature, in terms of a combination of ROVs and autonomous underwater vehicles (AUV) (Marani et al. 2009; McLeod 2010; Johansson et al. 2010; McLeod & Jacobson 2011; McLeod et al. 2012; Jamieson et al. 2012; Simetti et al. 2014; Albiez et al. 2015). Therefore, research results and recommendations contributing to safe AUV operations should also be considered during the development of AROVs. Collision risk is also highlighted as one of technical and operational risks in AUV operations (Griffiths et al. 2002; Utne & Schjølberg 2014). Introduction of autonomy in subsea IMR operations may also increase the probability of AROV collision with the SPS. The SPS contains sensitive instruments, which aid in maintaining optimal production rates. An example is the multi-phase meter, which is a sensitive instrument used to calculate the amount of oil, gas, and water flowing downstream through the SPS. External damage to such a sensitive instrument can result in shutdown, production loss or accidental leak of hydrocarbons. Relying only on failure information of the IMR subsystems is not a valid monitoring philosophy in an autonomous setting. In traditional ROV operations, the operator has a vital role in collision detection/avoidance. The operator is aided by advanced sensor systems, such as cameras, sonars and depth control. Even with autonomous capabilities, the AROV should allow for monitoring and control by human operators from an intervention vessel, or a remote onshore location. If a potential collision is about to occur, reliable collision risk indicators can promote situation awareness for both the autonomous control system and for the human operator. Therefore, early collision detection and avoidance ability of the AROV is vital in an autonomous setting to ensure safe IMR operations. An excerpt from the underwater vehicle standard Germanischer Lloyd Aktiengesellschaft (2009) reads; systems for locating of obstacles, like rocks, wrecks, pipeline, offshore structures, etc., are to be provided to avoid collision safely. Implementation of recommended requirements on AROVs requires an overall new operational philosophy, which uses the locational information from existing/future subsea infrastructure to map potential obstacles and mission target locations for IMR operations. By considering the existing obstacles and the IMR mission parameters of AROVs, such as velocity, position etc., collision risk indicators can contribute to improved planning and safety through simulations of the subsea IMR operations. Swuste et al. (2016) provide a comprehensive review of indicators used in the process industries. The literature also provides various methods for developing and using both safety and risk based indicators (see, e.g., Øien 2001; HSE 2006; Khan et al., 2009; Sonnemans et al., 2010; Øien et al. 2011; Øien et al., 2011b; Hassan & Khan 2012; Knegtering & Pasman 2013; Pasman & Rogers 2014; Jennings & Schulberg, 2009). However, current research into collision risk indicators for subsea IMR operations is very limited. The terms safety and risk indicators are used interchangeably from one application field to another. According to Øien et al. (2011), risk indicators are parameters that are estimated based on a risk model by using available data. Risk influencing factors (RIFs) are an aspect of a system or an activity that affects the risk level of this system/activity (Øien, 2001). The objective of this article is to present a method for identifying and quantifying collision risk indicators for AROV operations. A review of collision indicators/systems from other high risk sectors, i.e., the aviation, automotive, marine, and railway industries, is presented, providing input to development of collision indicators for subsea IMR operations. Such indicators can be utilized mainly in two different situations; i) by subsea IMR contractors to assess the collision risk associated with a given AROV path during the planning phase of an IMR operation; and (ii) as an aid for operators to assess collision risk online during IMR operations. A case study is performed focusing on application area (i), i.e., planning of an intervention mission. The main contribution of this work is a novel methodology for developing an overall risk picture for a given AROV path. The article focuses on collision risk, but the method can also be applied to other 2
Preprint https://doi.org/10.1016/j.jlp.2016.11.002
accident scenarios. No such methodology exists today. Early collision detection and avoidance is vital in autonomous operations to ensure safe IMR operations. This paper is organized as follows: Section 2 highlights related work on collision risk systems/metrics from other vehicular-based industries. This is followed by the general presentation of the proposed indicator development method in Section 3. Section 4 presents the case study with detailed step-by-step application of the proposed method. Section 5 discusses the findings and evaluates the properties of the proposed indicators followed by conclusions in Section 6.
1.1 Definitions Autonomous Remotely Operated Vehicle (AROV): ROVs that can perform select IMR operations autonomously (in presence of human supervisors) and reside in designated subsea docking areas. They shall be able to independently control manipulator functions, can navigate autonomously, perform selfdiagnostics, and are supervised by human supervisors (Hegde et al. 2015). IMR system: Consists of equipment and personnel necessary to perform inspection, maintenance, and repair operations on the SPS. IMR system consists of subsystems such as ROV, tether management system, control room, umbilical, ROV tools and launch and recovery system (Bai and Bai, 2010). Waypoint: Waypoints in this study refer to points in the AROV path where the AROV velocity and acceleration vector change in x, y, or z directions (Authors’ definition). Risk indicator: A risk indicator is a measurable/operational definition of a Risk Influencing Factor (Øien et al., 2011a). Subsea intervention: Subsea intervention are all activities performed subsea (Bai and Bai, 2010). Response time: The total time required by the AROV to successfully execute the predefined safety protocol for a given accidental scenario (Authors’ definition).
2
Collision risk in other vehicular industries
This section provides an overview of existing metrics to quantify collision risk in four vehicular industries. The aim of this section is to summarize and understand how collision risk metrics are used in other industries. Table 1 provides overview of existing collision detection/avoidance systems and metrics in four vehicular industries, further discussed below. Some of the selected literature do not use the term risk indicator specifically in their contributions (Arumugam and Jermaine, 2006; Dai et al., 2013; Garcia et al., 2007; Kuchar and Drumm, 2007; Lehner et al., 2008; Pereira et al., 2013, 2011; Zarèa et al., 2013). However, the measures suggested in these papers, can be interpreted as risk indicators, because they are dependent on operational variables of risk influencing factors (RIF) in their respective application contexts. Therefore, according to the definition of RIFs and risk indicators, the collision metrics are classified as risk indicators in this article. In the aviation industry, due to the inherent nature of operations, collision risk is addressed extensively. Collision risk is monitored by a Traffic Collision Avoidance System (TCAS), which can detect, assess, and recommend corresponding corrective actions to avoid mid-air aircraft collision. The main goal of the TCAS system is to avoid loss of life and aircrafts by monitoring vertical and horizontal separation between two or more aircrafts in flight. The suggested corrective response is carried out by manual control by human pilots. Methods for collision risk assessments for autonomous air vehicles using kinematic equations by solving the collision in horizontal and vertical spaces also exist in the literature. In applications of Unmanned Aerial Vehicles (UAVs), indicators, such as probability of detection of pipeline leak and probability of false alarm are proposed to provide indication of leaks and spurious detections.
3
Preprint https://doi.org/10.1016/j.jlp.2016.11.002
Table 1 Overview of collision detection/avoidance systems and metrics used in different vehicular industries Vehicular industries Aviation
Automotive
Collision systems/metrics
Parameters measured
Reference publication
Traffic Collision Avoidance System (TCAS)
Intruding aircraft detection and distance between aircrafts. Travel advisory (TCAS1). Resolution advisory (TCAS II and III) True positives, total targets False positives, total targets Time to collision with the vehicle in front.
(Belkhouche, 2013; Billingsley et al., 2012; Kuchar and Drumm, 2007; Morrel, 1957)
Probability of detection Probability of false alarm Time to collision (TTC) Headway Time Exposed Time to collision (TET) Time Integrated Time to collision (TIT) TTC societal risk
Marine
Railway
Distance between two vehicles moving in the same direction. Threshold value of TTC Integral
of
threshold
value
of
TTC
(Zarèa et al., 2013) (Zarèa et al., 2013) (Minderhoud and Bovy, 2001; Vogel, 2003) (Vogel, 2003) (Minderhoud and Bovy, 2001) (Minderhoud and Bovy, 2001)
TTC exposed to society (other road users)
(Qu et al., 2014)
TTC individual risk
TTC exposed to individual (motorists)
(Qu et al., 2014)
Closest Point of Approach (CPA) Time to Closest Point of Approach (TCPA) Minimum risk path
Separation distance between two ships Minimum time to approach
(Arumugam and Jermaine, 2006) (Arumugam and Jermaine, 2006)
Risk between path waypoints of a underwater vehicle Distance between trains. Braking command. Traffic alert.
(Pereira et al., 2013, 2011) (Lefebvre et al., 2016) (Garcia et al., 2007; Lehner et al., 2008)
Railway Collision System (RCAS)
Avoidance
In the automotive industry, collision indicators are explained in detail with different theoretical and experimental methods. Two indicators, namely time to collision (TTC) and headway are widely discussed. TTC indicates the time between two automobiles, which do not take evasive action to prevent collision. Headway is defined as the time difference between two vehicles passing the same target location. Extensions of TTC and headway indicators are also described in the literature, namely time exposed time to collision (TET) and time integrated time to collision (TIT). The TET indicator is expressed in seconds and is an extension of TTC. When a threshold value of TTC is reached within time t, the time exposed in this state is measured. The TIT indicator is expressed as the integral of the TTC profile. Other extensions of the TTC indicator are TTC societal risk and TTC individual risk. The total number of TTC conflicts observed on a segment of a road in one hour represents TTC societal risk. The individual (road user or motorist) risk is exposure to TTC conflicts in the journey time. The TTC indicator has also been used to detect potential collisions between motor vehicles and cyclists through video analysis of TTC indicator. In the marine industry, the minimum risk path for underwater glider missions can be calculated by using Automatic Identification System (AIS) data of ship positions. A glider resurfacing in the same position as that of a ship is defined as an accidental event. The minimum risk path is calculated by using a heuristic cost function, which is set to minimum risk along N number of resurfacing way points of the glider. The closest point of approach (CPA) and Time to closest point of approach (TCPA) are two metrics used in managing collision risk in the maritime industry. CPA is the position at which two dynamically moving objects attain their closest possible distance. TCPA is the minimum time to approach the closest possible distance between two dynamically moving objects. In the railway industry, studies are performed to investigate different communication protocols used in collision avoidance systems in aviation, maritime and automotive industries, which are then modified to railway applications. Specifically, collision surveillance methods used in the TCAS system are modified
4
Preprint https://doi.org/10.1016/j.jlp.2016.11.002
to the railway applications (Railway collision avoidance system - RCAS) and formulas to quantify the distance between trains, braking command and traffic alert messages have been proposed.
3
Method for developing collision risk indicators
The method presented in this article for developing collision risk indicators is illustrated in Figure 1, consisting of six steps. Collision risk metrics from other industries described in Section 2 are used as inputs to Step 3 as shown in Figure 1.
Figure 1 Proposed indicator development and verification method, adapted from Øien (2001)
Table 2 describes the six steps of the proposed method. The steps involved in the proposed method is applied to a case study in Section 4. Table 2 Steps involved in the proposed indicator development and verification method
Step 1 System description
Step 2 Accidental collision scenarios Step 3 Identify/define RIFs and proposed indicators Step 4 Data collection to calculate the risk indicators
The outcomes from the system description step are identification of system boundary, identification of subsystems making the vehicle system, types of operation modes (system interaction with external surroundings) and type of operational/control philosophies (human machine interface). The system description shall provide relevant background information of the system to perform the following steps in the method. By understanding the systems’ boundary, limitations and interaction with the surroundings, accidental collision scenarios shall be identified in Step 2. Modes of operation of a vehicle can support identification of vehicle interaction with the surrounding. For example, an underwater vehicle is exposed to the seabed during the IMR mission, therefore; one of the accidental scenarios is collision with the seabed. The factors influencing the accidental scenarios, shall be listed, for example, the time required by a vehicle to collide with an obstacle, velocity of the vehicle etc., Step 3 shall result in identification of indicators and RIFs applicable to the concerned systems. In this step, modification of existing risk indicators from other vehicular industries should be explored and their applicability to the system under study needs to be evaluated. Input data (RIF data) is needed to calculate the proposed indicators. RIF data can either be collected from operational logs or systems, or an alternative is to obtain simulated results. This step can be challenging for novel vehicles due to absence of historical data. If such, simulation approach can be one of the alternative to collect required RIF data.
5
Preprint https://doi.org/10.1016/j.jlp.2016.11.002
Step 5 Establish threshold for risk indicator values
Step 6 Collision risk: Safe waypoints in path
The threshold values are established for the proposed indicators values. The threshold values are necessary to classify the risk indicator values as either risk prone or risk averse. These threshold values can be derived from either acceptance criteria or requirements from industry standards. In case there are no existing criteria or requirements, assumptions can be made by expert judgment. Since, the method is based on a risk model, simulations can be used to generate an overall risk picture, which can highlight unsafe waypoints in a given vehicle path. Risk priority numbers are allotted to the classification of the risk indicator thresholds (for example; low, intermediate, high). Depending on the number of collision scenarios, the summation of risk priority numbers can highlight the collision risk in different waypoints of the vehicle path and for different collision targets.
The proposed risk indicator method is adapted from Øien (2001), but modified to suit all types of underwater vehicles, including AROVs. The modifications are: (i) A systems description step is added to define the boundaries and operational philosophies of the system. (ii) Collision risk metrics from other vehicular industries provide input for identifying RIFs and risk indicators. (iii) Threshold values for indicators are established to compare the results from simulation during planning. Such values are also useful for decision support during the planning phase of IMR operation.
4
Case study – collision risk indicators for subsea IMR operations
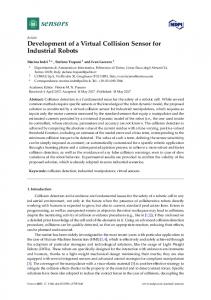
In the following, the method presented in Section 3 is applied to develop collision risk indicators, which are useful in the planning of IMR operations with AROV. The case study is structured according to the six steps as described in Section 3 and is elaborated in the following subsections. In order to verify the proposed indicator development method, an autonomous subsea IMR case study approach is established. Figure 2 illustrates the IMR case study used in this article. In Figure 2, the AROV is launched from an intervention vessel and is capable of flying to the target SPS structure by utilizing a 3D acoustic network for navigation. The human supervisors either from the intervention vessel or from an onshore facility predetermine the AROV path. During the intervention mission, an AROV can come across another AROV (2nd AROV) as illustrated in Figure 2.
Figure 2 The autonomous IMR case study
6
Preprint https://doi.org/10.1016/j.jlp.2016.11.002
The following assumptions are made in the case study:
A subsea acoustic communication network can provide relatively accurate positioning of the AROV and the targets The AROV does not require running of an umbilical chord or a tether from the intervention vessel. Nevertheless, the proposed indicators can also be used for traditional ROVs operating with a tether. Human supervisors predetermine the AROV path during planning and the IMR mission. External factors, such as human interaction and sea currents, are assumed to be in ideal/safe conditions during the IMR operation and are therefore not considered in this case study. The AROV is assumed to be in full working condition and technical faults or failure in the AROV subsystem, such as the navigation system, are absent during the mission. Three collision scenarios are considered: (i) collision with subsea structure, (ii) collision with seabed, and (ii) collision with other underwater vehicles (2nd AROV). The point of collision contact is the outermost plane of the AROV in the heading direction and the exposed plane of the AROV panel on the subsea structure. The second AROV is parallel to the AROV heading direction as illustrated in Figure 3. For collision with seabed, the AROV plane in the heave direction (the lower horizontal plane of the AROV) is considered.
Figure 3 Assumed collision planes of the AROV in the case study
System description - Step 1 In this section, the AROV system, different modes of operation, and the architecture for human machine interface (HMI) are described for the chosen case study.
4.1.1 The AROV system The AROV system consists of various subsystems, such as, battery, navigation, control, buoyancy, safety, manipulator, communication, propulsion, lighting and sensor subsystems. In reference to Figure 2, the AROV sensor inputs provide the vehicle control system with data, such as AROV acceleration, relative position, and AROV velocity. These vehicle data can be used by the safety surveillance system of the AROV to calculate risk based indicators, as described in following subsections. The AROV also uploads the vehicle data to the HMI of the human supervisor.
4.1.2 Modes of operation of AROVs Current ROV operational modes during subsea interventions can be categorized into five modes of operation i) launch, ii) approach to SPS structure, iii) intervention, iv) return to base, and v) recovery. The base mode for traditional ROVs is an intervention vessel. An acoustic (e.g., Long Baseline) positioning system empowers the ROV system with navigation capabilities (Christ and Wernli R.L., 2013). Each 7
Preprint https://doi.org/10.1016/j.jlp.2016.11.002
mode of operation demands different behavior from the IMR system. Currently, this need for change in system behavior is achieved by ensuring that all modes of operations are actively controlled and supervised by human operators usually located on an intervention or support vessel.
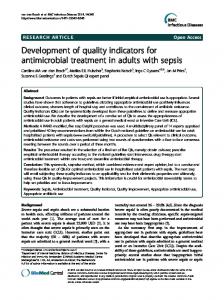
Figure 4 Modes of operation for AROVs
The modes of operation for AROV systems will be similar to current ROV systems, as illustrated in Figure 4. Figure 4 shows how an AROV can be launched either from an intervention vessel or a subsea garage (on the seabed), as shown in Mode 1. In Mode 2, the AROV approaches the SPS structure (AROV flight) in subsea environments where the acoustic network is present. In Mode 3, the AROV performs the intended intervention operation on the SPS. In Mode 4, the AROV returns to the flying mode through the subsea environment. In Mode 5, the AROV can be recovered by the intervention vessel or reside inside a subsea garage. The 3D acoustic positioning encompasses acoustic transducers installed on the seabed of the field and Ultra-short Baseline (USBL) acoustic systems from an intervention vessel. In areas where the acoustic signals are weak, the sensor system on the AROV assist in safe navigation to target.
4.1.3 Human machine interface There is a need for common situation awareness between the AROV control system and the human operators supervising the AROV. Similarly, decision making needs to be shared across both the AROV and the SPS.
Figure 5 Architecture for shared AROV autonomy
8
Preprint https://doi.org/10.1016/j.jlp.2016.11.002
Figure 5 illustrates that perceived operational hazards by any one of the two decision support systems (DSS) (subsea local DSS and human supervisor DSS) need to be assessed and communicated to both the human supervisor and the AROV. The AROV and the SPS also communicate and make decisions among each other. Operation-specific decisions, such as time to approach, approach velocity, orientation of the vehicle in relation to the SPS, faulty state of the SPS and AROV can be communicated between the two systems to enhance local situation awareness and take appropriate corrective actions. For example, if the AROV is approaching towards the wrong side of the SPS, appropriate course correction action can be suggested by the SPS to the AROV system. The AROV relays the vehicle status to the graphic user interface, which is observed by the human supervisor. The human supervisor can override the control system of the AROV when needed (on demand basis) as shown by the override of control block.
Accidental collision scenarios - Step 2 In the second step, it is assumed that the surroundings of the AROV during the IMR operation are known. By studying the modes of operation of the AROV, three collision scenarios are considered, as illustrated in Figure 6. Collision is viewed as an accidental event, which may occur in the following ways: (i) (ii) (iii)
The AROV can collide with the subsea structure with which it interacts during the IMR operation The AROV can collide with the seabed during any of the five modes of operation The intervention operation may require multiple AROVs functioning simultaneously. Therefore, the AROV can collide with other underwater vehicles operating in the vicinity; in the case study simplified to a 2nd AROV.
Figure 6 Collision scenarios for AROVs
Indicator identification - Step 3 From the collision avoidance systems/metrics used in other vehicular industries (Table 1), three fundamental variables/RIFs can be identified; namely distance to target, vehicle velocity, and vehicle acceleration. A simple RIF model is illustrated in Figure 7, which shows the RIFs that affect the risk of a collision. Such influence diagrams assist in identifying risk indicators, which can capture the change in RIF values. In Figure 7, the RIFs are vehicle acceleration, distance to target, and vehicle velocity. To calculate the maximum achievable velocity of the AROV, the vehicle drag forces have to be calculated. time to collision (TTC), mean time to collision (MTTC), and mean impact energy are the three proposed collision risk indicators.
9
Preprint https://doi.org/10.1016/j.jlp.2016.11.002
Figure 7 Risk Influencing Factor model for AROV collision risk
4.3.1 Time to collision indicator The TTC indicator is an operational indicator, which can be used by the AROV manufacturers or by AROV service providers to obtain an estimate of TTC during live or simulated missions. The TTC indicator requires an approximate estimate of distance to the collision objects or targets, acceleration, and velocity. Equation 1 results in the distance to the chosen targets from the AROV where 𝑥1 , 𝑦1 , 𝑧1 are point coordinates on the AROV and 𝑥2 , 𝑦2 , 𝑧2 are point coordinates on the target. Targets in the case study are the subsea structure, seabed, and 2nd AROV. Equation 2 expresses the resultant velocity where 𝑣𝑥 , 𝑣𝑦 , 𝑣𝑧 represent velocity vectors at x, y, and z directions. The velocity of the AROV is measured in meters per second (m/s) and distance to target is measured in meters (m). The TTC indicator can be calculated by using Equation 3. 𝐷𝑖𝑠𝑡𝑎𝑛𝑐𝑒𝑇𝑎𝑟𝑔𝑒𝑡 = √(𝑥2 − 𝑥1 )2 + (𝑦2 − 𝑦1 )2 + (𝑧2 − 𝑧1 )2
(1)
2
𝑅𝑒𝑠𝑢𝑙𝑡𝑎𝑛𝑡 𝑣𝑒𝑙𝑜𝑐𝑖𝑡𝑦 = √(𝑣𝑥 )2 + (𝑣𝑦 ) + (𝑣𝑧 )2
𝑇𝑖𝑚𝑒 𝑡𝑜 𝑐𝑜𝑙𝑙𝑖𝑠𝑖𝑜𝑛 (𝑇𝑇𝐶) =
𝐷𝑖𝑠𝑡𝑎𝑛𝑐𝑒 𝑡𝑜 𝑡𝑎𝑟𝑔𝑒𝑡 𝑅𝑒𝑠𝑢𝑙𝑡𝑎𝑛𝑡 𝑣𝑒𝑙𝑜𝑐𝑖𝑡𝑦 𝑜𝑓 𝐴𝑅𝑂𝑉
(2) (3)
4.3.2 Mean time to collision indicator The TTC indicator is dynamic and sensitive to change because at every point in the AROV path the TTC indicator value is continuously updated. To minimize and make sense of the risk between the two selected waypoints of the AROV path, the MTTC value can provide a single value approximation. The MTTC indicator can be defined as a preoperational (planning) collision risk indicator depending on the status of the mission completion in the AROV path. To calculate the MTTC indicator, between two waypoints in the AROV path, a mean of the TTC is calculated for all three targets, i.e., the SPS, the seabed, and the 2nd AROV. The advantage of the MTTC indicator is that it allows for a simplified process to calculate the risk between a set of waypoints in the AROV path. The MTTC indicator can be 10
Preprint https://doi.org/10.1016/j.jlp.2016.11.002
represented by Equation 4, where i is prior waypoint and i+1 is the next waypoint in the AROV path, and 𝑁 is the total 𝑇𝑇𝐶 data points between 𝑊𝑎𝑦𝑝𝑜𝑖𝑛𝑡𝑖 and 𝑊𝑎𝑦𝑝𝑜𝑖𝑛𝑡𝑖+1 . 𝑊𝑎𝑦𝑝𝑜𝑖𝑛𝑡
𝑀𝑒𝑎𝑛 𝑇𝑖𝑚𝑒 𝑡𝑜 𝑐𝑜𝑙𝑙𝑖𝑠𝑖𝑜𝑛 (𝑀𝑇𝑇𝐶) =
𝛴𝑊𝑎𝑦𝑝𝑜𝑖𝑛𝑡𝑖𝑖+1 𝑇𝑇𝐶 𝑁
(4)
4.3.3 Mean impact energy indicator Ideally, the impact energy needs to be lower when approaching a target of interest during an AROV intervention on the SPS. Limiting the potential impact energy of the AROV is vital for both the asset safety (AROV and other AROVs) and the SPS. An indication of the impact energy can be used to assess the energy dissipated should a collision occur. This indicator can inform the AROV or the human supervisor about the consequence of an AROV collision with the target or an unknown obstacle in the subsea environment. This indicator is dependent on the velocity of the AROV, but also the mass of the AROV. Hence, it provides important information, in addition to the TTC and MTTC. Equation 5 represents the kinetic energy dissipated during an AROV collision. 1 2 ∗ 𝑎 ∗ 𝑚 ∗ 𝑣𝐴𝑅𝑂𝑉 2
𝐼𝑚𝑝𝑎𝑐𝑡 𝐸𝑛𝑒𝑟𝑔𝑦 =
(5)
In Equation 5, the term 𝑎 is the added mass coefficient, 𝑚 is the AROV displacement in kg (water displaced in kg), 𝑣𝐴𝑅𝑂𝑉 is the velocity of AROV in m/s. An added mass value of 1.05 is assumed as suggested for frontal collisions (Dai et al., 2013). A mean impact energy is calculated between the chosen waypoints in the AROV path, as represented in Equation 6. 𝑁 is the total impact energy data points between 𝑊𝑎𝑦𝑝𝑜𝑖𝑛𝑡𝑖 and 𝑊𝑎𝑦𝑝𝑜𝑖𝑛𝑡𝑖+1 . 𝑊𝑎𝑦𝑝𝑜𝑖𝑛𝑡
𝑀𝑒𝑎𝑛 𝐼𝑚𝑝𝑎𝑐𝑡 𝐸𝑛𝑒𝑟𝑔𝑦 =
𝛴𝑊𝑎𝑦𝑝𝑜𝑖𝑛𝑡𝑖𝑖+1 𝐼𝑚𝑝𝑎𝑐𝑡 𝐸𝑛𝑒𝑟𝑔𝑦 𝑁
(6)
Data collection to calculate the risk indicators - Step 4 AROV vehicle logs can be used to obtain the RIF values and for calculating indicator values online during a mission. When the collision risk indicators are used for planning of an IMR operation, such as in this case study, the simulation of an AROV mission is used. A simulation program is necessary to obtain the RIFs values required to calculate the proposed indicators along a given AROV path. Vpython is a visual animation/computational programming tool, which can perform parallel mathematical computations (Sherwood and Chabay, 2011) and is chosen to simulate the proposed collision risk indicators. In the case study simulation, it is assumed that the AROV changes velocity vectors in five waypoints (0 - 4). In a real life scenario, the AROV may change velocity vectors more than the assumed number of times. However, the number of waypoints do not change the overall method for calculating the proposed indicators. Figure 8 illustrates a simulation model of the AROV path to the targets. For the case study, Figure 8 shows the AROV path, which has five waypoints where the AROV changes the propulsion direction. The AROV collects information on distance to the three targets, namely subsea structure, seabed and 2nd AROV by using different sensors. The white marked waypoints in Figure 8 are start and end waypoints in the AROV path, while the black marked waypoints are intermediate waypoints in the AROV path.
11
Preprint https://doi.org/10.1016/j.jlp.2016.11.002
Figure 8 Simple illustration of AROV path in Vpython simulation
The AROV dimensions are based on a data sheet of a current/traditional work class ROV (DeepOcean, 2014). Figure 9 is the simulation window running on a predetermined path. The indicator calculations are converted to iterative functions within each point of the path. The values of TTC and impact energy are obtained at all points of the path. The MTTC indicator is also calculated between all waypoints in the AROV path. Appendix A describes the pseudocode of the program.
Figure 9 Simulation of proposed risk indicators in Vpython
12
Preprint https://doi.org/10.1016/j.jlp.2016.11.002
4.4.1 Indicator calculation process Data of RIF values are required to calculate the proposed risk indicator values as described in Equation 3, 4, and 6. To obtain data of the RIF values, either historic data or a simulated data can be used. Figure 10 illustrates the general process to calculate the proposed collision risk indicators. Simulation of IMR operation in the given AROV path results in RIF values. RIF values, such as current acceleration, distance and velocity are collected along the AROV path. The simulation program calculates the risk indicator values.
Figure 10 Calculation process of proposed collision risk indicators.
4.4.2 RIF and indicator values from simulation The simulation of the AROV path, as illustrated in Figure 9, results in RIF values presented in Table 3. The acceleration in the simulation program is constant between waypoints, while velocity and distances change along the different waypoints. It is observed that the AROV mean velocity is highest between Waypoints 3 to 4 and distance to targets is highest in Waypoints 0 to 1. The values of mean velocity and mean distances listed in Table 3 do not correspond to the same data point, this is because there is variation of velocity in the given case study. Table 3 Simulated values for RIFs Waypoints 0 to 1 1 to 2 2 to 3 3 to 4
Acceleration (m/s2) 3 * 10-3 1 * 10-4 3 * 10-3 2 * 10-3
Mean velocity (m/s) 1.5985 0.9083 1.6140 1.6744
Mean distance structure (m) 1050.4283 648.5374 452.8281 235.7267
Mean distance seabed (m) 959.5005 397.6500 123.9516 47.7320
Mean distance 2nd AROV (m) 877.9469 389.3665 189.4313 176.9055
The results of a simulation provide values for the MTTC indicator and mean impact energy indicator, as presented in Table 4. Note that the deduction of MTTC from Table 3 values will differ when compared to MTTC values in Table 4 due to the presence of both changing acceleration and velocity vectors in the different waypoints in the AROV path. The simulation program applies Equation 5 and 6 to calculate the MTTC and mean impact energy indicators. The results obtained from the simulation program is further used as input to Step 6 (see Section 4.6).
13
Preprint https://doi.org/10.1016/j.jlp.2016.11.002
Table 4 Calculated values for indicators Waypoints 0 to 1 1 to 2 2 to 3 3 to 4
MTTC to structure (s) 712.78 714.08 283.73 143.46
MTTC to seabed (s) 657.96 437.99 78.58 28.87
MTTC to 2nd AROV (s) 602.48 428.81 119.06 104.94
Mean Impact Energy (J) 5468.58 1686.82 5345.69 5748.12
Establish threshold for risk indicator values - Step 5 Threshold values for the MTTC and mean impact energy indicators are presented in this subsection. In Subsection 4.6, the thresholds are used to compare the results from the simulations. The TTC thresholds are not established because for the given case study the analysis is focused on MTTC indicator. However, if the method is applied for online AROV missions, thresholds for TTC indicators also have to be established.
4.5.1 Thresholds for proposed indicators Currently, none of the AROV standards dictate the minimum safe distances from targets or velocities for AROVs (Hegde et al. 2015). Therefore, for the current case study, a safety response time of 150 seconds is assumed to avoid a collision scenario by an AROV. This can involve tasks to be performed by AROVs or human supervisor, such as detecting the obstacle, assessing the risk of collision and performing evasive actions. Obviously, high MTTC values are favorable as compared to low MTTC values to reduce the chances of collision with the targets. Since, the 2nd AROV can move in the opposite direction to the AROV, conservative threshold values are established. The threshold values for MTTC to the subsea structure, the seabed and 2nd AROV can be divided into three categories; low, intermediate and high (in seconds), as listed in Table 5. Table 5 Classifying thresholds for MTTC MTTC
Low (s)
Intermediate (s)
High (s)
To subsea structure and seabed To 2nd AROV
0 - 250
250 - 500
500 and above
0 - 150
150 - 300
300 and above
To determine the thresholds for the impact force, the requirement to impact collision energy is traced from (ISO 13628-1, 2005), which allows a point impact load of 5000 Joules on a SPS in form of a dropped object. The impact energy depends on the added mass of the chosen AROV. Hence, to determine the approximate AROV impact energy, it is necessary to choose the most adequate volume of the AROV. Hence, a stepwise increase in the AROV volume is considered to compensate for water ingress in the AROV body. A conservative AROV volume estimate of 0.6 times the AROV volume is assumed. Since the mass is constant for the given AROV, the variable in the mean impact energy equation is the velocity of the AROV. The thresholds for impact force is divided into three categories; low, intermediate and high (in Joules) as listed in Table 6. In this case study, the threshold values are obtained by assumption of severity to the
14
Preprint https://doi.org/10.1016/j.jlp.2016.11.002
AROV functions. A low mean impact energy will not endanger the functions of the AROV, while a high mean impact energy can endanger the SPS or AROV functionality. Table 6 Classifying thresholds for mean impact energy Low (J)
Intermediate (J)
High (J)
0 – 2000
2000 – 4500
4500 and above
Collision risk – safe waypoints in the AROV path - Step 6 In this step, the calculated indicator values from Table 4 are compared with the established threshold values in Table 5 and Table 6 to generate an overview of collision risk. A multi-criteria decision making approach is suggested to be able to rank the waypoints in terms of highest or lowest risk. This requires allotting a risk priority number (RPN) for each of the different threshold values of the collision risk indicators. In general, a RPN is based on the general definition of risk, i.e., 𝑅𝑖𝑠𝑘 = 𝑂𝑐𝑐𝑢𝑟𝑎𝑛𝑐𝑒 ∗ 𝑆𝑒𝑣𝑒𝑟𝑖𝑡𝑦 Here, we choose a conservative approach assuming that the AROV is on collision course, which means that the RPN reflects the severity. In this article, the RPNs range from low = 1, intermediate = 2, to high = 3. Table 7 presents the RPNs allotted for the indicator threshold values. For the MTTC indicator, high values are favorable (1) and for the impact energy indicator, low values are favorable (1). Table 7 Risk priority number for the threshold values Indicators
Low
Intermediate
High
MTTC
3
2
1
Mean impact energy
1
2
3
To determine the overall risk picture, MTTC values for all three targets need to be considered resulting in different RPN for each target. This can be observed in Waypoint 1 - 2 and Waypoint 2 – 3 where MTTCstructure and MTTCseabed have different RPNs. The minimum total RPN can be 4 (MTTCstructure high, MTTCseabed high, MTTC2ndROV high, mean impact energy low) and the maximum total RPN can be 12 (MTTCstructure low, MTTCseabed low, MTTC2ndROV low, mean impact energy high), as presented in Table 8. Low
4
5
6
7
Intermediate
8
9
High
10
11
12
Risk priority numbers Figure 11 Risk priority number chart
Figure 11 illustrates the established RPN chart where the favorable/ low RPNs are from 4 to 6, lessfavorable from 6 to 9 and least favorable from 9 to 12. A low RPN relates to indicator thresholds values, which do not pose a threat to primary AROV functions. An intermediate RPN relates to indicator 15
Preprint https://doi.org/10.1016/j.jlp.2016.11.002
thresholds values, which pose a threat to AROV functions and can result in degraded performance of primary AROV functions. A high RPN relates to indicator thresholds values, which can lead to failure of AROV functions, leading to an aborted mission. From established threshold values in Table 5 and Table 6, the risk indicators values obtained from the calculation (Table 4) can be classified, as shown in Table 8. Further, the classification of risk indicator values (high, intermediate and low) are allotted RPNs by using Table 7. This results in RPN for each waypoint, which are added to get the total RPN. Table 8 presents calculation of total RPN based on established threshold values for mean impact energy and MTTC for the three targets. Table 8 Calculation of overall risk priority number Waypoints
MTTC Structure
MTTC Seabed
MTTC 2nd AROV
Mean Impact Energy
Waypoint 0 – 1
High
High
High
High
Total risk priority number 6/12
Waypoint 1 – 2
High
Intermediate
High
Low
5/12
Waypoint 2 – 3
Intermediate
Low
Low
High
11/12
Waypoint 3 – 4
Low
Low
Low
High
12/12
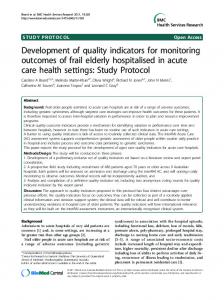
In combination with the total RPN from Table 8, Figure 12 illustrates the overall collision risk picture for the given AROV path. According to the established RPNs, Waypoints 2 to 3 and Waypoint 3 to 4 are identified as high risk waypoints. While Waypoint 0 to 1 has intermediate RPN, Waypoints 1 to 2 is the favorable/low risk waypoint in the AROV path. The red zone in Figure 12 shows that the indicator values are at a high threshold level. This means that reducing the values of the RIFs affecting the indicators, will reduce risk of collision. For example, reducing velocity when approaching the subsea structure (Waypoint 3 – 4) during operation will reduce the risk of collision. Another option could be to reduce the mass of the vehicle during planning by choosing a smaller AROV. Through simulation it is then possible to assess the optimum RIF values versus mission or operation time, since mission time affects costs. 12
12
11
11
Risk Score
10 9 8 7 6
6 5
5 4 Waypoints 0 - 1
Waypoints 1 - 2
Waypoints 2 - 3
Waypoints 3 - 4
Figure 12 Risk picture for the given AROV path
16
Preprint https://doi.org/10.1016/j.jlp.2016.11.002
5
Discussion
The case study focusing on AROV and collision risk for subsea intervention shows how risk indicator values can be used to identify risk prone waypoints in the AROV path. In the following, the application of the proposed method on a case study is discussed and five specific challenges are addressed:
Assessment criteria of proposed indicators Planning of AROV paths and online risk assessment Advantages and disadvantages of the proposed method Challenges in quantifying impact energy of AROVs Application of TCAS philosophy to AROVs
Assessment criteria for proposed indicators There are different ways of assessing the quality of indicators, e.g., see (Kjellèn, 2000; Gray and Wiedemann, 1999; Vinnem, 2010; Øien, 2013). The proposed indicators in this article can be evaluated using the recommendations from Vinnem (2010), which are feasible for underwater vehicles, as well: Easily observable performance: All three proposed indicators (time to collision, mean time to collision and mean impact energy) are observable. The proposed indicators are intuitive, and do not require complex calculations and reflect hazard mechanisms: They are based on simple physics formulas and are very easy to understand and interpret by the end user. The proposed indicators are sensitive to change, robust to manipulation and not influenced by campaigns. They are dependent on factors, which are constantly changing. For example, a sudden change in velocity can either decrease or increase the indicator values. The simulation of the indicators through a simulator ensures robustness against manipulation or campaigns. The proposed indicators can show trend values of the collision risk, which can be observed as the major hazard risk during autonomous subsea IMR operations.
Planning of AROV paths and online risk assessment The results from the case study demonstrate that the collision risk of AROVs depend on vehicle related RIFs and the mission path. If the AROV mission path is known, collision risk indicators can be used to plan safe operations by implementing risk reducing measures (for example, adjusting the vehicle RIFs to the acceptable safe values) across all modes of operations. On the other hand, if the mission path is unknown, a live implementation of the indicators could provide a continuous risk picture of the mission to both the AROV and the human supervisor by highlighting risk prone waypoints in the mission path. The risk picture provides a chronological update of the risk level throughout the given AROV path. This input can be used to choose the least risk prone mission paths/RIF values for upcoming missions. The case study presented uses a simulation of an AROV path to collect RIF values and calculate risk indicator values, which are further assessed to determine the collision risk, manually. This approach is suitable for applications where offline decision support is sufficient. However, to derive collision risk for live AROV mission (online mission), the simulation program has to be able to calculate the collision risk without operator involvement. A selected roadmap-based method (for example, visibility graph) can be combined with a rule-based method (for example, TCAS) to avoid loss of AROV functions due to existing collision risk. A roadmap-based method is suitable because the subsea field layout is known and therefore contingency paths can be development before the start of the operation. When an intruder is sighted/detected in the 17
Preprint https://doi.org/10.1016/j.jlp.2016.11.002
AROV path by the AROV sensor system, a rule-based method can be used to first avoid accidental scenarios. Simultaneously, a roadmap-based approach can form a basis for analyzing the second or third alternative path to the intendent subsea structure. In online risk assessment applications, the risk indicators presented in this paper could be used as an activity before or while the AROV detects a potential intruder. When a new collision free path is chosen by the AROV, the proposed indicators can be used to determine the risk prone waypoints in the updated or contingency AROV path by using the updated values of the RIFs.
Advantages and disadvantages of the method Fundamentally, there are two generic parts in the proposed method: firstly, to calculate the collision risk indicators and secondly, to evaluate their output for minimizing collision risk. The collision indicators mentioned in Table 1 share three main parameters related to vehicle and target; velocity, distance, and time. It is evident that the vehicle specifications (vehicle specific RIFs) and the environment influence the collision time and energy dissipation. The results from the case study show that appropriate risk reducing measures can be proposed by reducing the values of the RIFs affecting the indicator values for a given AROV path. For example, AROV velocity can be maintained within a low threshold during the approach to the SPS or when the AROV is a short distance away from the seabed or other AROVs. In addition, the advantage of the proposed generic method is that it can also be applied to other autonomous systems, for example, UAVs, autonomous automobiles, etc. Different models of AROVs may have different structural design, which can lead to different volumes covered by the AROV. Since volume of water dissipated is linked to the actual mass of the AROV, the added mass of the AROV is important to consider in future design implementations of AROVs. In this article, the authors have considered 60% volume of the total volume of the AROV box model during the calculations of the indicators. The case study has not considered the possible errors in estimation of the vehicle parameters, such as velocity and acceleration. In an autonomous system, such errors can lead to wrong situation awareness both by the AROV and the human supervisor. Therefore, reliable vehicle data from position and navigational sensors are important inputs to the proposed method.
Impact energy of AROV In the case study, the impact energy indicator has shown presence of high impact energy dissipated to the structure. The mean impact energy at Waypoint 0 to 1, Waypoint 2 to 3, and Waypoint 3 to 4 exceed the 5000 joules requirement laid down by (ISO 13628-1, 2005). Requirements for collision energy absorption from autonomous vehicles need to be addressed by relevant subsea structural design standards. Since this study is a proof-of-concept, it has not assessed the damage potential in terms of force and displacement both locally on the AROV and globally on the target.
Safety philosophy in traffic collision avoidance system (TCAS) applied to underwater vehicles Aviation systems have many similarities with the underwater vehicles. A key difference is that the aviation industry has to ensure safety of not only the aircrafts, but also of passengers and crew. In contrast, a collision with an AROV can result in financial and environmental consequences. Hence, AROVs need to incorporate safety functions to avoid loss of production from the SPS, loss of the AROV, and negative impact on the environment. 18
Preprint https://doi.org/10.1016/j.jlp.2016.11.002
Figure 13 Example of TCAS applied to AROV operations
Figure 13 illustrates a possible setup for AROV missions, based on safety philosophy in TCAS. This specifies vertical and horizontal separation between known objects and unknown obstacles present in the AROV vicinity. Current ROV systems are dependent on human operators’ ability to perceive and avoid collision scenarios and in AROV operations the safety philosophy must be implemented in the system.
6
Conclusions
This article presents a method for developing collision risk indicators for subsea IMR operations. Current literature demonstrates that collision risk indicators for AROVs are not addressed with an asset safety perspective. Collision risk is extensively researched in other vehicular industries, such as aviation, automotive, marine, and railways. The method presented should be applicable to other accident scenarios than collision only, and for different types of underwater vehicles, including AUVs and regular ROVs. Three collision risk indicators, namely time to collision, mean time to collision, and mean impact energy are proposed in the article and are validated by comparing with recommended indicator assessment criteria. To collect input data used in the calculation of the proposed indicators, a simulation of AROV path is performed in a case study. The results from the simulation when compared to the established threshold values generate a risk picture of the planned mission path. If data on the RIFs can be collected online, the proposed method can be used for risk assessment and improved situation awareness during operation. Applications of underwater vehicles in the oil and gas industry will continue to grow in the coming decades. With the advent of new subsea operating concepts, continued focus on loss prevention is paramount. Technology transfer from other industries should be the preferred strategy to close technology gaps in design and operation of AROVs for subsea interventions. Development of asset risk management techniques are crucial to maintain high availability of systems, such as AROVs. These risk management techniques are not limited to future oil and gas industry applications. They can also provide learnings, which are applicable to other marine application, such as fisheries, seabed mining, marine biology, archeology and others.
19
Preprint https://doi.org/10.1016/j.jlp.2016.11.002
Acknowledgment This work is funded by the project Next Generation Subsea Inspection, Maintenance and Repair Operations (NextGenIMR), 234108/E30. We would like to acknowledge Prof. Jørgen Amdahl and Mr. Brede Thorkildsen for their valuable discussions regarding the content of this article. We thank the two anonymous reviewers for providing constructive suggestions to improve this article.
Appendix Appendix A: Pseudocode for Vpython program Data: Position of AROV, subsea structure, seabed and 2nd AROV (targets) Result: TTC, impact energy, Mean TTC in each waypoint, mean impact energy in each waypoint, velocity, acceleration Initialize variables; Defining functions; While t < tend (Waypoint 0 to 1, Waypoint 1 to 2, Waypoint 2 to 3, Waypoint 3 to 4) do Update AROV position; Calculate distance to targets, resultant velocity vector, TTC, impact force, acceleration; Calculate mean distance to targets, mean TTC, mean velocity, mean impact energy; End
References Albiez, J., Joyeux, S., Gaudig, C., Hilljegerdes, J., Kroffke, S., Schoo, C., Arnold, S., Mimoso, G., Alcantara, P., Saback, R., Britto, J., Cesar, D., Neves, G., Watanabe, T., Paranhos, P.M., Reis, M., Kirchnery, F., 2015. FlatFish - a compact subsea-resident inspection AUV, in: OCEANS 2015 MTS/IEEE Washington. IEEE, pp. 1–8. Arumugam, S., Jermaine, C., 2006. Closest-Point-of-Approach Join for Moving Object Histories, in: Data Engineering, 2006. ICDE ’06. Proceedings of the 22nd International Conference on. p. 86. doi:10.1109/ICDE.2006.36 Bai, Y., Bai, Q., 2010. Chapter 23 - ROV Intervention and Interface, in: Bai, Y., Bai, Q. (Eds.), Subsea Engineering Handbook. Gulf Professional Publishing, Boston, pp. 763–793. doi:http://dx.doi.org/10.1016/B978-1-85617-689-7.10023-8 Belkhouche, F., 2013. Modeling and Calculating the Collision Risk for Air Vehicles. Vehicular Technology, IEEE Transactions on 62, 2031–2041. doi:10.1109/TVT.2013.2238265 Billingsley, T.B., Kochenderfer, M.J., Chryssanthacopoulos, J.P., 2012. Collision avoidance for general aviation. Aerospace and Electronic Systems Magazine, IEEE 27, 4–12. doi:10.1109/MAES.2012.6328836 Chardard, Y., Copros, T., 2002. Swimmer: final sea demonstration of this innovative hybrid AUV/ROV system, in: Underwater Technology, 2002. Proceedings of the 2002 International Symposium on. pp. 17–23. doi:10.1109/UT.2002.1002371
20
Preprint https://doi.org/10.1016/j.jlp.2016.11.002
Christ, R.D., Wernli R.L., S., 2013. The ROV Manual: A User Guide for Remotely Operated Vehicles: Second Edition, The ROV Manual: A User Guide for Remotely Operated Vehicles: Second Edition. Dai, L., Ehlers, S., Rausand, M., Utne, I.B., 2013. Risk of collision between service vessels and offshore wind turbines. Reliability Engineering & System Safety 109, 18–31. doi:10.1016/j.ress.2012.07.008 DeepOcean, 2014. UHD ROV Specification Sheet [WWW Document]. URL https://deepoceangroup.com/wp-content/uploads/2015/11/53ecbfcb299f9.pdf (accessed 4.7.16). Garcia, C.R., Lehner, A., Strang, T., Rockl, M., 2007. Comparison of Collision Avoidance Systems and Applicability to Rail Transport, in: Telecommunications, 2007. ITST ’07. 7th International Conference on ITS. pp. 1–6. doi:10.1109/ITST.2007.4295927 Germanischer Lloyd Aktiengesellschaft, 2009. Rules for Classification and Construction Ship Technology- Underwater Technology - Unmanned Submersibles (ROV, AUV) and Underwater Working Machines [WWW Document]. URL http://www.gl-group.com/infoServices/rules/pdfs/gl_i5-3_e.pdf (accessed 4.7.16). Gray, P.C.R., Wiedemann, P.M., 1999. Risk management and sustainable development: mutual lessons from approaches to the use of indicators. Journal of Risk Research 2, 201–218. doi:10.1080/136698799376808 Griffiths, G., Millard, N., Rogers, R., 2002. Logistics, Risks and Procedures concerning Autonomous Underwater Vehicles, in: Technology and Applications of Autonomous Underwater Vehicles. pp. 279–293. doi:doi:10.1201/9780203522301.ch16 Hassan, J., Khan, F., 2012. Risk-based asset integrity indicators. Journal of Loss Prevention in the Process Industries 25, 544–554. doi:10.1016/j.jlp.2011.12.011 Hegde, J., Utne, I.B., Schjølberg, I., 2015. Applicability of Current Remotely Operated Vehicle Standards and Guidelines to Autonomous Subsea IMR Operations, in: Volume 7: Ocean Engineering. ASME, p. V007T06A026. doi:10.1115/OMAE2015-41620 HSE, 2006. Developing process safety indicators: A step-by-step guide for chemical and major hazard industries [WWW Document]. URL http://www.hse.gov.uk/pUbns/priced/hsg254.pdf (accessed 4.7.16). ISO 13628-1, 2005. Petroleum and natural gas industries - Design and operation of subsea production systems -- Part 1: General requirements and recommendations [WWW Document]. URL http://www.iso.org/iso/iso_catalogue/catalogue_tc/catalogue_detail.htm?csnumber=36458 (accessed 4.7.16). Jamieson, J., Wilson, L., Arredondo, M., Evans, J., Hamilton, K., Sotzing, C., 2012. Autonomous Inspection Vehicle: A New Dimension in Life of Field Operations, in: OTC-23365-MS. Offshore Technology Conference, p. 8. doi:10.4043/23365-MS Jennings, K., Schulberg, F., 2009. Guidance on developing safety performance indicators. Process Safety Progress 28, 362–366. doi:10.1002/prs.10343 Johansson, B., Siesjä, J., Furuholmen, M., 2010. Seaeye Sabertooth A Hybrid AUV/ROV offshore system, in: OCEANS 2010. pp. 1–3. doi:10.1109/OCEANS.2010.5663842 Khan, F., Abunada, H., John, D., Benmosbah, T., 2009. Development of risk-based process safety indicators. Process Safety Progress 29, NA-NA. doi:10.1002/prs.10354 Kjellèn, U., 2000. Prevention of Accidents Through Experience Feedback. CRC Press. 21
Preprint https://doi.org/10.1016/j.jlp.2016.11.002
Knegtering, B., Pasman, H., 2013. The safety barometer: How safe is my plant today? Is instantaneously measuring safety level utopia or realizable? Journal of Loss Prevention in the Process Industries 26, 821–829. doi:10.1016/j.jlp.2013.02.012 Kuchar, J.E., Drumm, A.C., 2007. The traffic alert and collision avoidance system. Lincoln Laboratory Journal 16, 277. Lefebvre, N., Schjølberg, I., Utne, I.B., 2016. Integration of risk in hierarchical path planning of underwater vehicles, in: Proceedings of 10th IFAC Conference on Control Applications in Marine Systems. Trondheim. Lehner, A., Strang, T., García, C.R., 2008. A reliable surveillance strategy for an autonomous Rail Collision Avoidance System, in: Proceedings of the 15th ITS World Congress, New York, USA. Marani, G., Choi, S.K., Yuh, J., 2009. Underwater autonomous manipulation for intervention missions AUVs. Ocean Engineering 36, 15–23. doi:http://dx.doi.org/10.1016/j.oceaneng.2008.08.007 McLeod, D., 2010. Emerging capabilities for autonomous inspection repair and maintenance, in: OCEANS 2010. pp. 1–4. doi:10.1109/OCEANS.2010.5664441 McLeod, D., and Jacobson, J.R., Tangirala, S., 2012. Autonomous Inspection of Subsea Facilities-Gulf of Mexico Trials, in: OTC-23512-MS. Offshore Technology Conference. doi:10.4043/23512-MS McLeod, D., Jacobson, J., 2011. Autonomous UUV inspection- Revolutionizing undersea inspection, in: OCEANS 2011. pp. 1–4. Minderhoud, M.M., Bovy, P.H.L., 2001. Extended time-to-collision measures for road traffic safety assessment. Accident Analysis & Prevention 33, 89–97. doi:10.1016/S0001-4575(00)00019-1 Morrel, J.S., 1957. Physical Aspects of Collision Avoidance. Aeronautical and Navigational Electronics, IRE Transactions on ANE-4, 75–81. doi:10.1109/TANE3.1957.4201516 Pasman, H., Rogers, W., 2014. How can we use the information provided by process safety performance indicators? Possibilities and limitations. Journal of Loss Prevention in the Process Industries 30, 197–206. doi:10.1016/j.jlp.2013.06.001 Pereira, A.A., Binney, J., Hollinger, G.A., Sukhatme, G.S., 2013. Risk-aware path planning for autonomous underwater vehicles using predictive ocean models. Journal of Field Robotics 30, 741– 762. doi:10.1002/rob.21472 Pereira, A.A., Binney, J., Jones, B.H., Ragan, M., Sukhatme, G.S., 2011. Toward risk aware mission planning for autonomous underwater vehicles, in: IEEE International Conference on Intelligent Robots and Systems. pp. 3147–3153. doi:10.1109/IROS.2011.6048756 Qu, X., Yang, Y., Liu, Z., Jin, S., Weng, J., 2014. Potential crash risks of expressway on-ramps and offramps: A case study in Beijing, China. Safety Science 70, 58–62. doi:10.1016/j.ssci.2014.04.016 Ramberg, R., Rognoe, H., Oekland, O., 2013. Steps to the Subsea Factory. OTC Brasil 29–31. doi:10.4043/24307-MS Saul, D., Tena, I., 2007. BP’s AUV Development program, Long Term Goals - Short Term Wins, in: OCEANS 2007. pp. 1–5. doi:10.1109/OCEANS.2007.4449119 Schjølberg, I., Utne, I.B., 2015. Towards autonomy in ROV operations., in: International Federation of Automatic Control, Navigation, Guidance and Control of Underwater Vehicles. Girona, Spain. Sherwood, B.A., Chabay, R., 2011. Vpython--3d programming for ordinary mortals. Earth 1000, 6e24. 22
Preprint https://doi.org/10.1016/j.jlp.2016.11.002
doi:10.1393/ncc/i2010-10612-3 Simetti, E., Casalino, G., Torelli, S., Sperindé, A., Turetta, A., 2014. Floating Underwater Manipulation: Developed Control Methodology and Experimental Validation within the TRIDENT Project. Journal of Field Robotics 31, 364–385. doi:10.1002/rob.21497 Sonnemans, P.J.M., Körvers, P.M.W., Pasman, H.J., 2010. Accidents in “normal” operation – Can you see them coming? Journal of Loss Prevention in the Process Industries 23, 351–366. doi:10.1016/j.jlp.2010.01.001 Swuste, P., Theunissen, J., Schmitz, P., Reniers, G., Blokland, P., 2016. Process safety indicators, a review of literature. Journal of Loss Prevention in the Process Industries 40, 162–173. doi:http://dx.doi.org/10.1016/j.jlp.2015.12.020 Utne, I.B., Schjølberg, I., 2014. A systematic approach to risk assessment - Focusing on autonomous underwater vehicles and operations in Arctic areas, in: Proceedings of the International Conference on Offshore Mechanics and Arctic Engineering - OMAE. doi:10.1115/OMAE2014-23776 Vinnem, J.E., 2010. Risk indicators for major hazards on offshore installations. Safety Science 48, 770– 787. doi:10.1016/j.ssci.2010.02.015 Vogel, K., 2003. A comparison of headway and time to collision as safety indicators. Accident Analysis & Prevention 35, 427–433. doi:10.1016/S0001-4575(02)00022-2 Zarèa, M., Pognonec, G., Schmidt, C., Schnur, T., Lana, J.L., Boehm, C., Buschmann, M., Mazri, C., Rigaud, E., 2013. First steps in developing an automated aerial surveillance approach. Journal of Risk Research 16, 407–420. doi:10.1080/13669877.2012.729520 Øien, K., 2013. Remote operation in environmentally sensitive areas: Development of early warning indicators. Journal of Risk Research 16, 323–336. doi:10.1080/13669877.2012.729523 Øien, K., 2001. Risk indicators as a tool for risk control. Reliability Engineering & System Safety 74, 129–145. doi:10.1016/S0951-8320(01)00067-9 Øien, K., Utne, I.B., Herrera, I.A., 2011a. Building Safety indicators: Part 1 - Theoretical foundation. Safety Science 49, 148–161. doi:10.1016/j.ssci.2010.05.012 Øien, K., Utne, I.B., Tinmannsvik, R.K., Massaiu, S., 2011b. Building Safety indicators: Part 2 Application, practices and results. Safety Science 49, 162–171. doi:10.1016/j.ssci.2010.05.015
23