Am. Midl. Nat. 164:44–51
Development of Equations Predictive of Size and Condition for Black Bears in Rocky Mountain National Park, Colorado ROGER A. BALDWIN1 Department of Animal and Range Sciences, New Mexico State University, Las Cruces 88003 AND
LOUIS C. BENDER2 United States Geological Survey, New Mexico Cooperative Fish and Wildlife Research Unit, P.O. Box 30003 MSC 4901, Las Cruces 88003 ABSTRACT.—Knowledge of body condition is important in predicting health and performance of large mammal populations. Therefore, we assessed body condition in black bears (Ursus americanus) in Rocky Mountain National Park (RMNP), Colorado, using body mass (BM), percent body fat (BF) and a body condition index (BCI) to: (1) develop a model predictive of BM for bears in RMNP using morphometric measures, (2) compare three models predictive of BM to provide further information on the influence of elevation and more complex models on model accuracy, and (3) assess the relationship between BF and BCI to determine if BF could be estimated from BCI. Our best BM model included only girth (r2 5 0.923) and indicated that mass-morphology relationships were more consistent within specified elevation zones; complexity of models had little influence on model efficiency. We also observed a strong relationship between BF and BCI (r2 5 0.962) indicating that BCI scores can be accurately converted to estimates of BF. This predictive equation should prove useful to black bear managers in situations where BF cannot be estimated using more direct methods.
INTRODUCTION An accurate assessment of body condition is key to understanding fundamental aspects of animal ecology (i.e., habitat use, food habits, reproduction, survival; Hanks, 1981; Rogers, 1987; Gaillard et al., 2000; Bender et al., 2007; Lomas and Bender, 2007). Although body mass (BM) has often been related to black bear (Ursus americanus) demographics and habitat use (Noyce and Garshelis, 1994; Samson and Huot, 1995), it is not a direct measure of body condition (Farley and Robbins, 1994; Gau and Case, 1999) and may be a poor indicator of condition (Cook et al., 2001). More exact measures of body condition that estimate body fat (BF) and muscle reserves (e.g., bioelectrical impedance analysis [BIA], body condition index [BCI]) have proven effective at assessing condition in black bears. For example, the advent of BIA procedures has allowed for rapid (5–15 min; Noyce et al., 2002) and accurate (r2 5 0.96, SEE 5 2.2% [Farley and Robbins, 1994]; r2 5 0.88, SEE 5 3.3% [Hilderbrand et al., 1998]) assessments of BF levels in black bears which can be related to dietary, habitat and demographic information to provide a more accurate interpretation of these factors. However, BIA equipment is costly, requires careful handling, and is sensitive to factors such as body position, stomach content and user training (Farley and Robbins, 1994; Hilderbrand et al., 1998) which may limit the use of this approach in some field settings. 1 Corresponding author present address: U.C. Kearney Agricultural Center, 9240 South Riverbend Avenue, Parlier, California 93648; e-mail:
[email protected] 2 Present address: Department of Extension Animal Sciences and Natural Resources, New Mexico State University, Las Cruces 88003
44
2010
BALDWIN & BENDER: SIZE AND CONDITION PREDICTORS FOR BLACK BEARS
45
The BCI is another effective method for assessing condition in bears and is much less costly, less sensitive to stomach content (though such content will still influence BM values), and requires only basic training (Cattet et al., 2002). BCI values reflect the combined mass of BF and lean muscle tissue of an individual relative to its body size (Cattet et al., 2002). Investigations that assess body condition solely on the amount of BF present on an animal (e.g., Stephenson et al., 1998; Gau and Case, 1999) may underestimate condition as lean BM can be a significant source of energy for bears when BF reserves are low or exhausted (Atkinson et al., 1996; Hilderbrand et al., 2000). However, interpretation of this index is less intuitive than estimated BF levels. A close relationship between these condition indices could allow for rapid and efficient conversion between these estimates while eliminating the need for expensive equipment and specialized training. Although BM is often not the best indicator of condition in large mammals (e.g., Cook et al., 2001), many studies have often used BM as a surrogate for condition in bears (e.g., Rogers, 1987; Samson and Huot, 1995). Thus, knowledge of BM is often useful for comparisons with previous studies. However, BM can be difficult to obtain in a field setting (Cattet et al., 1997). Equations that predict BM from simple body measurements have been developed for many bear populations (e.g., Payne, 1976; Swenson et al., 1987; Cattet, 1990) but vary substantially across populations (Cattet et al., 1997). Swenson et al. (1987) provided evidence that predictions might be improved by relating equations across similar elevational zones, while Cattet (1990) suggested that an increase in the number of variables representative of size and BM would better describe the relationship between morphological measurements and BM. Because accurate measures of BM are needed to estimate condition in black bears, and given the difficulty in physically weighing bears in field settings, further research is needed to better describe and define the variability observed between morphometric measurements and BM across black bear populations. Therefore, our objectives were to: (1) derive local equations to predict BM of black bears in Rocky Mountain National Park, Colorado (RMNP), (2) compare predicted BM to predictions from models built from other populations to determine relationships between estimated BM, elevational zones and model parameters, and (3) derive equations predictive of BF levels from BCI scores to aid interpretation. STUDY AREA Rocky Mountain National Park is a 1080-km2 biosphere reserve located in the Rocky Mountain Front Range of northcentral Colorado. Topography in RMNP was shaped by glaciations and consisted of high mountainous peaks interspersed with small subalpine meadows, lakes, streams, glaciers and tundra at higher elevations. Elevations range from 2400–4345 m. The continental divide bisects RMNP, creating different climatic patterns and vegetation types to the east and west. Eastern RMNP is drier, with precipitation averaging 35.1 cm in the town of Estes Park. Western RMNP is more mesic, with precipitation averaging 50.8 cm in the town of Grand Lake. Seventy-five percent of precipitation typically falls from Apr. to Sept. In Estes Park, mean daily high temperatures range from 7.2 C in Feb. to 27.8 C in Jul., whereas in Grand Lake, mean daily high temperatures range from 0.0 C in Dec. and Jan. to 23.9 C in Jul. Vegetation in RMNP consists of .700 plant species. Community composition varies with more productive communities found on western slopes and at higher elevations (Beidleman et al., 2000). Montane forests and valleys west of the continental divide are comprised primarily of lodgepole pine (Pinus contorta) and aspen (Populus tremuloides) interspersed with bunchgrass and sedge-dominated herbaceous meadows. Montane forests on the
46
THE AMERICAN MIDLAND NATURALIST
164(1)
eastern slope included the same species although drier sites are often dominated by ponderosa pine (Pinus ponderosa) and Douglas-fir (Pseudotsuga menziesii). Subalpine habitats vary less between western and eastern slopes and are dominated by Engelmann spruce (Picea englemannii) and subalpine fir (Abies bifolia), with limber pine (Pinus flexilis) occasionally present. Elevations above timberline (,3500 m) are dominated by tundra and bare rock. Below treeline, wetland and riparian areas are dominated by dense stands of spruce-fir and aspen in forested areas (Salas et al., 2005). METHODS We captured black bears using modified Aldrich foot snares, culvert traps and wire-cage traps from 1984–1991 and 2003–2006; we also visited den sites of collared black bears from 2003–2006. We immobilized black bears with a 5:1 mixture of ketamine hydrochloride (,7.4 mg/kg mass) and xylazine hydrochloride (,1.3 mg/kg mass) (Clark and Jessup, 1992). Once immobilized, we fit individuals with radiocollars and classed bears as males and females. We also collected morphometric data including dorsal contour length (DCL), straight-line body length (SLBL), girth and BM. For DCL (cm), we measured two lengths following the contour of the backbone: (1) from the tip of the nose to the base of the tail, and (2) from the tip of the nose to the last tail vertebrae. We used measurements to the base of the tail in BF estimation (Farley and Robbins, 1994), while those to the tip of the last tail vertebrae were used for BM estimation. We recorded SLBL (cm) as the measure of the straight line distance from the tip of the nose to the end of the last tail vertebra as determined with a measuring tape suspended above the individual while in sternal recumbency (Cattet et al., 2002). For girth (cm), we measured the circumference of the chest immediately behind the front legs with lungs in deflated position (Beck, 1991). We weighed black bears using a spring scale to the nearest kg. We regressed girth and DCL measurements to known measures of BM to allow prediction of unknown BM (Zar, 1999); we did not include SLBL in this modeling approach as it was not measured for the 1984–1991 period. We initially separated data by sex for BM estimation given occasional differences between males and females in modeled relationships (Swenson et al., 1987). We plotted regression residuals to determine if outliers were present and selected best models based on r2 values (Zar, 1999). We tested for differences in model slope and intercept for males and females; we combined models if they did not differ (Zar, 1999). We then compared differences (absolute values) between known measures of BM of black bears in RMNP to (1) estimated BM from a model derived for RMNP, (2) estimated BM using a model derived from a high elevation population in Montana (Swenson et al., 1987), and (3) estimated BM derived from a predictive model developed in Alberta, Canada (Cattet, 1990). Because we wanted to test for differences in known and estimated black bear BM in RMNP across these three models, we needed to ensure that tested bears were independent from bears included in model construction. Therefore, we developed a separate BM estimation model for RMNP that included only girth by randomly selecting 23 bears (,60% of sampled bears). We then used this model to estimate BM for the remaining 16 bears (,40% of sampled bears) and compared differences in known and estimated BM for these 16 bears to differences in known and estimated measures of BM for RMNP bears using the Montana and Alberta models. For the study in Montana, we used the equation (BM 5 0.00292 | girth2.255) developed from the Absaroka-Beartooth Mountain complex given that elevation at this site (max. elevation 5 3270 m) was closest to elevations in RMNP. Models constructed in Alberta included girth, SLBL and age (y) of individual (BM 5 e28.16 | [girth1.39] | [straight-line body length1.21] | [age0.08]). Age of bears was determined by
2010
BALDWIN & BENDER: SIZE AND CONDITION PREDICTORS FOR BLACK BEARS
47
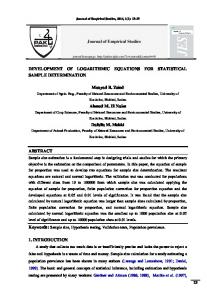
counting cementum annuli in the first premolar (Willey, 1974) or through known age (bears marked since cubs). However, not all bears had premolars pulled or were of a known age. Therefore, we had a smaller subset (n 5 25) of bears to include in this model. Additionally, because SLBL was not measured from 1984–1991, we regressed DCL (including tail measurement) to known SLBL measurements from 2003–2006 to allow estimation of SLBL for black bears from 1984–1991. Finally, we compared absolute differences between known BM and estimated BM from the three models using one-way ANOVA with LSD multiple comparisons tests with an experiment-wise error rate of a 5 0.05 (Zar, 1999). These comparisons allowed us to ascertain the similarity between estimates for a similar elevational zone (Montana; Swenson et al., 1987), and to assess whether models that included additional metrics collected from black bears across multiple localities could effectively predict BM in RMNP (Alberta; Cattet, 1990). We also used BIA to assess BF in black bears during capture events and den checks. This technique measured the resistance of an electrical current that was passed through the bear and related this resistance measurement to DCL (excluding tail measurement) and BM to estimate BF (Farley and Robbins, 1994; Hilderbrand et al., 1998). To determine resistance, we used a Quantum II (RJL Systems, Detroit, Michigan, USA) analyzer that was comparable to the Model 101A used in other bear studies (e.g., Farley and Robbins, 1994; Hilderbrand et al., 1998, 2000). For resistance measurements, we placed bears in a sternally recumbent position with hind legs extended backward and front legs extended forward parallel to the length of the body (Gau and Case, 1999). We placed bears on a plastic tarp to eliminate conductivity problems associated with ground moisture (Farley and Robbins, 1994). We positioned electrodes in a snout to tail configuration with alligator clamps attached to the lips and needle electrodes inserted 3 cm to either side of the base of the tail (Farley and Robbins, 1994). We took measurements multiple times to verify readings. Finally, we obtained BCI scores for black bears using SLBL and BM (Cattet et al., 2002); only bears with SLBL directly measured were included in BCI estimates. BCI values are strongly correlated to true body condition (r 5 1.0, P , 0.001; Cattet et al., 2002) and reflect the combined mass of BF and skeletal muscle of an individual relative to its body size. We regressed BCI scores and BF to model the relationship between these measures to predict BF for bears with only BCI scores; we assessed residual plots for potential outliers (Zar, 1999). RESULTS We recorded BM, girth and DCL for 23 black bears (11 female, 12 male) from 1984–1991 and 16 black bears (13 female, 3 male) from 2003–2006. The best predictive equation for black bear BM in RMNP included only girth for both males (F1,13 5 325, P , 0.001, r2 5 0.962; b 5 1.720, SE 5 0.095) and females (F1,22 5 304, P , 0.001, r2 5 0.933; b 5 1.386, SE 5 0.079). However, neither the slope (t35 5 0.29, P 5 0.777) nor intercept (t36 5 0.15, P 5 0.882) of these models differed, so males and females were subsequently combined (F1,37 5 444, P , 0.001, r2 5 0.923; b 5 1.439, SE 5 0.068) (Fig. 1). The predictive model developed for comparison to the Montana and Alberta models included only girth and was similar to the combined model (F1,21 5 295, P , 0.001, r2 5 0.934; b 5 1.577, SE 5 0.092). We also were able to predict SLBL from DCL (F1,16 5 150, P , 0.001, r2 5 0.903; SLBL 5 17.304 + (0.774 | DCL [SE 5 0.063]) for use in predictive models of BM derived for Alberta bears (Cattet, 1990). We observed a difference in predicted BM among models (F2,77 5 4.0, P 5 0.023). Absolute differences in predicted BM did not vary for RMNP and Montana populations (P 5 0.374), but differed from equations derived in Alberta (RMNP: P 5 0.035, Montana: P 5 0.031; Table 1).
48
THE AMERICAN MIDLAND NATURALIST
164(1)
FIG. 1.—Relationship between girth and body mass of black bears in Rocky Mountain National Park, Colorado: mass 5 253.155 (SE 5 5.662) + 1.439 (SE 5 0.068) | girth; r2 5 0.923. Also shown are 95% confidence bands
Additionally, we were able to relate BCI to BF from six capture events and eight den checks. Percent body fat was strongly related to BCI (F1, 12 5 141, P , 0.001, r2 5 0.962) which allowed for accurate prediction of estimated BF from BCI scores: BF 5 7.070 + (8.915 | BCI [SE 5 1.250]) + (1.823 | BCI2 [SE 5 0.649]) (Fig. 2). DISCUSSION Substantial variability often exists in equations that predict BM of black bears (see Swenson et al., 1987 for review). In RMNP, girth alone proved effective in predicting BM of black bears (Fig. 1). This was not surprising, as girth is the measurement most commonly associated with growth in black bears (Payne, 1976; Alt, 1980; Swenson et al., 1987) although models and model fit vary across populations. Comparing models of black bear BM across study sites indicated that BM of black bears in RMNP differed from predictions of the Alberta model (Cattet, 1990), while estimates from a model developed in Montana (Swenson et al., 1987) were more representative of BM in RMNP (Table 1). These findings support Swenson et al. (1987) in that elevational zones likely substantially influence massmorphology relationships for black bears. Therefore, if predictive models of BM are not available for a black bear population, we suggest using models derived from a similar elevational zone. In contrast, our results do not support the hypothesis that the use of a greater number of factors may explain much of the variability in morphology-mass comparisons across broad geographical regions (e.g., Cattet, 1990) (Table 1), at least not with the variables included in the Alberta model. However, we were not able to account for the added variability of including estimated SLBL values into the Alberta model given that the SE’s for model
BALDWIN & BENDER: SIZE AND CONDITION PREDICTORS FOR BLACK BEARS
2010
49
TABLE 1.—Mean absolute value difference between actual body mass (kg) and estimated values derived from morphological measurements (cm) using different predictive equations for black bears in Rocky Mountain National Park (RMNP), Colorado
b
RMNP Montanac Albertad
Meana
Standard error
Sample size
5.3A 6.5A 9.5B
1.0 0.7 1.3
16 39 25
a Significant differences (LSD multiple comparisons test, P , 0.05) are illustrated by different letters following mean values b This study: mass 5 262.643 + (1.577 | girth) c From Swenson et al. (1987): mass 5 0.00292 | girth2.255 d From Cattet (1990): mass 5 e28.16 | (girth1.39) | (straight-line body length1.21) | (age0.08)
parameters were not provided in Cattet (1990). It is possible that incorporating this added variability might have resulted in predictions similar to the RMNP and Montana models. However, BM predicted by the Alberta model was less than actual BM for all bears except one. It is highly unlikely that this under estimation is due to the use of SLBL estimates, particularly given the relatively high r2 value (0.9) associated with the SLBL-estimation model. Therefore, the difference in predicted BM between the RMNP-Alberta and RMNPMontana models does appear to be real. Reasons for this are unclear, but could be due to
FIG. 2.—Relationship between body condition index (BCI) and percent body fat (%BF) of black bears in Rocky Mountain National Park, Colorado: BF 5 7.070 + (8.915 | BCI [SE 5 1.250]) + (1.823 | BCI2 [SE 5 0.649]), r2 5 0.962. Also shown are 95% confidence (solid lines) and prediction (dashed lines) bands
50
THE AMERICAN MIDLAND NATURALIST
164(1)
differences in the mass-morphology relationship often present across differing elevational and latitudinal zones (e.g., Bergmann’s rule). Although BM has often been used as a surrogate for body condition, actual estimates of condition are more appropriate, though more difficult to collect (Farley and Robbins, 1994; Gau and Case, 1999). Body condition at the peak of seasonal accrual is fundamental to virtually every survival and reproductive parameter of large mammals (Hanks, 1981; Rogers, 1987; Gaillard et al., 2000; Bender et al., 2007; Lomas and Bender, 2007) and provides similar relationships for black bears. In particular, knowledge of body mass composition (i.e., BF and lean muscle mass) is more intuitive and preferred in some situations. For example, studies have examined changes in body composition between lactating and non-lactating black bears during hibernation to assess daily energy requirements and sources of these energy components (i.e., BF or protein; Farley and Robbins, 1995; Harlow et al., 2002). This comparison would not be possible using just BM or BCI scores and underscores the need for rapid and accurate conversion of BCI scores to BF. Additionally, many historic datasets contain the needed morphological information required to estimate BCI, but would not have the needed resistance measurements required to estimate BF. Conversion of BCI scores to BF would allow for comparisons in body composition between studies from different time periods. Results from our model (Fig. 2) indicate a strong relationship between estimates of BF and BCI and should provide a useful tool for future research and management projects that require estimates of body composition. Acknowledgments.—Research was funded by Rocky Mountain National Park and the United States Geological Survey. The New Mexico State University, Agricultural Experiment Station provided additional financial assistance. We extend thanks to L. Zeigenfuss for providing historic data and to L. Adams and M. Cattet for reviewing earlier drafts of this manuscript. E. Dreyer, S. Eckert, S. Graham, H. Halbritter, B. Hoenes, B. Keller, C. Letter, L. Polson, M. Polson and many other RMNP volunteers provided invaluable field assistance.
LITERATURE CITED ALT, G. L. 1980. Rate of growth and size of Pennsylvania black bears. Pa. Game News, 51:7–17. ATKINSON, S. N., R. A. NELSON AND M. A. RAMSAY. 1996. Changes in the body composition of fasting polar bears (Ursus maritimus): the effect of relative fatness on protein conservation. Physiol. Zool., 69:304–306. BECK, T. D. I. 1991. Black bears of west-central Colorado. Technical Publication Number 39, Colorado Division of Wildlife, Ft. Collins, Colorado. BEIDLEMAN, L. H., R. G. BEIDLEMAN AND B. E. WILLARD. 2000. Plants of Rocky Mountain National Park. Falcon Publishing, Helena, Montana. BENDER, L. C., L. A. LOMAS AND J. BROWNING. 2007. Condition, survival, and cause-specific mortality of mule deer in northcentral New Mexico. J. Wildl. Manage., 71:1118–1124. CATTET, M. 1990. Predicting nutritional condition in black bears and polar bears on the basis of morphological and physiological measurements. Can. J. Zool., 68:32–39. CATTET, M. R. L., S. N. ATKINSON, S. C. POLISCHUK AND M. A. RAMSAY. 1997. Predicting body mass in polar bears: is morphometry useful? J. Wildl. Manage., 61:1083–1090. ———, N. A. CAULKETT, M. E. OBBARD AND G. B. STENHOUSE. 2002. A body-condition index for ursids. Can. J. Zool., 80:1156–1161. CLARK, R. K. AND D. A. JESSUP. 1992. Wildlife restraint series. International Wildlife Veterinary Services, Salinas, California. COOK, R. C., J. G. COOK, D. L. MURRAY, P. ZAGER, B. K. JOHNSON AND M. W. GRATSON. 2001. Nutritional condition models for elk: which are the most sensitive, accurate, and precise? J. Wildl. Manage., 65:988–997.
2010
BALDWIN & BENDER: SIZE AND CONDITION PREDICTORS FOR BLACK BEARS
51
FARLEY, S. D. AND C. T. ROBBINS. 1994. Development of two methods to estimate body composition of bears. Can. J. Zool., 72:220–226. ——— AND ———. 1995. Lactation, hibernation, and mass dynamics of American black bears and grizzly bears. Can. J. Zool., 73:2216–2222. GAILLARD, J.-M., M. FESTA-BIANCHET, N. G. YOCCOZ, A. LOISON AND C. TOI¨GO. 2000. Temporal variation in fitness components and population dynamics of large herbivores. Annu. Rev. Ecol. Syst., 31:367–393. GAU, R. J. AND R. CASE. 1999. Evaluating nutritional condition of grizzly bears via select blood parameters. J. Wildl. Manage., 63:286–291. HANKS, J. 1981. Characterization of population condition, p. 47–73. In: Fowler, C. W. and T. D. Smith (eds.). Dynamics of large mammal populations. The Blackburn Press, Caldwell, New Jersey. HARLOW, H. J., T. LOHUIS, R. G. GROGAN AND T. D. I. BECK. 2002. Body mass and lipid changes by hibernating reproductive and nonreproductive black bears (Ursus americanus). J. Mammal., 83:1020–1025. HILDERBRAND, G. V., S. D. FARLEY AND C. T. ROBBINS. 1998. Predicting body condition of bears via two field methods. J. Wildl. Manage., 62:406–409. ———, C. C. SCHWARTZ, C. T. ROBBINS AND T. A. HANLEY. 2000. Effect of hibernation and reproductive status on body mass and condition of coastal brown bears. J. Wildl. Manage., 64:178–183. LOMAS, L. A. AND L. C. BENDER. 2007. Survival and cause-specific mortality of neonatal mule deer fawns, north-central New Mexico. J. Wildl. Manage., 71:884–894. NOYCE, K. V. AND D. L. GARSHELIS. 1994. Body size and blood characteristics as indicators of condition and reproductive performance in black bears. Int. Conf. Bear Res. and Manage., 9:481–496. ———, P. L. COY AND D. L. GARSHELIS. 2002. Bone prominence and skin-fold thickness as predictors of body fat and reproduction in American black bears. Ursus, 13:275–284. PAYNE, N. F. 1976. Estimating live weight of black bears from chest girth measurements. J. Wildl. Manage., 40:167–169. ROGERS, L. L. 1987. Effects of food supply and kinship on social behavior, movements, and population growth of black bears in northwestern Minnesota. Wildl. Monogr., 97:72. SALAS, D., J. STEVENS AND K. SCHULZ. 2005. Rocky Mountain National Park, Colorado 2001–2005 vegetation classification and mapping. Final Report, Technical Memorandum 8260-05-02, Remote Sensing and GIS Group, Technical Service Center, Bureau of Reclamation, Denver, Colorado. SAMSON, C. AND J. HUOT. 1995. Reproductive biology of female black bears in relation to body mass in early winter. J. Mammal., 76:68–77. STEPHENSON, T. R., K. J. HUNDERTMARK, C. C. SCHWARTZ AND V. VAN BALLENBERGHE. 1998. Predicting body fat and body mass in moose with ultrasonography. Can. J. Zool., 76:717–722. SWENSON, J. E., W. F. KASWORM, S. T. STEWART, C. A. SIMMONS AND K. AUNE. 1987. Interpopulation applicability of equations to predict live weight in black bears. Int. Conf. Bear Res. and Manage., 7:359–362. WILLEY, C. H. 1974. Aging black bears from first premolar tooth sections. J. Wildl. Manage., 38:97–100. ZAR, J. H. 1999. Biostatistical analysis. 4th ed. Prentice Hall, Upper Saddle River, New Jersey. SUBMITTED 27 JULY 2009
ACCEPTED 24 SEPTEMBER 2009