Latin American Journal of Pharmacy (fonnerly Acta Farmaceutica Bonaerense)
Short Communication
Received: January 6, 2010 Accepted: January 21,2010
Lat. Am. J. Pharm. 29 (6): 1029-34 (2010)
Development of In Vitro-In vivo Correlation for Nimesulide Loaded Ethylcellulose Micropartic1es Shujaat A. KHAN I, Mahmood AHMAD I, Ghulam MURTAZA 1*, Hanis M. SHOAIB 2, Muhammad N. AAMIR 1, Rozina KOUSAR 1, Fatima RASOOL I &Asadullah MADNI 1 1Faculty of Pharmacy & Alternative Medicinel the Islamia University of Bahawalpur, Bahawalpur 63100, Pakistan. 2 Faculty of Pharmacy, University of Karachi, Karachi, Pakistan.
SUMMARY. A predictive. in vitro-in vivo correlation (IVIVC) can empower in vitro dissolution as a surrogate for in vivo bioavailability I bioequivalence. IVIVCs can decrease regulatory burden by decreasing the number of biostudies required in support of a drug product. The present study concerns the establishment of in vitro-in vivo correlation for three different sustained release nimesulide loaded ethylcellulose microparticulate formulations (M1, M2 and M3) and conventional tablet (100 mg Nimaran@-Novartis, Pakistan). In vitro dissolution study was conducted in phosphate buffer pH 6.8 stirred at 50 rpm and 37 :t 0.5 .C. A validated HPLC method was adopted to conduct bioavailability studies in young healthy human volunteers. Ultimately IVIVC of prepared microparticles and conventional tablet was established using Wagner-Nelson method. M1 and M2 formulations and Nimaran@ 0.9124, 0.8728, respectively) as compared to M3 (R2 0.9449).
=
mathematical drugs.
The
good linear
IVIVC
substantiate
the
results
(R2
= 0.9220,
success
of this
simulation study encourage researchers to conduct biowaiver studies for other BCS class II
INTRODUCTION Food and Drug Administration (FDA) Authority has developed a regulatOlY guidance for both immediate and modified release dosage forms to reduce the requirement of bioavailability studies as part of the formulation design and optimization. Increased development of modified release dosage forms necessitates investigating the broader aspects of in vitro-in vivo correlation (IVIVC) 1. According to the Biopharmaceutical Classification System (BCS), a drug substance is classified on the basis of its aqueous solubility and intestinal permeability, and four drug classes are defined, i.e. high solubility/high permeability (Class I), low solubility/high permeability (Class II), high solubility/low permeability (Class III), low solubility/low permeability (Class IV) 2, Class II compounds comprise relatively water insoluble drugs (i.e. Solubility s 0.1 mg/mL) which are well absorbed from the gastrointestinal tract (i.e. large permeability). Drug dissoluKEY WORDS: Dissolution
*
exhibited
studies, Bioavailability,
tion is usually the rate-limiting step in drug absorption. Commonly, drugs in this class have variable absorption because of the formulation parameters and in vivo variables (such as food intake) that can affect the dissolution profiles 2, Diverse formulation techniques can be applied to compensate for the insolubility of these drugs and the consequent slow dissolution rate such as formulation of the amorphous solid form, nanoparticles or microparticles, addition of surfactants, salt formation, and complexation, By such techniques, the formulator tries to 'move' the drugs from class II to class I without changing the intrinsic ability of the drug molecules to permeate biomembranes. Examples of drugs in class II include nimesulide, carbamazepine, cinnarizine, and glibenclamide 3. Microparticles are reliable means of delivering drug in desired concentration at the site of interest without unwanted effects. It has added advantages over the conventional delivery system which include increased bioavailability,
Internal prediction
error, IVIVC, Nimesulide.
Author to whom correspondence should be addressed. E-mail:
[email protected]
ISSN 0326-2383
1029
KHAN SA., AHMAD M., MURTAZA G., SHOAffi H.M., AAMIR M.N., KOUSAR R., RASOOL F. & MADNI A.
subject variability, drug induced toxicity and side effect 4,5. Nimesulide (4-nitro-2-phenoxy-methane sulfonanilide) is a non-steroidal anti-inflammatory drug (NSAID), but differs structurally from most members of this class in that it contains a sulfonanilide group 6. It has good anti-inflammatory, analgesic and antipyretic activity, and is well tolerated by patients as demonstrated in numerous clinical trials 7. The possible mechanisms of action include reduction of prostaglandin synthesis through inhibition of cyclo-oxygenase-2 (COX2) activity, reduced generation of super oxide anions, inhibition of platelet-activation factor (PAF) synthesis, inhibition of monochloroamine generation, and scavenging of hypochlorous acid 8. This compound has recently attracted interest because it exhibits significant inhibitory selectivity towards cyclooxygenase-2 (COX-2) versus COX-1 which may explain its lower incidence of gastric side effects 9. Nimesulide attains peak serum concentrations of 1.98 to 9.85 mg/L within 1.22 to 3.17 hours when given orally and extensively bound to plasma proteins (99%) having half-life 1.56 to 4.95 hr which requires frequent dosing to maintain plasma concentration 10. The present study is concerned with the establishment of mathematical IVIVC for three different sustained release formulations consisting of Nimesulide-ethylcellulose microparticles and conventional tablet using Wagner-Nelson method. Before this, no study is found in literature concerning IVIVC for Nimesulide formulations. So this study may be considered as a novel one and also a representative for class II drugs. MATERIALS AND METHODS Materials Nimesulide B.P. was received as gift sample from Pharm-Evo Pharma (Pvt.) Ltd. Karachi, Pakistan. Ethyl cellulose was purchased from Sigma, USA. Other chemicals such .as cyclohexane, liquid paraffin (heavy and light), n-hexane, potassium dihydrogen phosphate, methanol and HPLC grade acetonitrile were purchased from Merck, Germany.
tively and thus were fast, medium and slow release formulations as required by FDA for the establishment of IVlVC 11. In vitro Drug Release Kinetics In vitro drug release of various microparticles was determined using USP apparatus II (Pharma Test, Germany) in 900 ml of phosphate buffer (pH 6.8). 5 ml of sample was collected at 0, 0.25, 0.5, 1.0, 1.5, 2.0, 3.0, 4.0, 6.0, 8.0, 10 and 12 hours with an automated sample collector after filtering through 10 pm Sinter filters. All samples were analyzed as such at 404 nm using a UV-spectrophotometer (Shimadzu 1601, Japan) and the percentage drug release at different sampling intervals was calculated. Similarity factor 12 was used to match the difference of dissolution
profile
11,12. I'
12= 50 log {[1+ (lIP)
2: (Rt-TJ i-J
2)-1/2 x lOa}
[1]
Bioavailability Experimental Design and Procedure Bioavailability studies of nimesulide in healthy human subjects with their written consent were carried out. Twenty four healthy human subjects were scheduled to participate in the study and were selected according to the FDA and ICH (International Conference for Harmonization) inclusion and exclusion criteria for the selection of healthy human. They were divided into 4 groups (A, B, C and D), each consisting of 6 subjects. In first sampling period, group A, Band C received M1, M2 and M3 formulations, respectively, and group D received conventional tablet (Nimaran@-Novartis, Pakistan) with water after a full night fast while complete sampling schedule is given in Table 1. This single dose drug regimen was administered on an empty stomach; the subjects were housed at the study centre one hour before the start of sampling. Each subject was instructed to fast overnight prior to the treatment visit. The subjects were allowed to drink water ad libitum. The standardized breakfast and lunch was given to the subjects according to the study proFonnulations
Period-l
Period-2
Period-3
Group-D Group-A Group-B Group-C
Group-C Group-D Group-A Group-B
Group-B Group-C Group-D Group-A
Period-4
Preparation of Microparticles This study involved 4 formulations named as M1, M2, M3 and Nimaran@-Novartis, Pakistan. Each formulation contained 100 mg nimesulide. M1, M2 and M3 formulations contained drug and polymer in ratio of 1:1, 1:2 and 1:3, respec-
1030
Ml M2 M3 Nimaran@
Group-A Group-B Group-C Group-D
Table 1. In vivo sampling schedule.
Latin American
tocols. One week of wash out period was given for the next sampling treatment. This study (2005-Ph.D/02-IUB) was conducted in accordance with the Helsinki Declaration regarding the use of human volunteers in research and was approved by the Board of Advance Studies and Research, the Islamia University of Bahawalpur (Institutional Ethical Committee) on June 25, 2005. Sample Collection A 20-gauge venous catheter was inserted into a fore arm of each subject for the collection of blood samples and 13 blood samples each of 3 ml blood were collected through the syringe before dosing (zero time) and at 0, 0.5, 1, 1.5, 2, 2.5, 3, 4, 6, 8, 10, 12, 18 and 24 h after dosing of the nimesulide formulation. Blood samples were centrifuged at 4000 rpm for 10 min. The plasma was harvested and frozen at -20°C until assay was performed.
Chromatographic conditions
Journal
of Pharmacy
- 29 (6) - 2010
drug. Percent dissolved values were taken from in vitro release data and percent absorbed drug was determined by the Wagner-Nelson method using the following equation 14:
where Fa is the fraction of drug absorbed, "Ct" is the drug plasma concentration at time "t", "ke" is the overall elimination rate constant, "AUCo_t" and "AUCo_oo"are areas under the curve between time "0" and time 't' and between time "0" and infinity, respectively. Internal Prediction Error IVIVC model predictability was assessed by percent Cmaxprediction error. Percent prediction error (% PE) = {(Cmax obs - Cmax prcd) / C max obs X 100
[3]
Based on the FDA guidance, the correlation is valid (predictive) if the percent prediction error across formulations is :>
.. E 1.5 '2 '"
E ..co ii:
6
12
18
Time (Hrs) Figure
2. In vivo data of different
formulations.
24
Latin American
Parameters
Journal
of Pharmacy
- 29 (6) - 2010
Ml
M2
M3
Nimaran
3.2152 4.00
3.0675 4.00
2.9083 4.00
3.981
Tmax(h) AUCO-a (J.lg.h/ml)
28.1119
25.6621
24.4772
27.1512
Vd (UKg) R2
44.3911
45.6723
46.6255
30.7357
0.9220 7.6%
O. 9124 7.8%
O. 8728
0.9449
9.9%
6.1 %
Cmax(J.lg/ml)
Prediction error
3.00
Table 3. Data of in vivo bioavailability parameters and the values of regression co-efficient (R2) of IVIVC for all formulations.
-
100
-
75
'a CII
11
2: 0
1/1 1/1
is CII :::I .. C
75
0
50
50 'a CII
25
2
c
25
n 5
10
Drug absorbed
-C
1\'12
1001
100,
15
0
20
0
5
t% )
10
Drug absorbed
-
M3
C
75
'a
1001
15
20
(%)
Nimaran@
75
11
2: 0
1/1 1/1
Ii!
50
1/1
50
is CII ..:::I 25
is CII :::I 25 c
0
0
..
c
0
5
10
15
20
Drug absorbed (%)
0
5
10
15
20
Drug absorbed (%
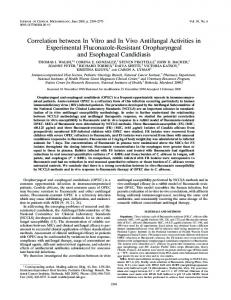
Figure 3. IVIVCplots involving drug dissolved (%) versusdrug absorbed (%) for all formulations. concentration with time. The developed formulations showed lower Cmax(but within therapeu-
tic range) and higher Tmax values than that of Nimaran@ (Figure 2). Lower Cmaxfor formulations Ml, M2 and M3 indicate avoidance of the risk of exceeding the maximum safe concentra-
tion. Higher Tmax for formulations Ml, M2 and M3 is indicative of drug release occurring at a slower rate than from Nimaran@. For the establishment of IVIVC level A, drug dissolved (%) were plotted against drug absorbed (%) followed by the regression analysis
of IVIVC plots (Fig. 3). The regression coefficients are presented in Table 3. To analyze the predictability of established IVIVCs, internal prediction error was also calculated. The values of prediction error (%) are mentioned in Table 3. Based on this data, regression coefficients of Ml, M2 and Nimaran@ are significantly (p < 0.05) similar to each other are also significantly (p > 0.05) similar to 1. The regression coefficients of M3 is significantly (p < 5) similar to that of Ml, M2 and Nimaran@ but significantly (p > 0.05) dissimilar to 1. Its reason may be sup-
1033
KHAN SA, AHMAD M., MURTAZA G., SHOAIB H.M., AAMIR M.N., KOUSAR R., RASOOL F. & MADNI A.
posed that higher concentration of ethylcellulose might behave differently in phosphate buffer pH 6.8 and gastro-intestinal physiological conditions. Therefore, next study is designed to conduct in vitro dissolution in intestinal fluids to explore this variation. Moreover, IVIVCs were evaluated by calculating their respective internal prediction error from Cmax data. The prediction error was less than 10 (Table 3) for all formulation which verify goodness of worth of this study. CONCLUSION It can be concluded from the results that there is a good correlation between in vitro and in vivo performance of nimesulide microencapsulated into ethylcellulose matrix. However, this relationship is stronger in case of M1 and M2 as compared to M3. This study can be used as an alternative of in vivo bioavailability or bioequivalence studies of nimesulide and can also be employed for optimization of formulation parameters and post-approval changes. This simulation study may encourage researchers for the conductance of biowaiver studies for other BCS class II drugs. Acknowledgments. The authors would like to thank the Pharm-Evo Pharma (Pvt) Ltd. Karachi Pakistan for providing a gift sample of Nimesulide active and Higher Education Commission of Pakistan for providing financial support for research. REFERENCES 1. U.S. Department of Health and Human Services 0997. Guidance for industrial. Extended
1034
release oral dosage forms: Development, evaluation and application of in-vitro/in vivo correlations. Food and Drug Administration, Center for Drug Evaluation and Research (CDER). Rockville, MD. 2. Amidon, G.L., H. Lennerna's & V.P. Shah (995) Phann. Res. 12: 413-20. 3. Horter, D. & ].B. Dressman (2001) Adv. Drug Delivery Rev. 46: 75-87. 4. Bajaj, A. & M. Desai (2006) Phann. Times 38: 12-6. 5. Jose, G. R. & P. Kinam (2004) Drug Delivery Technol. 12: 1-7. 6. Rao, R.N., S. Meena & A.R. Rao (2005) J. Phann. Biomed. Anal. 39: 349-63. 7. Hull, M.L., A. Prentice, D.Y. Wang, R.P. Butt, S.C. Phillips, S.K. Smith & D.S. Charnock-Jones (2005) Human Reprod. 20: 350-8. 8. Banu, S.K.,]. Lee, V.O. Speights Jr., A. Starzinski-Powitz & J.A. Arosh (2009) Mol. Endocrinol. 23: 1291-305. 9. Candelario-Jalil, E., N.H. Mhadu, A. GonzalezFalcon, M. Garcia-Cabrera, E. Munoz, O. Sonia Leon & B.L Fiebich (2005) I Neuroin:flam. 2: 3-14. 10. Singla, A.K., M. Chawla & A. Singh (2000) I Phann. Phannacol. 52: 467-86. 11. Khan, S.A., M. Ahmad, G. Murtaza, M.N. Aamir, F. Rasool & M. Akhtar (2010) Lat. Am. I Phann. 29 (in press). 12. Moore, ].W. & H.H. Flanner (996) Phann. Tech. 20: 64-74. 13. Ptacek, P., J. Macek &]. Klima (2001) I Chromatogr. B 758: 183-8. 14. Li, X., W. Pan, S. Nie & L. Wu (2004) I Control. ReI. 96: 359-67. 15. Murtaza, G., M. Ahmad & N. Akhtar (2009) Bull. Chern. Soc. Ethiop. 23: 1-16.