RESEARCH COMMUNICATIONS 5. Sourabh, P., Thakur, J., Uniyal, P. L. and Pandey, A. K., Biology of Lilium polyphyllum – a threatened medicinal plant. Med. Plants, 2015, 7(2), 158–166. 6. Samant, S. S., Flora of the central and south eastern parts of the Pithoragarh district. Ph D thesis, Kumaun University, Nainital, 1987. 7. Jain, S. K., Dictionary of Indian Folk Medicine and Ethnobotany, Deep Publications, New Delhi, 1991. 8. Anon., Himalaya’s herbs and minerals, 2007; www.himalayahealthcare.com 9. Javed, N. K., Ansari, S. H., Mohammad, A. and Nazish, I., Phytoconstituents from the bulb of Lilium polyphyllum D Don. Int. Res. J. Pharm., 2012, 3, 146–148. 10. Rana, M. S. and Samant, S. S., Threat categorization and conservation prioritization of floristic diversity in the Indian Himalayan Region – a state of art approach from Manali Wildlife Sanctuary. J. Nat. Conserv., 2010; doi:10.1016/j.jnc.2009.08.004. 11. Dhyani, A., Phartyal, S. S., Nautiyal, B. P. and Nautiyal, M. C., Epicotyl morphophysiological dormancy in seeds of Lillium polyphyllum (Liliaceae). J. Biosci., 2013, 38, 13–19. 12. Nayar, M. P. and Sastry, A. R. K., Red Data Book of Indian Plants, Botanical Survey of India, Calcutta, 1990. 13. Rana, M. S. and Samant, S. S., Population biology of Lilium polyphyllum D. Don ex Royle – a critically endangered medicinal plant in a protected area of northwestern Himalaya. J. Nat. Conserv., 2011, 19, 137–142. 14. Dhyani, A., Sharma, G., Nautiyal, B. P. and Nautiyal, M. C., Propagation and conservation of Lilium polyphyllum D. Don ex Royle. J. Appl. Res. Med. Aromat. Plants, 2014, 1, 144–147. 15. Murashige, T. and Skoog, F., A revised medium for rapid growth and bioassays with tobacco tissue cultures. Physiol. Plant., 1962, 15, 473–497. 16. Epstein, E., Mineral Nutrition of Plants: Principles and Perspectives, John Wiley, New York, 1972, p. 412. 17. Young, R. H., Land use and biodiversity relationships. Land Use Policy, 2009, 26, 178–186. 18. Raffaelli, D., How extinction patterns affect ecosystems. Science, 2004, 306, 1141–1142. 19. Chang, C., Chen, C. T. C., Tsai, Y. C. and Chang, W. C., A tissue culture protocol for propagation of a rare plant Lilium speciosum Thunb. Var. gloriosoides Baker. Bot. Bull. Acad. Sci., 2000, 41, 139–142. 20. Panwar, G. S. and Guru, S. K., An efficient in vitro clonal propagation and estimation of reserpine content in different plant parts of Rauwolfia serpentina L. Am.-Eur. J. Sci. Res., 2011, 6, 217–222. 21. Singh, G. and Guru, S. K., Multiple shoot induction in intact shoot tip, excised shoot tip and nodal segment explants of Rauwolfia serpentina. Indian J. Plant Physiol., 2007, 12, 360–365. 22. Giri, L. et al., In vitro propagation, genetic and phytochemical assessment of Habenaria edgeworthii: an important Astavarga plant. Acta Physiol. Plant., 2011; doi:101007/s11738-011-0884-8. 23. Coste, A., Halmagyi, A., Keul, A. L. B., Deliu, C., Coldea, G. and Hurdu, B., In vitro propagation and cryopreservation of Romanian endemic and rare Hypericum species. Plant Cell Tiss. Organ. Cult., 2012, 110, 213–226. 24. Zielinska, S., Piatczak, E., Kalemba, D. and Matkowski, A., Influence of plant growth regulators on volatiles produced by in vitro grown shoots of Agastache rugosa (Fischer & C.A. Meyer) O Kuntze. Plant Cell Tiss. Organ Cult., 2011, 107, 161–167.
Development of lifetime milk yield equation using artificial neural network in Holstein Friesian crossbred dairy cattle and comparison with multiple linear regression model Manisha Dinesh Bhosale* and T. P. Singh Symbiosis Institute of Geo-Informatics, Symbiosis International University, Pune 411 016, India
The scope of this study was to develop lifetime milk yield (LTMY) prediction equation using different economical traits. The traits used were first lactation length, first peak yield, first lactation total milk yield, and total of three lactation milk yield of 1210 Holstein Friesian crossbred dairy cattle in India. Four variants of feed-forward back propagation algorithms were compared with the multiple linear regression model. The performance of Bayesian regularization (BR) algorithm was found to be better than the other algorithms for LTMY prediction. The BR neural network model was able to predict milk yield with 71.18% R2. Keywords: Artificial neural network, cows, lifetime milk yield, multiple linear regression.
Received 4 March 2016; revised accepted 12 March 2017
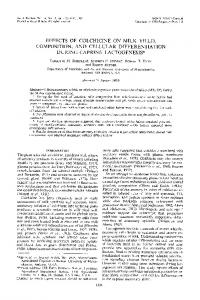
ACCORDING to the National Dairy Development Board, India will need around 220 MMT milk by 2022. To achieve this target, we will need to improve productivity of our existing population of cows, as it is difficult to increase the number of animals due to shortage of land, feed and fodders1 . In the last two decades migration of population towards urban areas has increased several fold in search of livelihood. So it is expected that the number of farmers will decrease and the number of animals per farmer will increase. In this situation, if a farmer could know how much milk his cow can produce in a lifetime, it will be the most important factor for further planning and management2,3. The analysis of lifetime milk yield (LTMY) is important for various reasons. It is helpful to select genetically superior bulls4,5. Milk yield prediction also helps in the selection of animals, which leads to optimal breeding strategies and increased annual genetic progress6. The objective of this study was to develop the LTMY prediction equation for dairy cattle. The cow starts giving milk after the birth of its calf; this is called the lactation period. Scientifically it should be 305 days to maintain the productivity of the animal. Standard lactation curve (Figure 1) follows a nonlinear pattern of milk production. Therefore, a nonlinear function should be used for the prediction of milk yield7. The traditional multiple linear regressions (MLRs) do not consider multicollinearity for
doi: 10.18520/cs/v113/i05/946-951
*For correspondence. (e-mail:
[email protected])
ACKNOWLEDGEMENT. We thank the Director, Botanical Survey of India, Dehradun for infrastructure and financial support. We also thank Mr Amber Srivastava for providing bulbs of the species.
CURRENT SCIENCE, VOL. 113, NO. 5, 10 SEPTEMBER 2017
951
RESEARCH COMMUNICATIONS prediction. They also fail to address the interdependency of independent variables. An artificial neural network (ANN) approach is used for prediction of milk yield. ANN has the ability to learn from experience to improve performance and adapt to changes in the environment8. In this study, ANN was used to train data using four variants of the feed-forward back-propagation (FFBP) algorithms that are Bayesian regularization (BR), scaled conjugate gradient (SCG), Levenberg–Marquardt (LM) and Broyden–Fletcher–Goldfarb–Shanno algorithm quasiNewton (BFG) algorithm. BR prevents over-fitting tendencies and improves prediction accuracies. It minimizes combination of squared errors, and weights, and determines the correct combination to produce a generalized network9–11. SCG avoids time-consuming line search. It significantly reduces the number of computations performed in each iteration. It has relatively modest memory requirement10,12 . LM has better convergence properties; however, it requires more memory as well as computation time. LM performs better on nonlinear regression problems13,14. BFG converges faster than conjugate gradient methods, but it is complex and expensive to compute the Hessian matrix for feedforward neural networks10,15. There has been relatively less research in the application of ANNs in the dairy sector for prediction and forecasting of milk yield. Few studies focus on the capability of ANN to predict LTMY, first lactation 305-day milk yield (FL305DMY), fat and protein concentration of milk, etc. 4–6,8,16–19. Some studies showed that prediction of milk yield by using ANN model was more accurate than Wood’s model16,20 as well as by the MLR method17–19,21. Hence it has potential as an alternative to the MLR model in different breeds17,22–24. Gandhi et al. 17,18 have developed the optimum equation incorporating three variables, namely age at first calving (AFC), FL305DMY and first lactation length (FLL). They found the ANN was more accurate than MLR for prediction of LTMY on the basis
of early lactation traits in Sahiwal cattle. Sanzogni and Kerr8 compared MLR and ANN models for prediction of total annual farm milk production from nutritional inputs. They found that ANN gave better results than MLR. This study was carried out on 1210 Holstein Friesian crossbred dairy cattle maintained at different organized dairy farms in Pune, India, over a period of six years (2006–12). The cows completing first three parities were considered for the study. Various economic traits of each cow considered were AFC, average body weight (ABW), calving interval (CI), first service period (FSP), FLL, total milk yield of first lactation (FMY), first lactation peak yield (FPY) and total of three LTMYs. Exploratory data analysis was first conducted to identify the outliers, find trends and validate assumptions like normality of dependent variable LTMY and linearity assumption between LTMY and various traits like AFC, FPY, CI, FSP, ABW, FLL and FMY. Bivariate analysis was conducted using Statistical Analysis Software (SAS 9.3) to identify the strength and direction of the relationship between each trait with LTMY. Stepwise forward regression method in MLR technique was used to decide the best traits impacting LTMY among AFC, FPY, CI, FSP, ABW, FLL and FMY. FLL, FPY and FMY turned out to be the best predictors (P < 0.05) of LTMY (Table 1). Around 2% of the data was imputed for missing values or outlier treatment by taking an average of all respective variables to avoid loss of information 25. For example; cows having FLL more than 400 or less than 120 were imputed to their average figure. The data were then divided randomly into two groups, namely training and testing. The model was built on the training dataset and test dataset was used to validate the estimated regression parameters. Various partitioning schemes were used to test the robustness of the developed model (Table 2). A supervised multilayer feed-forward neural network with back-propagation of error learning mechanism was developed using neural network toolbox of MATLAB 7.8
Table 1. Input variable
Input and output variables
Description
FLL
First lactation length
FPY FMY
First peak yield First lactation total milk yield
Table 2.
952
Standard lactation curve.
66.67–33.33 75–25 80–20 90–10 95–5
LTMY (lifetime milk yield)
Data partitioning scheme used
Data partition (%)
Figure 1.
Output variable
Training
Testing
807 908 968 1089 1149
403 302 242 121 61
CURRENT SCIENCE, VOL. 113, NO. 5, 10 SEPTEMBER 2017
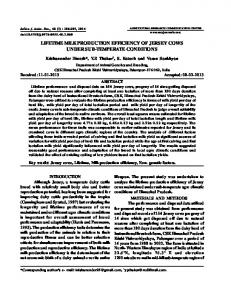
RESEARCH COMMUNICATIONS for the LTMY prediction equation. The multilayer network was divided into three layers: input layer which receives input, 1–2 hidden layers, and one output layer which gives output26. Back-propagation indicates the neurons are organized in layers, and send their signals ‘forward’, and then the errors are propagated backwards. In supervised learning the algorithm is provided with the inputs and outputs we want the network to compute, and then the error, i.e. the difference between actual and expected results is calculated. The training begins with random weights, and the goal is to adjust them so that the error will be minimal27. As explained earlier, the network was trained and simulated using BR, LM, SCG and BFGS algorithms up to 4000 epochs or till the algorithm was trained. Initial weight and bias matrix were randomly initialized between –1 and +1. The nonlinear activation function tangent sigmoid was used to compute the output from summation of weighted inputs of neurons in each hidden layer 28. The pure linear transformation function was used as the activation function in output layers for obtaining the network response. Each neural network model was trained with different neural network design schemes such as single hidden layer and two hidden layers with different number of neurons in the hidden layers (Table 3) with five combinations of data partition strategy (Table 2). The R2 and RMSE values were used to evaluate the efficiency of the network. The designed network was trained in supervisory mode. The best strategy was found to be ‘95–5%’ division of data with three input variables – FLL, FPY, FMY, and two hidden layers having five neurons in both the layers and one output variable, i.e. LTMY (Figure 2). The main aim of the dairy industry is to draw maximum benefits from a cow in terms of LTMY. In this study we have predicted LTMY of cows using different economic traits of first lactation, like CI, ABW, AFC, FSP, FLL, FPY and FMY. The influence of these factors on total milk yield was analysed by various statistical methods. We also studied the effect of one trait on another with the help of regression. The Pearson correlation matrix was tested for all the traits to check the association among them (Table 4). The results revealed that FPY and FMY had the highest association with LTMY, while ABW and AFC were not significantly associated with it. Among the various first lactation economic traits, we found that FLL, FPY and FMY had the most significant effect on the LTMY prediction model. Therefore, these three traits were
considered as input variables and LTMY as output variable in this study (Table 1). The descriptive statistics in Table 5 shows the mean, standard deviation and coefficient of variation for all the traits. For example, the data reveal that average LTMY is 9510 with 3205 kg, average FLL is 260 with 65 days, etc. As discussed earlier, the model was simulated with four variants of FFBP algorithm with different data partition strategies (Table 2). In this study a total of 32 neural network models with each data partition scheme have been evaluated (Table 2). The trial and error approach of using different data partition schemes helps improve the prediction accuracy in all the variants. The best data partition strategy was found to be 95% records used as training and 5% records used to test the model performance. Performance of all the four variants was compared. It was found that the BR model (eq. (1)) was superior to the other three variants. This model was able to attain 71.18% R2, i.e. 71.18% variation in the milk yield prediction was explained by this model with prediction accuracy measured by RMSE value of 0.527 (Table 6). Further, the performance of the BR model (eq. (1)) was compared with the MLR model (eq. (2)). The R2 value in MLR was 53.03% and RMSE was 10.13, both comparatively less than the BR model. Yˆ = 2951.82 + (2.42 * FLL) + (76.30 * FPY)
+ (1.72 * FMY),
(1)
Yˆ = 2358.65 + (3.358 * FLL) + (98.3 * FPY)
+ (1.73 * FMY),
(2)
where Yˆ is the predicted LTMY. From eq. (1) we can deduce the following: For each cattle, minimum of 2951.82 liters of milk is predicted. For each additional day, FLL is predicted to give additional 2.42 kg of milk. With each additional 1 kg milk, FPY is predicted to give additional 76.3 kg of milk.
Table 3. Neural network design used in this study Layer 1 2
No. of neurons used 3, 5, 7, 10 {3,5}, {3,7}, {5,5}, {5,10}
CURRENT SCIENCE, VOL. 113, NO. 5, 10 SEPTEMBER 2017
Figure 2. Architecture of two hidden layers artificial neural network model having five nodes in the first and second layers. 953
RESEARCH COMMUNICATIONS Table 4. AFC AFC FLL FSP CI ABW FPY FMY LTMY
Pearson correlation coefficients
FLL
FSP
CI
ABW
FPY
FMY
LTMY
0.066
0.150 0.192
0.118 0.223 0.611
–0.006 0.026 –0.048 –0.050
0.021 0.013 0.020 0.014 0.010
0.063 0.265 0.259 0.232 0.012 0.304
0.044 0.079 0.150 0.176 0.002 0.471 0.631
AFC, Age at first calving; FLL, First lactation length; FSP, First service period; CI, Calving interval; ABW, Average body weight; FPY, First peak yield; FMY, First milk yield and LTMY, Life time milk yield. Table 5.
Descriptive statistics
Traits
Mean
SD
CV
AFC FLL FSP CI ABW FPY FMY LTMY
1024 260 120 413 473 20 2843 9510
425 65 97 94 61 5.7 1353 3205
41.5 25.0 81.1 22.8 12.9 27.8 47.6 33.7
SD, Standard deviation; CV, Coefficient of variation. Table 6. Results of Bayesian regularization (BR), Levenberg Marquardt (LM), scaled conjugate gradient (SCG) and Broyden–Fletcher–Goldfarb–Shanno (BFGS) on 95–5% dataset Layer
Neurons
R2
RMSE
BR
2
5, 5
71.18
0.527
LM
2
3, 5
68.95
0.035
SCG BFG
2 2
5, 5 3, 5
68.43 70.48
0.033 0.027
Algorithm
Cows with additional 1 kg FMY are predicted to give additional 1.72 liters of milk. Equation (2) corresponds to MLR with similar description. The ANN model has been proposed to predict LTMY in Holstein Friesian crossbred dairy cattle. Economic traits used in this study are FLL, FPY, FMY and LTMY. In the development of this model four variants (BR, LM, SCG and BFG) of FFBP were used for network optimization. We have tried various combinations of architectural parameters like different data partitioning strategy, 1–2 hidden layers, various combinations of number of neurons in each layer, learning rate, activation functions, performance goal, and epochs for enhancement of the neural network. From this study it can be concluded that the nonlinear function should be used for prediction of milk yield. MLR does not consider nonlinearity for prediction. It also fails to address the interdependency of independent variables. This study shows that ANN can be used as 954
a potential tool for the prediction of LTMY in Holstein Friesian crossbred dairy cattle. The prediction equation developed in this study can be used as a decision support model to analyse animal productivity with available milk yield information from individual dairy farmers is having less than 10 cattles, or organized dairy farms having more than 10 cattle. Use of least variables helps make the model more generic, as the farmer has to provide minimum information. It shows that the three traits considered in the study have the maximum influence on LTMY while selecting any cow. It also helps farmers plan the feed and fodder requirement and discard non-productive animals from the herd.
1. Anon., Livestock Survey Report, 2012–13, Association of Livestock Industry (CLFMA), Mumbai, Maharashtra, India. 2. Anon., Department of Animal Husbandry, Dairying and Fisheries, Ministry of Agriculture, Government of India, Annual Report, 2012–13. 3. Anon., International Union of Food (IUF) Dairy Industry Research, A report on Indian Dairy Industry, 2011. 4. Ruhil, A. P. et al., Prediction of lactation yield based on partial lactation records using artificial neural networks. In Proceedings of the Fifth National Conference on Computing for National Development (INDIACom-2011), New Delhi, 2011. 5. Sharma, A. K., Sharma, R. K. and Kasana, H. S., Empirical comparison of feed-forward connectionist and conventional regression models for prediction of first lactation 305-day milk yield in Karan Fries dairy cows. Neural Comput. Appl., 2006, 15, 359–365. 6. Njubi, M. et al., Milk yield prediction in Kenyan Holstein– Friesian cattle using the computer neural network system. Livestock Res. Rural Dev., 2009, 21(4). 7. Gandhi, R. S. and Dongre, V. B., Prediction of first lactation 305day milk yield based on monthly test day records using artificial neural networks in Sahiwal cattle. Indian J. Dairy Sci., 2012, 65(3), 229–233. 8. Sanzogni, L. and Kerr, D., Milk production estimates using feed forward artificial neural networks, Comput. Electron. Agric., 2001, 32, 21–30. 9. Gençay, R. and Min, Q., Pricing and hedging derivative securities with neural networks: Bayesian regularization, early stopping and bagging. IEEE Trans. Neural Networks, 2001, 12(4), 726–734. 10. Kasthurirangan, G., Effect of training algorithms on neural networks aided pavement diagnosis. Int. J. Eng., Sci. Technol., 2010, 2(2), 83–89. 11. MacKay, D. J. C., Bayesian interpolation. Neural Comput., 1992, 4, 415–447. CURRENT SCIENCE, VOL. 113, NO. 5, 10 SEPTEMBER 2017
RESEARCH COMMUNICATIONS 12. Demuth, H. B. and Beale, M. H., Neural Network Toolbox – For Use with Matlab, User’s Guide, Version 4, 2002. 13. Hagan, M. T., Demuth, H. B. and Beale, M., Neural Network Design. Variations on Backpropagation, Fourth Indian reprint, 2011, pp. 12–14; 19; 46. 14. Beale, M. H., Hagan, M. T. and Demuth, H. B., Neural Network Toolbox – User’s Guide R2013b, 2013. 15. Yegnanarayana, B., Artificial Neural Networks. Feedforward Neural Networks, Nineteenth Printing, 2012, pp. 117; 130–131. 16. Khazaei, J. and Nikosiar, M., Approximating milk yield and milk fat and protein concentration of cows through the use of mathematical and artificial neural networks models. In World Conference on Agricultural Information and IT. Tokyo, Japan, 2008, pp. 91–105. 17. Gandhi, R. S., Raja, T. V., Ruhil, A. P. and Kumar, A., Prediction of lifetime milk production using artificial neural network in Sahiwal cattle. Indian J. Anim. Sci., 2009, 79(10), 1038–1040. 18. Gandhi, R. S., Raja, T. V., Ruhil, A. P. and Kumar, A., Artificial neural network versus multiple regression analysis for prediction of lifetime milk production in Sahiwal Cattle. J. Appl. Anim. Res., 2010, 38, 233–237. 19. Bhosale, M. D. and Singh, T. P., Comparative study of feedforward neuro-computing with multiple linear regression model for milk yield prediction in dairy cattle. Curr. Sci., 2015, 108(12), 2257–2261. 20. Grzesiak, W. and Blaszczyk, P., Methods of predicting milk yield in dairy cows – predictive capabilities of Wood’s lactation curve and artificial neural networks (ANNs). J. Comput. Electron. Agric., 2006, 54, 69–83. 21. Dongre, V. B. and Gandhi, R. S., Comparative efficiency of artificial neural networks and multiple linear regression analysis for prediction of first lactation 305-day milk yield in Sahiwal cattle. Livestock Science, 2012, 147, 192–197. 22. Sharma, A. K. and Sharma, R. K., Prediction of first lactation 305day milk yield in Karan Fries dairy cattle using ANN modeling. J. Appl. Soft Comput., 2007, 7, 1112–1120. 23. Sharma, A. K. and Sharma, R. K., Effectiveness of heuristic rule for model selection in connectionist models to predict milk yield in dairy cattle. Int. J. Comput. Sci. Commun. Technol., 2009, 2(1), 384–386. 24. Sharma, S. K. and Kumar, S., Anticipating milk yield using artificial neural network. Int. J. Appl. Sci. Eng. Res., 2014, 3(3), 690– 695; doi:10.6088/ijaser.030300013. 25. Chen, T. and Sun, Y., Probabilistic contribution analysis for statistical process monitoring: a missing variable approach. Control Eng. Pract., 2009, 17(4), 469–477. 26. Fiona, N., Neural Networks – Algorithms and Applications, Niels Brock Business College, 2001, vol. 27. 27. Anon., An overview of artificial neural networks. In Winter School on Data Mining Techniques and Tools for Knowledge Discovery in Agricultural Datasets, Education Division, Indian Council of Agricultural Research, India, 2011. 28. Sharma, A. K. and Sharma, R. K., Effect of transfer functions on the performance of connectionist models. In IEEE International Advance Computing Conference (IACC 2009), Patiala, 2009, pp. 638–641.
Pliocene Indonesian Throughflow change and planktic foraminiferal diversity in the eastern subtropical Indian Ocean Ajai Kumar Rai1,*, Vishwesh K. Pathak1 , Lakshmi K. Sharma2 and Ajhar Hussain1 1
Department of Earth and Planetary Sciences, University of Allahabad, Allahabad 211 002, India 2 Department of Earth Sciences, Indian Institute of Technology, Mumbai 400 076, India
The opening and closing of seaways due to plate tectonic movement strongly influenced the past oceanic circulation patterns which have their influence on the past climate and faunal record. The considerable restructuring of one such seaway, Indonesian seaway, took place during Pliocene (4–3 Ma). This would have changed the source of Indonesian Throughflow (ITF) from warm and saline south Pacific waters to the north Pacific cool and relatively fresh waters. In the present study, three indices of diversity (ShannonWiener Index; H(S), equitability; E and alpha index; ) at ODP sites 762B and 763A in the eastern subtropical Indian Ocean are calculated to better understand the role of ITF on Pliocene surface hydrography and planktic foraminiferal diversity. A major interval of early Pliocene demonstrates more diverse fauna and low abundance of fertile taxa along with increased planktic Mg/Ca ratios. Strong influence of warm ITF waters due to broad and open seaway until the end of early Pliocene, increased the sea surface temperature (SST) and depth of thermocline in the Leeuwin current area of eastern subtropical Indian Ocean. This would have been responsible for more vertical niche partitioning of surface water and thus, higher planktic foraminiferal diversity. The significant decline in faunal diversity between critical interval of ~3.5 and 3 Ma (beginning of Late Pliocene) is suggested to be the response of fall in SST and increase in surface water productivity possibly due to relatively less influence of ITF waters in the eastern Indian Ocean as a consequence of significant constriction of Indonesian Seaway. Keywords: Diversity, Indian Ocean, Indonesian Throughflow, Pliocene, planktic foraminifera.
Received 26 February 2016; revised accepted 31 March 2017
T HE climatic systems during most of the Cenozoic are significantly influenced by opening and closing of various seaways due to the drifting of continents1 . Significant changes in the circulation during the Pliocene as a result of several tectonic rearrangements in the tropics are believed to be the major causal mechanism for plunging the world into an ice age with well-known northern
doi: 10.18520/cs/v113/i05/951-955
*For correspondence. (e-mail:
[email protected])
ACKNOWLEDGEMENTS. We thank the Pune Zilha Sahkari Dudh Utpadak Sangh Maryadit (Katraj Dairy) and Military Dairy Farm, Pimpri-Chinchwad, Pune for support while collecting livestock data required for this study. We also thank the anonymous reviewer(s) for critical comments that helped improve the manuscript.
CURRENT SCIENCE, VOL. 113, NO. 5, 10 SEPTEMBER 2017
955