PSIHOLOGIJA, 2006, Vol. 39 (2), 207-227
UDC159.95.072-057.875(=214.58)
DEVELOPMENT OF MATHEMATICAL AND LANGUAGE LITERACY AMONG ROMA STUDENTS1 Aleksandar Baucal2 Department of Psychology, University of Belgrade
The main goal of the paper is to analyze educational achievements of Roma students in the lower grades of compulsory education in Serbia, as well as to find out what is the influence of the socio-economic status and the quality of education on the educational achievements. The main source of data is the Grade 3 National Assessment Study which is implemented in Serbia during year 2004. The results show that there is big gap regarding to the educational achievements between Roma and non-Roma students (average score of Roma is more than 130 points behind of national average; about 50% of Roma students do not develop even the basic mathematical and language literacy; and the repeating rate is about 11%). Secondary analysis of the results shows that about 40% of this gap can be explained by the lower socio-economical status of Roma, and about 60% is determined by the lower level of education quality delivered to Roma students in Serbian schools. Moreover, based on the analysis, some aspects of the lower education quality are determined: Roma students are in higher extent than non-Roma students into the classes with the lowest education quality, teachers have lower expectations from Roma students and support them in less extent, curriculum is “shortened” and “simplified” for Roma, etc. The conclusion of the study is that without waiting for general improvement of living and social conditions in which Roma population live in Serbia, there is big space for improvement of education quality delivered to Roma students in Serbian schools. Key words: Roma students, education, mathematical literacy, language literacy, socio-economic status
1
The paper is mainly based on secondary analysis of the data collected within the Grade 3 National Assessment (2004). The assessment was carried out within “Education Improvement project” of the Ministry of Education of Republic of Serbia financed by the loan received from the World Bank. The secondary analysis has been realized within the project “Psychological problems in the context of social changes” implemented by the Institute of Psychology, University of Belgrade, which was financed by the Ministry of Science and Environment (no. 149018). 2 Author’s address:
[email protected]
Aleksandar Baucal
The paper relies on three new important ideas that significantly changed the education in many countries at the beginning of the nineties of the last century, along with some other ideas. The first idea refers to the fact that the right to education is a universal right. At the Conference in Yamatane (Thailand), which took place in 1990, the representatives of 155 countries and 150 organizations set the objective to radically decrease the illiteracy by the end of the decade. Education has been marked as a key factor that may lead to a break of the “vicious circle“ and a significant improvement of the economic and social development of the poorest (“Education for all“, UNESCO). The second big change is related to the education process itself. It is based on some of the most influential theories of the children’s development (Piaget, 1969; Gruber & Vonèche, 1995; Inhelder, Sinclair & Bovet, 1974; Vigotski, 1974) where the student’s learning process is placed in the central position, and instruction and everything done by a teacher has been defined as creation of learning opportunities which support and uphold the learning process. Thus, the instruction serves learning and a teacher shapes his/her activities depending on the educational and developmental needs of students. The third change concerns the educational politics that was before focused on the input (curriculum, teachers’ salaries, textbooks, etc.), where the supposition was that the outcomes are necessary consequence of the adequate input. However, the new educational policy focuses on the educational achievements of a student, and leaves more space for the autonomy to schools and teachers in relation to the school curriculum, textbooks, instruction and learning organization, etc. (World Bank, 1995; Stewart, 1996; Bakker, 1999; Kellaghan & Greaney, 2001). In Serbia, like in many other countries (Liegeois & Gheorge, 1995; Pinnock, 2001), Roma population is the most imperiled category of population. All demographic data (length of life, health condition, education, employment, etc.) point out the disastrous status of Roma population in Serbia (Mihajlović, 2004; Burnett et al, 2005). In the “Overall analyses of elementary education in Serbia and Montenegro“ (UNICEF, 2001), it is estimated that around 80% of Roma population is functionally illiterate. In the Needs Assessment Study prepared for the Roma Education Fund (REF), which was implemented as a part of preparations for the Roma Decade3, the following data on Roma population in Serbia have been stated: about 62% of Roma population have not completed elementary education, while about 27% have completed only elementary school. About 60% of Roma population are supported persons, Roma are settled in the poorest settlements, about 50% of Roma do not continue education after the fourth grade of elementary school, etc. (Mihajlović, 2004). Those findings have been confirmed also by other researches dealing with the education of Roma population (Rakočević & Miljević, 2003).
3
The Decade of Roma Inclusion, 2005-2015, is an initiative adopted by eight countries in Central and Southeast Europe, and supported by the international community. It represents the first cooperative effort to improve the lives of Roma in Europe. An action framework for governments, the Decade will monitor progress in accelerating social inclusion and improving the economic and social status of the Roma across the region. (www.romadecade.org)
208
Development of Mathematical and Language Literacy among Roma students
However, these figures express the education status of Roma only on the basis of completion of certain level of education. It is certainly important information, but on its basis it cannot be concluded which knowledge and skills a particular person has. In other words, at this moment, there are no reliable and valid data on the educational achievements of Roma students in respect of the development of the basic mathematical and language literacy. Without those data, as we have seen, it will be very difficult to carry out a modern educational policy directed to an improvement of educational achievements of all children, especially the vulnerable groups like Roma. Still, in the course of 2003 and 2004, the Institute for Evaluation of the Education Quality carried out the National Assessment Study among the third-grade elementary school students. Having in mind significance of the data on the educational achievements of vulnerable groups of children, an objective of the study was to provide information about achievements of Roma students, as well as the students from refugee and IDP families, regarding to development of the basic mathematical and language literacy. The paper will focus only on the educational achievements of Roma students since it turned out that they are the most imperiled group of children (Baucal et al., 2004). The main objective of the paper is to get the answers to the following questions: 1 What are the school marks of Roma students in comparison to the non-Roma students? 2 What are the achievements of Roma students in comparison to the non-Roma students on the standardized achievement tests? 3 What is the repeating rate of Roma students in comparison to the non-Roma students? 4 To what extent do lower educational achievements of Roma students appear as a result of their lower socioeconomic status (SES), and to what extent are they generated throughout lower quality of education to which the Roma students have been exposed? 5 Which aspects of instruction contribute to the lower quality of education to which the Roma students have been exposed? Answers to these questions should be used as a base for the development of measures and activities, which should improve the quality of Roma education.
METHOD Sample The main sample for the National Assessment includes 4,519 Grade 3 students (212 classes, 113 primary schools) from all 25 districts of the Republic of Serbia (excluding Kosovo and Metohija). From each district (from the list of all schools) 209
Aleksandar Baucal
two schools were randomly selected from urban areas and two schools from rural areas, except in the case of Belgrade. In the case of Belgrade, 10 schools were randomly selected. From each school, two randomly selected classes were tested. Selected schools are located in 100 places included in 77 different municipalities. Out of this number, 4178 (92.5%) of students were present in the school on the testing day. The data obtained in this way were weighted in order to get representative sample of Grade 3 students in Serbia.
Instruments In the main study, two tests (Serbian language, and mathematics) were used, designed and standardized on the basis of the pilot study realized during 2003. As usual in the Assessment studies, incomplete design was used (Johnson, 1992). The tests included total of 157 items in the Serbian language and 162 items in mathematics organized into 12 booklets per subject. These items covered 5 domains from Serbian language subject (reading, writing, grammar, semantics, literature), and 6 domains from Mathematics (the understanding of numbers up to 1000, calculation operations, geometry, measuring and measures, fractions, the application of mathematics – rules and graphs, and money operations). Based on results in the tests of the Serbian language and Mathematics, 5 hierarchically ordered levels of achievements were defined (from the lowest E, through D, C, B up to the highest, A). These levels were defined qualitatively based on the knowledge and skills the students from the level developed (Table 1 and 2). The fact that these levels are hierarchically ordered means that students from certain level can demonstrate also the knowledge and skills from all lower levels. Besides the tests in Serbian language and Mathematics, questionnaire for students, questionnaire for teachers, and questionnaire for school principal were also used in order to collect data on relevant contextual factors that could provide explanation of students’ achievements.
Level A
B
210
Table 1. Five Levels of Achievements in Mathematics Qualitative description of the level of achievements (what does a student at this level knows and can do) A student manages to deal with more complex situations by setting out necessary data (analysis) integrating them (synthesis) to solve a task. He/she may perform classification in compliance with given criteria. In real context (actual situations in life) various possibilities are tested and the best solution is selected. At the same time, he/she may take several criteria into account. Understands relations between two-dimensional objects, observes how new figures are made out of given elements. Understands simple transformations. May solve very simple tasks including combinatory. Student may reorganize and transform data from one form (record type) into another one, i.e. may graphically present fractions, read, and use the data given in chart or table to set
Development of Mathematical and Language Literacy among Roma students
C
D E
Level A
B
C
D
E
and solve the task. May, on the basis of text, set and solve equations. Draws conclusions by analogy (by comparison, observing similarities). Applies learnt rules to solve a more complex situation solved in several steps. Demonstrates various skills in the area of measuring – understanding size relations, transformation. Student may determine which rule needs to be applied to solve a routine, typical situation. Understands rules and may expand the area of their application in new, simple situations. Calculates expressions with two operations of various priorities. Uses the data set in tables and charts. Student understands simple relations among learnt concepts. May perform calculation operations with two- and three-digit numbers. Capable of discovering and applying simple rules in simple operations. Student has basic knowledge and concepts in the mathematics. Applies learnt rules in simple situations. Table 2. Five Levels of Achievements in the Serbian Language Qualitative description of the level of achievements (what does a student at this level knows and can do) Student may determine the meaning of a word on the basis of complex context. Understands the text which is complex, distant from student’s experience, finds explicit and implicit information in text including the words similar in meaning or phonetic structure. Precisely asks questions to get requested information. Makes a story on one event using given sentences (reconstructs the sequence of constituent story elements). Recognizes word types and their functions in a complex linguistic environment. Student determines the meaning of words, expressions, and phrases in the context, which make understanding difficult. Finds out explicit and discovers implicit information in the text which includes a lot of information and which is not close to students’ experience. Asks questions with the aim of getting requested information. Composes a story according to given criteria. Builds up words using prefix and suffix. Knows and applies more complex spelling rules. Individually recognises subject, predicate, and adverbs, regardless of their position in sentence. May adjust style to the situation of communication. Student recognizes, understands, and uses words close to his/her experience at school or in everyday life. Recognizes or understands the meaning of sentence, short prose text, poem. Finds out explicit information in short text including many data. Actively uses spelling rules (capital letter writing, particle not and particle whether, phoneme j, abbreviations, commas). Differentiates short prose types and basic literary concepts. Recognizes basic communication styles. Student understands basic sense of short text, regardless of whether it is linear (literary, informative) or non-linear (table). Finds out information that is explicitly provided in a short, simple text, close to student’s experience. Recognizes basic grammar concepts (subject, predicate, time adverb, types of sentences by their meaning); may perform simple grammatical transformations (the transformation of affirmative sentences into negative sentences); makes present simple, past, and future tense according to an example. Recognizes and applies simple spelling rules. Determines the meaning of words or phrases in easily understandable context. Recognizes fable as literary type. Student may understand the meaning of words, phrases, and short text, close to his/her experience. Recognizes basic spelling rules, basic grammatical and literary concepts. Recognizes and differentiates the letters of both alphabets, and establishes a connection between them. Notices vowels in words.
211
Aleksandar Baucal
Assessment Procedure Each student was assessed using one test per subject. The tests in the Serbian language and mathematics were distributed according to the spiral method (Allen, Carlson & Zelenak, 1999). Students had 45 minutes to solve Serbian language test, and 45 minutes for Mathematics test. A half of students were first tested in the Serbian language, followed by the test in mathematics, while another half of students was tested in different sequence. After the tests in the Serbian language and mathematics, students completed student questionnaire. At the same time, teachers and principal completed the questionnaire for teachers and questionnaire for principal, respectively.
Data Processing Since the students were tested using 12 different tests in the Serbian language and 12 different tests in mathematics, students’ achievement was calculated on the basis of single-parameter IRT using Winsteps program. Students’ achievements at the National Assessment Study were expressed at the scale where national average is 500 points, and standard deviation is 100 points (which means that around 2/3 of students have the score between 400 and 600 points). Based on the score, each student was allocated to relevant achievement level (from E to A), and those students who failed to demonstrate the knowledge and skills defining the lowest level E were allocated to the category “below E“.
RESULTS AND DISCUSSION School Marks of Roma and non-Roma Students The first indicators of Roma education achievements are school marks which are result of teacher assessment. Within the National Assessment, data on school marks of students (Roma and non-Roma) were collected for the first three grades of elementary school (Table 3). The data on school marks indicate a very significant difference in education achievements of Roma and non-Roma students regarding to two subjects. It may be seen that the majority of Roma pupils (45-55%) have the lowest passing grade (2), while over 40% of non-Roma pupils in all three grades in both subjects have the highest mark (5). Great difference in education achievements expressed through school marks is also perceived in terms of the number of pupils who had mark (1) at 212
Development of Mathematical and Language Literacy among Roma students
the end of school year (failed). Among Roma students, this percentage ranges from 7% to 11% for the Serbian language, and from 10% to 14% for the Mathematics, while less than 1% of non-Roma children got the mark 1 at the end of school year. On the other hand, when the highest school mark is analyzed (5), it is seen that 4055% of non-Roma students get the highest mark at the end of school year, while this percentage among Roma children ranges between 5% and 10%. Thus, when school marks of Roma and non-Roma children are compared, a very high and significant difference is perceived. Table 3. School marks of Roma and non-Roma students in the first 3 grades of elementary school I grade School mark 1
Mathematics
2 3 4 5
The Serbian language
1 2 3 4 5
Roma
II grade
NonRoma
Roma
III grade
NonRoma
Roma
NonRoma
f
22
27
28
26
32
36
%
9.7%
0.6%
12.1%
0.5%
14.0%
0.7%
f
106
367
123
482
122
586
%
46.9%
7.6%
53.2%
10.0%
53.3%
12.1%
f
48
644
35
805
41
914
%
21.2%
13.4%
15.2%
16.7%
17.9%
18.9%
f
28
1311
28
1303
23
1320
%
12.4%
27.2%
12.1%
27.0%
10.0%
27.4%
f
22
2464
17
2203
11
1969
%
9.7%
51.2%
7.4%
45.7%
4.8%
40.8%
f
16
20
23
16
25
20
%
7.1%
0.4%
10.0%
0.3%
10.9%
0.4%
f
102
262
110
351
111
407
%
45.1%
5.4%
47.6%
7.3%
48.5%
8.4%
f
52
600
47
660
50
817
%
23.0%
12.5%
20.3%
13.7%
21.8%
16.9%
f
33
1215
29
1275
27
1330
%
14.6%
25.2%
12.6%
26.5%
11.8%
27.6%
f
23
2716
22
2516
16
2251
%
10.2%
56.4%
9.5%
52.2%
7.0%
46.7%
School Marks of Roma and non-Roma Boys and Girls When discussing school marks of the Roma and non-Roma, it is important to pay attention to school marks of boys and girls (Table 4, Figure 1, and Figure 2). 213
Aleksandar Baucal Table 4. Average school marks in Serbian language and Mathematics in the first three grades of elementary school (Roma and non-Roma students)
Grade 1 Grade 2 Grade 3
Roma Serbian language Mathematics
Non-Roma Serbian language Mathematics
male
female
male
female
male
female
male
female
2.73 2.57 2.42
2.78 2.70 2.67
2.74 2.55 2.33
2.59 2.47 2.44
4.20 4.08 3.92
4.47 4.42 4.35
4.15 4.01 3.85
4.29 4.18 4.09
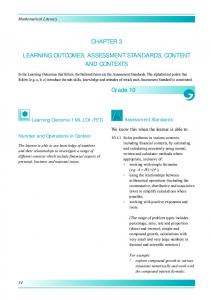
Figure 1. Average school marks in the mathematics in the first three grades 4,50 4,00 nonroma boys
3,50
nonroma girls Roma boys
3,00
Roma girls 2,50 2,00 Grade 1
Grade 2
Grade 3
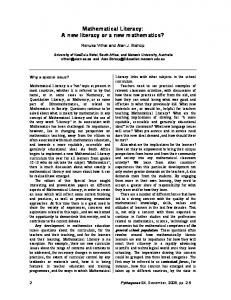
Figure 2. Average school marks in the Serbian language in the first three grades 5.00 4.50 4.00
nonroma boys nonroma girls
3.50
Roma boys
3.00
Roma girls
2.50 2.00 Grade 1
214
Grade 2
Grade 3
Development of Mathematical and Language Literacy among Roma students
As it may be seen, average mark of Roma students ranges between 2.5 and 3, while the average mark of non-Roma students ranges between 4 and 4.5. When the marks of boys and girls are compared, it may be perceived that, among non-Roma students, girls are more successful than boys both in the mathematics and the Serbian language. With Roma children, boys are to some extent more successful than girls in terms of the mathematics in the first grade, but this difference decreases until the third grade when Roma girls have somewhat higher mark in the mathematics than boys have. As far as the Serbian language is concerned, it is perceived that Roma girls and Roma boys have the same average mark in the first grade, but the difference increases in favor of girls until the third grade. Basic reason of difference increase in average mark is in the fact that the average mark of boys in the Serbian language decreases, while the average mark of girls from the first to the third grade remains at the same level.
The Achievement of Roma and non-Roma Students at the National Assessment Study The average achievement of Roma students in mathematics test amounts to 366 points, which is by 134 points below national average, while average achievement in the Serbian language test amounts to 356 points, i.e. 154 points below the national average. There is no statistically significant difference in terms of the result of Roma boys and girls, but it is perceived that educational achievements among girls are significantly more heterogeneous (table 5). Table 5. Average achievements and SD of Roma students at the National Assessment Study Mathematics The Serbian language M (SD) 500 (100) 500 (100) National level M (SD) 366 (121) 346 (143) Roma total M (SD) 370 (109) 348 (122) Roma boys M (SD) 362 (133) 344 (154) Roma girls
In some international studies (TIMSS, PISA) it was determined that one year of education impacted, on average, that students achieve the progress of around 60 points at the scale used for the National Assessment Study in Serbia. If it is assumed that it is the same case in Serbian education, i.e. that one school year results in the progress of 60 points, this would mean that Roma students lag behind other students for 2.2 school years in the mathematics, i.e. 2.6 school years in the Serbian language! Besides, those are the students who have spent only 3 years at school! In other words, Roma students, after the third grade of elementary school, have the achievement level in the mathematics non-Roma students have had at the end of the first grade, and in the Serbian language, they have the achievement level non-Roma students have had in the middle of the first grade. These data may be interpreted in 215
Aleksandar Baucal
another way. If existing quality of education of Roma students was maintained, they should have from 2.2 to 2.6 times more classes (or time spent with teacher) to reach national average. Besides, it is perceived that the variability of the achievements of Roma students is higher than the variability at national level indicating that individual differences among Roma students in terms of educational achievements are higher than among non-Roma students. When two examined subjects are compared, it is perceived that the variability of the achievements of Roma students is higher in the Serbian language test then the variability of the achievement in the mathematics test which is most probably the consequence of the fact that the Serbian language is not mother tongue to Roma students. As it is seemed, based on the achievement tests used in the National Assessment Study the five levels of achievements were singled out. Each level was defined on the basis of what students, at given achievement level, know or can do in the mathematics and the Serbian language (see the table 1 and 2). Table 6. The percentage of Roma students at various levels of the achievements in the mathematics Achievement level National level Roma total Roma boys Roma girls A 7% 0.8% 0% 1.1% B 10% 1.6% 0% 2.3% C 27% 5.5% 5.2% 5.7% D 27% 15.7% 14.3% 12.6% E 18% 26.0% 29.9% 24.1% Below E 11% 50.4% 50.6% 54.0%
The data presented in the table 6 indicate that 50% of Roma students after 3 years of education have failed to acquire even very basic level of mathematical literacy, or failed to be capable of applying very basic mathematical competencies in simple situation (Below E level). On the other side, at the national level, only 11% of students failed to rich level E. Besides those 50% of Roma students, additional 26% of Roma students, after 3 years of education, managed to acquire only knowledge and skills from the level E. It means that, at national level, around 29% of students are at E level or below it, while among Roma students, there are 76% of students who are at E level or below it. When the achievements of Roma boys and girls are compared, it is shown that the difference is not statistically significant. It is similar situation with achievements of Roma students at the Serbian language assessment (table 7). Around 56% of Roma students, after three years of education, failed to master even basic level of language competencies, while, at the national level, this is the case with only 14% of students. It means that four times more Roma students than others rested below the lowest level of educational achievements. With respect to the gender difference, it is shown the difference between Roma girls and Roma boys is not statistically significant.
216
Development of Mathematical and Language Literacy among Roma students Table 7. The percentage of Roma students at various levels of the achievements in the Serbian language Achievement level National level Roma total Roma boys Roma girls A 7% 0.8% 1.3% 1.1% B 12% 1.6% 1.3% 2.3% C 23% 7.8% 5.2% 6.9% D 28% 17.8% 13.0% 16.1% E 16% 16.3% 20.8% 18.4% Below E 14% 55.8% 58.4% 55.2%
Although these findings about the educational achievements of Roma students are already disturbing, it should be stressed that the real situation is somewhat worst. Namely, when the students who were not present at school on testing date are taken into account, it may be perceived that both among non-Roma and Roma students there were more absent students who have lower marks, but this proportion with Roma students is higher (table 8). Table 8. The percentage of the students who did not take part in the assessments study in relation to school marks in the mathematics at the end of III grade The students who did not take part in the assessment study Mark in the mathematics Roma Non-Roma 1 34.8% 22.6% 2 38.7% 11.4% 3 5.6% 5.1% 4 .0% 3.3% 5 9.1% 2.6%
Thus, if all students took part in the assessment study, it could be expected that obtained picture on educational achievements of Roma students would be even more unfavorable.
The Repeating Rate of Roma and non-Roma Students The data on repeating rate in the first three grades of elementary school were also gathered within the National Assessment Study of Grade 3 students of elementary school. The data indicate that, at the national level, repetition rate is 1%, while the repetition rate among Roma students in the first three grades of elementary school is 11%. In other words, out of 100 students of non-Roma nationality, only 1 child will repeat grade during the first three years of education, while there will be 11 students among Roma children who will repeat some of the first three grades. On the other hand, when the representation of Roma students is analyzed within the group of the students who have repeated a grade during the first three grades of education, it is perceived that 48% of those students are of Roma nationality, which
217
Aleksandar Baucal
is far higher than the representation of Roma students within the population of Grade 3 students (3-4%). ***** On the basis of above presented data on educational achievements of Roma students in Serbia (school marks, the result at the National Assessment Study, and the repeating rate), it may be concluded that Roma students have significantly lower education achievements in relation to the national average. Perhaps, the perceived gap in educational achievements of Roma and non-Roma students could be indicated as dramatic. Perhaps, regardless of the fact whether this gap in the achievements would be indicated with more or less dramatic attributes, it is actually of such a level that it points out the necessity and urgency to design and implement the measures impacting the decrease of this gap. Besides, it should not be ignored that the majority of the data used herein have been provided in the third grade of the elementary school. Thus, already after three years of education, the gap between Roma and non-Roma students is very high. If similar data for older students would be available, the picture would probably be even more dramatic.
To What Extent Does School Contribute to Lower Achievements of Roma Students? One interpretation of the finding that Roma students have significantly lower educational achievements than non-Roma students may be related to the fact that Roma students, in higher number that non-Roma students, originate from the families having very low socio-economical status (SES). In other words, in accordance with this interpretation, it would not be realistic to expect that Roma students have the same achievements as non-Roma students since there have already been significant differences in their family background. This interpretation can be tested by comparison of achievements of Roma students with the achievement of the group of non-Roma students having the same SES as Roma students have. If only unfavorable conditions in which Roma students live are responsible for their lower achievements, then non-Roma students having the same SES as Roma students, would have the same achievements as Roma students have. In this case, it could be concluded that school provides equal quality of education both to Roma and nonRoma students, that is, it could be concluded that the education system and schools do not contribute to the gap between Roma and non-Roma students. Of course, even in this case, it would be quite justifiable to require from education to provide even higher quality of education to Roma students since the education is not only to provide equal education quality to everyone, but that children get the education quality which will meet their developmental and educational needs. To check this interpretation, additional analyses of the data on students’ achievements were made at the National Assessment Study in mathematics test. Taking into account the similarity of the results of Roma students in the Serbian 218
Development of Mathematical and Language Literacy among Roma students
language and mathematics, it may be assumed that the same findings would be obtained if the achievements in the Serbian language were additionally analyzed. Through additional analysis (ANCOVA with socioeconomic status as the covariate variable) the data on what would be the achievements of Roma and non-Roma students in the mathematics would be unless the students from these two groups would be different in terms of their family socioeconomic status (SES)4. The results of this additional analysis indicate that, in case there is no difference in terms of the SES between Roma and non-Roma families, there still would be the significant difference in the achievement of Roma and non-Roma students. Namely, the ANCOVA shows that there is a statistically significant effect of the SES (F=792.7; df=1,4125; p