Abstract— PQ analysis for detecting power line disturbances in real-time is one ...
a need for a robust and reliable algorithm that can work online for PQ analysis.
International Journal of Engineering Research and Development ISSN: 2278-067X, Volume 1, Issue 3 (June 2012), PP.37-44 www.ijerd.com
Development of Mathematical Models for Various PQ Signals and Its Validation for Power Quality Analysis Likhitha.R1, A.Manjunath2, E.Prathibha3 Department of EEE Sri Krishna Institute of Technology, Bangalore, Karnataka
Abstract— PQ analysis for detecting power line disturbances in real-time is one of the major challenging techniques that are being explored by many researchers. In order to understand the causes of electronic equipment being damaged due to disturbances in power line, there is a need for a robust and reliable algorithm that can work online for PQ analysis. PQ signal analysis carried out using transformation techniques have its own advantages and limitations, In this work, Mathematical models for various PQ signal disturbances is developed and validated against real time signal. Based on the mathematical models developed, performances of various transformation techniques are compared. Software reference models for transformation techniques are developed using MATLAB. The developed models are verified using various signal disturbances. Keywords— Power quality, Power system transients, discrete wavelet transforms. Lifting based wavelet transform.
I.
INTRODUCTION
In recent years power quality has became a significant issue for both utilities and customers. This power quality issue is primarily due to increase in use of solid state switching devices, non linear and power electronically switched loads, unbalanced power system, lighting controls, computer and data processing equipments as well as industrial plants rectifiers and inverters. PQ events such as sag, swell, transients, harmonics and flicker are the most common types of disturbances that occur in a power line. Sophisticated equipment’s connected to the power line are prone to these disturbances and are affected or get damaged due to disturbances that randomly occur for very short durations. Thus, it is required to estimate the presence of disturbance, and accurately classify the disturbances and also characterize the disturbances. In order to perform the tasks such as detection, classification and characterization, it is required to understand the basic properties of PQ events and their properties. In this section, PQ events (like sag, swell, transients, harmonics and flicker) and their properties are summarized.
II.
REPRESENTATION OF PQ SIGNALS AND THEIR PROPERTIES
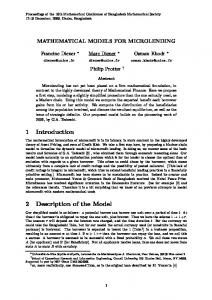
PQ signals such as sag, swell, transients, harmonics and flicker have some very basic properties in terms of signal amplitude and frequency as governed by standards ie 220 V and 50Hz signal. Variations in voltage levels and variations in frequencies lead to disturbances in PQ signal. Frequency variations in PQ signals introduce harmonics, random change in loads lead to transients, flicker, sag and swell. Figure.1 shows the different types of disturbances that occur in PQ signal. From Figure 1 we define the disturbances as follows [1-4]: Voltage variation: increase or reduction in the amplitude of the voltage normally caused by variations in the load. Voltage variation can be termed as swell or sag. Voltage sag: sudden reduction in the rms voltage to a value between 0.9 pu and 1pu of the declared value (usually the nominal value) and duration between 10 ms and 1 min. Voltage swells: sudden increase in the voltage to a value between 1.1 pu to 1.8 pu and duration between 10 ms to 1 min Transient: oscillatory or non-oscillatory over voltage with a maximum duration of several milliseconds. Flicker: intensity of the nuisance caused by the flicker, measured as defined by UIE-CEI and evaluated as: -Short term flicker (Pst) measured in 10 minutes period
Pst3 Plt i 1 12 12
-Long term flicker (Plt) defined as
3
Harmonics: sinusoidal voltage with a frequency which is a multiple of the fundamental frequency mainly caused by non linear loads.
37
Development of Mathematical Models for Various PQ Signals and Its Validation V
Sinusoidal
V
1 0 10 0. 0. 0. 0. 0 02 04 06 08 . Swell 1 V 2
Sag
1 0 10 0. 0. 0. 0. 0 02 04 06 08 . V Transient 1
0. 12
0. 12
2
0
0
0 0. 0. 0. 0. 0 2 V 02 04 06 08 . Flicker 1 1 0 10 0 0 0 0 . .Time . . 1 2 3 4
0 2 0. 0. 0. 0. 0 02 04 06 08 . V Harmonic 1 1 0 10 0. 0. 0. 0. 0 02 04Time 06 08 . 1
0. 12
0 . 5
0. 12
0. 12
[sec] representations of PQ signal [sec] Figure.1 graphical disturbances
III.
MATHEMATICAL MODELING OF PQ SIGNALS
Verification of software reference models for PQ analysis requires PQ signals; which are generated using software programs. In order to represent the real time signals accurately, mathematical equations are used to generate PQ Synthetic signals. Synthetic signals generated need to have all the properties of a real-time signal and should match the real-time signal in all aspects. Performance of PQ analysis techniques is dependent of PQ signals, hence it is required that the synthetic signals which are generated using software programs are accurately modeled. Development of software programs to generate PQ signal disturbances are governed by standard definitions [5-7] for events as given in Table 1 is generated. Table1. Mathematical Models of PQ Signals PQ disturbances Normal
Model x(t)=sin(ωt)
Parameters
swell
x(t)=A(1+α(u(t-t1)u(t-t2)))sin(ωt) t1