10648 • The Journal of Neuroscience, July 20, 2011 • 31(29):10648 –10665
Behavioral/Systems/Cognitive
Development of Multidimensional Representations of Task Phases in the Lateral Prefrontal Cortex Yosuke Saga,1,2 Michiyo Iba,1,3 Jun Tanji,1,4 and Eiji Hoshi1,2 1
Tamagawa University Brain Science Institute, Tokyo 194-8610, Japan, 2Frontal Lobe Project, Tokyo Metropolitan Institute of Medical Science, Tokyo 156-8506, Japan, 3Center for Neurodegenerative Disease Research, University of Pennsylvania, Philadelphia, Pennsylvania 19104, and 4Tohoku University Brain Science Center, Sendai 980-8577, Japan
The temporal structuring of multiple events is essential for the purposeful regulation of behavior. We investigated the role of the lateral prefrontal cortex (LPFC) in transforming external signals of multiple sensory modalities into information suitable for monitoring successive events across behavioral phases until an intended action is prompted and then initiated. We trained monkeys to receive a succession of 1 s visual, auditory, or tactile sensory signals separated by variable intervals and to then release a key as soon as the fourth signal appeared. Thus, the animals had to monitor and update information about the progress of the task upon receiving each signal preceding the key release in response to the fourth signal. We found that the initial, short-latency responses of LPFC neurons reflected primarily the sensory modality, rather than the phase or progress of the task. However, a task phase-selective response developed within 500 ms of signal reception, and information about the task phase was maintained throughout the presentation of successive cues. The task phase-selective activity was updated with the appearance of each cue until the planned action was initiated. The phase-selective activity of individual neurons reflected not merely a particular phase of the task but also multiple successive phases. Furthermore, we found combined representations of task phase and sensory modality in the activity of individual LPFC neurons. These properties suggest how information representing multiple phases of behavioral events develops in the LPFC to provide a basis for the temporal regulation of behavior.
Introduction The lateral prefrontal cortex (LPFC) possesses rich connections with posterior association areas (Barbas and Mesulam, 1985; Petrides and Pandya, 1999, 2002; Romanski et al., 1999b) and collects information about and controls motor behavior through interconnections with higher-order motor areas (Bates and Goldman-Rakic, 1993; Lu et al., 1994; Takada et al., 2004). This anatomical connectivity has been proposed as the means by which LPFC regulates the behavior according to diverse signals across sensory and motor domains (Wise and Murray, 2000; Miller and Cohen, 2001; Tanji and Hoshi, 2008). Moreover, the LPFC is thought to be essential for temporal structuring of behavior. Patients with LPFC lesions experience difficulties in serially organizing multiple actions (Shallice and Burgess, 1991) and judging temporal relationships among multiple events (Milner, 1982; Shimamura et al., 1990; McAndrews and Milner, 1991). Monkeys with lesions in the mid-dorsal LPFC Received Feb. 21, 2011; revised June 2, 2011; accepted June 7, 2011. Author contributions: Y.S., M.I., J.T., and E.H. designed research; Y.S., M.I., and E.H. performed research; Y.S. and E.H. contributed unpublished reagents/analytic tools; Y.S. and E.H. analyzed data; Y.S., J.T., and E.H. wrote the paper. Acknowledgments: This work was supported by Grant-in-Aid for Scientific Research (19300110, J.T.), Grant-inAid for Young Scientists (19670004, E.H.), and Takeda Science Foundation (E.H.). We thank members of the Tanji Laboratory for assistance and discussions and S. Hoffman for technical assistance. The authors declare no competing financial interests. Correspondence should be addressed to Dr. Eiji Hoshi, Frontal Lobe Project, Tokyo Metropolitan Institute of Medical Science, Kamikitazawa 2-1-6, Setagaya-ku, Tokyo 156-8506, Japan. E-mail:
[email protected]. DOI:10.1523/JNEUROSCI.0988-11.2011 Copyright © 2011 the authors 0270-6474/11/3110648-18$15.00/0
have shown deficits in performing tasks requiring the organization of the serial order of multiple items (Petrides, 1991a,b, 1995). Functional imaging studies in humans have shown LPFC activity in processing information about the temporal aspects of multiple events (Petrides, 1991a, 1995; Pochon et al., 2001; Konishi et al., 2002; Knutson et al., 2004; Amiez and Petrides, 2007). In line with these reports, LPFC neurons have been revealed to encode ordinal or rank position in a variety of visually guided motor behavior (Fujii and Graybiel, 2003; Hasegawa et al., 2004; Sigala et al., 2008; Berdyyeva and Olson, 2010). Furthermore, LPFC neurons are known to reflect specific combinations of spatial or object information and rank position (Barone and Joseph, 1989; Ninokura et al., 2004), information about forthcoming sequential movements (Averbeck et al., 2002, 2006), and multiple steps in future action plans (Mushiake et al., 2006; Shima et al., 2007). However, it remained unclear how individual LPFC neurons participate in processing a series of sensory signals for the purpose of structuring behavioral phases. Accordingly, we conducted this study to explore the role of LPFC in monitoring the occurrences of sensory signals of multiple modalities and in generating temporal information necessary to construct behavioral phases structured to generate a motor behavior at an appropriate timing. We intended to ask the following specific questions. (1) Is the behavioral-phase information generated in individual neurons in a modality-specific manner or commonly, regardless of sensory modalities? (2) What is the time relation between the occurrences of modality-selective sensory responses and the behavioral phase-selective activity? (3) Do individual LPFC neu-
Saga et al. • Task Phase Coding in the LPFC
J. Neurosci., July 20, 2011 • 31(29):10648 –10665 • 10649
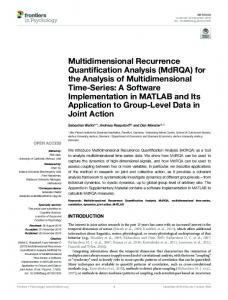
Figure 1. The temporal sequence of behavioral events, the recording site, and the behavior of monkeys. A, The top, middle, and bottom rows indicate the sequence of visual, auditory, and tactile trials, respectively.Signalsforasinglemodalitywerepresentedineachtrial,andthesensorymodalitywasalteredafterablockoffivetrials.Atrialcommencedwhenthemonkeypressedthebuttonwiththerighthand and gazed at the fixation point for ⬎0.6 s. Subsequently, a series of sensory signals of 1 s duration were delivered, separated by interstimulus intervals of 0.7–2.4 s. The animals were required to gaze at the fixation point for ⬎0.6 s before the onset of the second, third, and fourth cues. The animals were rewarded if they released the button within 1.0 s after the appearance of the fourth cue. B, Lateral view of the frontal cortex. Electrode penetrations covered the cortical area displayed with each shaded area (the lateral prefrontal cortex, LPFC, of the right hemisphere). AS, Arculate sulcus; CS, central sulcus; PS, principal sulcus. C–F, Magnetic resonance images. Scale bars, 10 mm. C, D, Images showing coronal slices at the levels of the rostral (C) and caudal LPFC (D). E, F, Images showing the lateral surface of the cerebral cortex ofMonkey1(E)andMonkey2(F).G,H,RelationshipoftheresponsetimetotheintervalbetweenthefirstcueonsetandthefourthcueonsetforMonkey1(G)andMonkey2(H).Fromlefttoright,dataofvisual, auditory, and tactile trials in randomly sampled 1000 successful trials are shown. At the bottom of each panel, the slope of the regression line is shown. Table 1. Reaction times for button release after the onset of the fourth cue Animal
Visual
Auditory
Tactile
Monkey 1 Monkey 2
318 ⫾ 37 276 ⫾ 42
309 ⫾ 39 280 ⫾ 59
311 ⫾ 39 251 ⫾ 37
Values are means and SDs in milliseconds, measured from the onset of the fourth cue to the release of the mechanical button.
rons represent a single task phase to be linked in a chain-like manner, or does each neuron represent multiple task phases in combination? (4) Are entire multiple phases continuously represented in single neurons, e.g., in a continuous fashion? We will
show that LPFC neurons represent rich information related to the reception of sensory signals and the monitoring of task sequences consisting of multiple phases before prompting the initiation of action. LPFC neurons initially represent modality-selective sensory signals but soon come to reflect task phase, ultimately encoding multiple phases of behavior as a whole in a multidimensional manner.
Materials and Methods Animals and experimental conditions. We used two monkeys (Macaca fuscata; one male weighing 7.0 kg and one female weighing 5.0 kg) who were cared for in accordance with the National Institutes of Health
Saga et al. • Task Phase Coding in the LPFC
10650 • J. Neurosci., July 20, 2011 • 31(29):10648 –10665
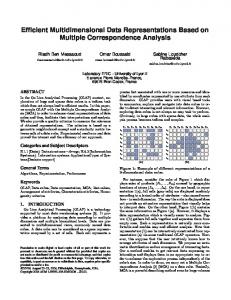
guidelines and the guidelines of Tamagawa University. During the experimental sessions, each monkey sat in a chair with her or his head and left arm restrained. We installed a button in front of the chair at waist level; the monkey pushed and released the button with his or her right hand. A 19 inch color video monitor was placed in front of the monkey (25 cm from the eyes) to display a fixation point (white square, 1.4° visual angle) and a visual cue (white square 10° ⫻ 10° superimposed on the fixation point). Vibrotactile sinusoidal stimuli (20 Hz) were delivered to the surface of the palm of the left hand by a mechanical stimulator (DIA Medical System). Two speakers placed bilaterally in front of the monkey produced a pure tone of 500 Hz (60 dB), serving as an auditory cue. Eye positions were monitored at 120 Hz with an infrared eye-tracking system (resolution, 0.25° visual angle; RHS-M, Applied Science Laboratories). The TEMPONET system (Reflective Computing) was used to control the behavioral task and save data for offline analyses at 1000 Hz. Behavioral task. We devised a behavioral task that involved the monkeys’ receiving a series of sensory signals in a single modality (visual, auditory, or tactile) and responding by releasing a button when a fourth signal appeared (Fig. 1 A). After an intertrial interval of 2500 – 4500 ms, a trial commenced when the monkey pushed the button with the right hand and gazed at the fixation point that appeared at the center of the screen. When the monkey maintained fixation on the fixation point for ⱖ600 ms, the first cue was presented for 1000 ms and was followed by a randomly selected delay period, during which only the fixation point was visible. Subsequently, the second, third, and fourth cues were presented for 1000 ms each after a delay period. During the intertrial interval, the computer controlling the behavioral task randomly chose minimum durations of the first, second, and third delay periods in the next trial from values ranging from 700 to 2400 ms. The second, third, or fourth cue was presented if the monkey had already fulfilled the fixation requirement of ⱖ 600 ms at the end of the minimum delay period. If not, the cue presentation was postponed until the fixation requirement was satisfied. Thus, the lower limit of the actual delay period was 700 ms, and its upper limit could take any value. The actual durations of the delay period during the task performance were widely distributed between 4 Figure 2. Early cue-responses. A–C, Three examples of neurons with early cue responses shown in A (visual neuron), B (auditory neuron), and C (tactile neuron). Rasters and spike– density functions (smoothed using a Gaussian kernel; ⫽ 10 ms) indicate activity sorted according to the onset of the first, second, third, and fourth cues. The red-, green-, and blue-colored raster displays and spike– density functions represent the activities in the visual, auditory, and tactile trials, respectively. The ordinate represents the instantaneous firing rate (in spikes/s). The gray area indicates the 1 s period during which each cue was presented. Because the fourth cue was terminated immediately after the animal released the button, the gray area of the fourth cue was drawn based on the average reaction time. The reward was delivered for about 100 ms at 500 ms after button release. The tick marks on the horizontal axis are placed at 1 s intervals. D–F, Population-level activities of neurons with early cue responses after the appearance of cues. Red line, Responses in visual trials; green line, responses in auditory trials; blue line, responses in tactile trials. D, Activity of visual neurons (n ⫽ 130). E, Activity of auditory neurons (n ⫽ 44). F, Activity of tactile neurons (n ⫽ 69). D⬘–F⬘, Normalized population-level responses to the second, third, and fourth cues were calculated with reference to the activity after the first cue in
each group of neurons (mean ⫾ SEM). D⬘, Visual neurons (n ⫽ 130). E⬘, Auditory neurons (n ⫽ 44). F⬘, Tactile neurons (n ⫽ 69). Asterisk (*) indicates activity significantly differed from that after the onset of the first cue (paired t test, p ⬍ 0.01). G–I, The spatial distribution of visual (G, n ⫽ 130), auditory (H, n ⫽ 44), and tactile neurons (I, n ⫽ 69) are displayed by overlaying the data from the two animals with reference to the principal sulcus and its caudal end. Each dot indicates a neuron. Electrode penetrations covered the cortical area displayed with each shaded area. The asterisk (*) indicates that the tactile neurons were clustered differently from the visual and auditory neurons (MANOVA, p ⬍ 0.01).
Saga et al. • Task Phase Coding in the LPFC
700 and 2400 ms in ⱖ 88% cases in both monkeys, and the delay period was ⬎2400 ms in the remaining cases. Thus, we designed the task to progress when the monkey gazed at the fixation point for ⱖ 600 ms immediately before the onset of each cue, which ensured that the gaze was maintained on the fixation point when each cue was delivered. If the monkey released the button while the fourth cue was presented for 1000 ms, the cue terminated immediately, and a drop of liquid reward was delivered 500 ms later. A visual, auditory, or tactile stimulus was used as a cue in each trial. The sensory modality used as a cue was altered every five trials. If the monkey released the button before the fourth cue appeared (premature release error) or if the monkey failed to release the button while the fourth cue was presented (belated error), the trial was terminated as an error trial and an intertrial interval was initiated. Surgery and physiological recording. After completing the behavioral training, aseptic surgery was performed under pentobarbital sodium anesthesia (25 mg/kg i.v.) with atropine sulfate. Antibiotics and analgesics were used to prevent postsurgical infection and pain. Polycarbonate screws were implanted in the skull, and two plastic pipes, rigidly attached with acrylic resin, were used to securely fix the head during the daily recording session. A part of the skull over LPFC was removed, and a recording chamber was implanted. Neuronal activity was recorded with glass-insulated Elgiloy alloy microelectrodes (0.5–2.0 M⍀ at 1 kHz) that were inserted through the dura mater using a hydraulic microdrive (MO81-S, Narishige). Single-unit potentials were amplified with a multichannel processor and sorted using a multispike detector (MCP Plus 8 and ASD, Alpha Omega Engineering). We recorded neuronal activity from LPFC in the right hemisphere (Fig. 1 B). Recording sites, first determined by observing the principal and arcuate sulci during craniotomy, were verified by examining magnetic resonance images (1.5 T; Sonata, Siemens) taken after the recording chamber was implanted (Fig. 1C– F ). The recording sites were rostral to the frontal eye field, where saccadic eye movements were evoked by intracortical microstimulation applied through the tip of an inserted electrode (11 cathode pulses; 200 s pulse width at 333 Hz; current, ⬍50 A; SS-203J, SEN-3401, Nihon Kohden). Data analyses. To detect task-related neuronal activity, we initially counted the number of spikes in 10 successive 200 ms bins before and after the onset of each of the four sensory cues (five bins before and five bins after the onset of each cue), yielding an array of firing rates consisting of 40 bins (i.e., 10 ⫻ 4 cues) for the trials in each modality. The array of the trials in each sensory modality was constructed separately. We defined a neuron as “task-related” if the distribution of discharge rates differed significantly in at least one of the three sensory modalities across the 40 bins (one-way ANOVA, p ⬍ 0.01, not corrected). Two-way ANOVA. To analyze the response selectivity of the taskrelated neurons, we used a two-way ANOVA (␣ ⫽ 0.01) with two main factors: the sensory “modality” (visual, auditory, and tactile) and the “phase” position (first, second, third, or fourth cue). We conducted separate analyses for the activity in two periods: 1) the cue period (from 50 to 550 ms after cue onset) and 2) the delay period (the 500 ms period before cue onset). Based on the results of the two-way ANOVA, we classified neuronal selectivity into four categories: selective for modality (modality ⬍ 0.01, phase ⬎ 0.01, modalityⴱphase ⬎ 0.01), selective for phase (modality ⬎ 0.01, phase ⬍ 0.01, modalityⴱphase ⬎ 0.01), selective for both (modality ⬎ 0.01 and phase ⬎ 0.01, or modalityⴱphase ⬍ 0.01), and selective for neither (modality ⬎ 0.01, phase ⬎ 0.01, modalityⴱphase ⬎ 0.01). We performed Tukey’s HSD (p ⬍ 0.01) test on modality-selective neurons to examine responses to the three sensory modalities. If activity was greater in one modality than in the other two modalities, the neuron was classified as a unimodal neuron. Using Tukey’s HSD (p ⬍ 0.01) test with four elements (first cue, second cue, third cue, and fourth cue) on phase-selective neurons, we classified neurons as phase selective for a single phase (activity was greater in one phase than in the remaining three), selective for two successive phases (activity was greater in two successive phases than in the remaining two), or selective for three successive phases (activity was greater in three successive phases than in the remaining one). Early cue–response. To detect the activity of neurons that responded to the onset of the cue (i.e., the early cue response), we initially counted the
J. Neurosci., July 20, 2011 • 31(29):10648 –10665 • 10651
Table 2. Distribution of response selectivity classified by ANOVA Selectivity Task period
Modality
Combination
Phase
Nonselective
Cue period Delay period
303 (18%) 224 (14%)
553 (33%) 279 (17%)
498 (30%) 550 (33%)
305 (18%) 606 (37%)
The number of neurons in each class is displayed. Parentheses enclose the percentages of the total number of neurons (n ⫽ 1659).
number of spikes in every 20 ms bin during the 200 ms period before cue onset (10 bins in total) and in the 220 ms period after cue onset (11 bins in total). We subsequently compared the distributions of firing rates for each 20 ms bin after cue onset with those of the 10 bins before cue onset using a Mann–Whitney U test. When the activity after cue onset initially became significantly greater than that during the precue period (p ⬍ 0.01) in two consecutive bins, response latency was determined by observing the central position of the first bin. This analysis was conducted separately for trials in each sensory modality. Detection of activity latency. To uniformly determine the latency of the activity modulation for population of neurons, as well as for each neuron, we applied an analysis different from that described above. We sought the initial point in time during the 20 ms period when the spike density function (smoothed with a Gaussian kernel, ⫽ 10 ms) exceeded a threshold, defined as the baseline activity (the 100 ms period before cue onset) plus half the maximum modulation above this value during cue presentation. We judged that this method would provide a more reliable measure, because the number of neurons in a group does not affect the sensitivity in detecting the activity latency.
Results We trained two monkeys to release a button with their right hands when they received the fourth in a series of visual, auditory, or tactile sensory cues (Fig. 1 A). Because each cue was presented for 1 s, the animals were required to release the button within 1 s after the onset of the fourth cue. The animals achieved success rates of 95.0% (Monkey 1) and 92.4% (Monkey 2). Analysis of the reaction times for the button release in successful trials revealed that the animals released the button promptly in response to the appearance of the fourth cue (Table 1). We subsequently investigated the extent to which the monkeys’ performances were influenced by the total duration of the delays. First, we examined the effect of the interval between the first cue onset and the fourth cue onset on the reaction times in successful trials (Fig. 1G,H ). We found that the effect, if any, was minimal because the slope of the regression line was ⬍⫾10 ms per second. (If the monkeys had employed the timing strategy, the slope would have been close to ⫺1000 ms per second.) Second, we asked whether the tendency for the animal to release the button prematurely in response to the third cue was related to the interval between the onsets of the first cue and the third cue. By examining the occurrences of the premature errors against the intervals, we found that the success rate was ⬎90% at any interval in both monkeys. Altogether, these results indicated that the monkeys did not employ the timing strategy to perform the task, whereas they relied on the appearance of the four sensory signals. While the monkeys performed the behavioral task, we recorded the neuronal activity in the LPFC of the right hemisphere (Fig. 1 B–F ) opposite to the left hand, to which the vibrotactile stimuli were delivered, and ipsilateral to the right hand, with which the animal pressed and released the button. We found task-related activity in 1659 LPFC neurons (n ⫽ 1110 in Monkey 1 and 549 in Monkey 2). The following three sections will describe the response properties of neurons in the LPFC. First, we will focus on the retrieval and maintenance of sensory signals in each modality and show that the distribution of unimodal neu-
Saga et al. • Task Phase Coding in the LPFC
10652 • J. Neurosci., July 20, 2011 • 31(29):10648 –10665
rons after cue onset was consistent with the anatomical organization of the prefrontal connections with the sensory association areas. Second, we will show three types of task phase representations in the LPFC that demonstrated robust and continuous representations of the whole task. Third, we will show that the arrival of the sensory signal preceded the rapid development of the task phase coding that was used for the timely initiation of the behavioral response. Retrieval and maintenance of sensory signals To investigate the retrieval and maintenance of sensory signals in each modality, we applied two analyses in parallel. The first analysis examined the timing when LPFC neurons began to reflect the onset of sensory signals. We focused on the activity in the short period after the first cue onset (ⱕ 200 ms). The activity that began in this period was called “early cue responses” and was considered to reflect the initial retrieval of sensory signals by LPFC neurons. We analyzed the activity with the temporal resolution of 20 ms (Yamagata et al., 2009). The 20 ms bins were used because the resolution was high enough while it was possible to reliably detect the activity onset even in neurons with responses of fairly short duration. The second analysis examined the representations of sensory signals and task phases during the cue and delay periods. Because the monkeys gazed at the fixation point for ⱖ600 ms immediately before the onset of each cue, we chose the last 500 ms of each delay period as an analysis window of the “delay period” activity. To directly compare the selectivity between the cue period and the delay period in each neuron, another 500 ms window (50 –550 ms after the onset of each cue) was used for the analysis of the cue period activity. We will describe results of the two analyses in the following sections.
Figure 3. Population-level activities and normalized responses of unimodal neurons. A–C, Population-level activities of neurons with unimodal responses in the cue period. Activities are presented separately for visual neurons (A, n ⫽ 94), auditory neurons (B, n ⫽ 9), and tactile neurons (C, n ⫽ 19). The red-, green-, and blue-colored spike– density functions (smoothed using a Gaussian kernel; ⫽ 10 ms) representactivitiesinthevisual,auditory,andtactiletrials,respectively.Theordinaterepresentstheinstantaneousfiringrate(inspikes/s). The gray area of the first to third cues indicates the 1 s period during which each cue was presented. That of the fourth cue was trimmed at theaveragedresponsetimeoftheanimals.Therewardwasdelivered500msafterbuttonrelease.Thetickmarksonthehorizontalaxisare placed at 1 s intervals. The horizontal bars at the bottom of each panel indicate the cue periods (50 –550 ms after cue onset). D–F, Population-level activities of neurons with unimodal responses in the delay period. The figures are displayed as in (A–C). Activities are presented separately for visual neurons (D, n ⫽ 26), auditory neurons (E, n ⫽ 10), and tactile neurons (F, n ⫽ 11). The horizontal bars at the bottom of each panel indicate the delay periods (500 ms before cue onset). A⬘-C⬘, Normalized activity (⫾ SEM) of the unimodal neurons in the cue period. Activities of neurons preferring the visual cue (A⬘), the auditory cue (B⬘), and the tactile cue (C⬘) during the cue period are displayed separately. Red, Visual trials; green, auditory trials; blue, tactile trials. D⬘-F⬘, Normalized activity (⫾ SEM) of the unimodalneuronsinthedelayperiod.Activityofneuronspreferringthevisualcue(D⬘),theauditorycue(E⬘),andthetactilecue(F⬘)inthe delay period are displayed separately. Red, Visual trials; green, auditory trials; blue, tactile trials.
Selectivity for modality versus task phase in early cue responses We first addressed neuronal activity that responded with short latency to the cue onsets. Because we noticed that the duration of the auditory sensory response is fairly short, here we used an analysis suitable for detecting the onset of neuronal activity (see Materials and Methods for the definition of the early cue response). We found that 291 neurons exhibited early responses to the appearance of the first cue. Three examples of early cue responses are illustrated in Figure 2 A–C. This figure shows that a majority (84%, n ⫽ 243) of early cue responses were
unimodal, responding selectively to the appearance of a visual (n ⫽ 130, Fig. 2 A), auditory (n ⫽ 44, Fig. 2 B), or tactile (n ⫽ 69, Fig. 2C) cue. The population-level activity of each group of unimodal neurons is illustrated in Figure 2 D–F. Thirty-nine of the
Saga et al. • Task Phase Coding in the LPFC
remaining neurons responded to two sensory modalities, and nine responded to three sensory modalities. We examined the task phase selectivity of these early cue responses. For this purpose, we first calculated the population-level activity of each group of unimodal neurons. The magnitude of the responses was quantified by calculating each neuron’s normalized responses to the second, third, and fourth cues relative to their responses to the first cue using a measure of the maximum discharge rate during the 200 ms period after onset of the cues. We found that the magnitude of activity after the onset of the second to fourth cues did not differ from that after the onset of the first cue in visual (Fig. 2 D⬘), auditory (Fig. 2 E⬘), and tactile neurons (Fig. 2 F⬘) (paired t test, p ⱖ 0.01), with the exception of the responses of the tactile neurons to the third cue (Fig. 2 F⬘). We then studied the task phase selectivity of bimodal and trimodal neurons by applying the same analysis to the early cue response to the appearance of each sensory modality. In both bimodal (n ⫽ 39) and trimodal neurons (n ⫽ 9), the magnitude of the activity after the onset of the second to fourth cues did not differ from that of the activity after the onset of the first cue (paired t test, p ⬎ 0.3). These findings indicated that the short latency responses to sensory cues were, in general, not selective for the task phase. The spatial distributions of neurons with visual, auditory, and tactile early cue responses are illustrated in Figure 2G–I. The visual (Fig. 2G) and auditory neurons (Fig. 2 H) were widely distributed in the caudal sector of the LPFC. By contrast, the tactile neurons (Fig. 2 I) were more often found in the ventrorostral region. We found that the tactile neurons (Fig. 2 I) were clustered differently from the visual and auditory neurons [The multiple ANOVA (MANOVA) with two dependent variables of anterior– posterior and medial–lateral positions of each neuron and a single independent variable of the selectivity, p ⬍ 0.01]. In the area ventral to the principal sulcus, the tactile neurons were located more rostral than were the visual neurons (Kolmogorov–Smirnov Test applied to the distribution function about the anterior– posterior position of the neurons, p ⬍ 0.01). Modality-selective responses during the cue and delay periods In the previous section, we focused on the onset of the neuronal activity after the appearance of the sensory cue. Separately from that analysis, here we investigated the representation of the sensory–modality selectivity and the task phase selectivity. For this purpose, the two-way ANOVA was used to identify activity selective for the task phase and/or the sensory modality (see Materials and Methods). This analysis allowed us to systematically analyze the effects of multiple behavioral factors on the neuronal activity. The activity was separately analyzed during the cue period (50 – 550 ms after cue onset) and the delay-period (500 ms before cue onset). The time window of the delay period was chosen because we wanted to detect the sustained representation of the task phase between successive cues. Although the activity before the appearance of the first cue corresponds to the “anticipatory” activity (Mauritz and Wise, 1986), here we used the term “pre-first cue delay” because the activity may encode the task phase (i.e., the period preceding the first cue appearance), given that the monkeys gazed at the fixation point waiting for the cue appearance as in other delay periods. During the cue period, 18% (n ⫽ 303) of the neurons showed selectivity only for the sensory modality, whereas 14% (n ⫽ 224) showed selectivity for this modality only during the delay period (Table 2). Fewer neurons were selective for modality during the delay than during the cue period ( 2 test, p ⬍ 0.0003). Of the 303 neurons selective for the sensory modality only during the cue
J. Neurosci., July 20, 2011 • 31(29):10648 –10665 • 10653
Figure 4. A, B, Cortical surface map displaying the distribution of neurons with unimodal responses. The top row (A) shows the distribution of unimodal neurons in the cue period. The asterisk indicates that the tactile neurons were clustered differently from the visual and auditory neurons (MANOVA, p ⬍ 0.01). The bottom row (B) shows the distribution of unimodal neurons in the delay period. Each panel shows the distributions of visual, auditory, and tactile neurons, respectively, from left to right. Data from the two animals were overlaid according to the principal sulcus and its caudal end. Electrode penetrations covered the cortical area displayed with each shaded area. Table 3. Comparison of response selectivity between cue and delay periods Delay period Cue period
Modality
Phase
Combination
Nonselective
Total
Modality Phase Combination Nonselective Total
79 34 57 54 224
36 211 179 124 550
27 43 161 48 279
161 210 156 79 606
303 498 553 305 1659
Each cell indicates the number of neurons sorted according to selectivity in the cue and delay periods.
period, 94, 9, and 19 were found to be significantly more active in the visual, auditory, and tactile trials, respectively, than in trials with the remaining two modalities (Tukey’s HSD test, p ⬍ 0.01). The population-level activity of each group of neurons, shown in Figure 3A (visual neurons) and Figure 3C (tactile neurons), revealed that these neurons responded to the appearance of a specific sensory modality. By contrast, the auditory neurons (Fig. 3B) seemed not to show phasic responses. However, this apparent unresponsiveness was attributable to our inability to detect the activity within the time window of 500 ms given that the duration of the sensory responses of the auditory neurons was generally very short, as exemplified in Figure 2, B and E. This contrast in response duration suggests that the mode of information encoding used by auditory versus visual or tactile neurons differs. To examine the magnitude of selectivity at the population level, the activity of each unimodal neuron was normalized with respect to the activity in the modality and phase with the highest discharge rates, which were subsequently averaged across neurons in each group. The results of these analyses are shown in Figure 3A⬘ (visual neurons), Figure 3B⬘ (auditory neurons), and Figure 3C⬘ (tactile neurons), which show that activity in the preferred sensory modality was twofold greater than that in the other modalities.
Saga et al. • Task Phase Coding in the LPFC
10654 • J. Neurosci., July 20, 2011 • 31(29):10648 –10665
During the delay period, 26, 10, and 11 neurons of the 224 modality-selective neurons were more active in the visual, auditory, and tactile trials, respectively (Tukey’s HSD test, p ⬍ 0.01). The population-level activity of each group of neurons is shown in Figure 3D (visual neurons), Figure 3E (auditory neurons), and Figure 3F (tactile neurons), and the degree of population-level activity is shown in Figure 3D⬘ (visual neurons), Figure 3E⬘ (auditory neurons), and Figure 3F⬘ (tactile neurons), which again reveal that activity was 1.5- to 2-fold greater in the preferred sensory modality. Neurons that were modality selective in the cue (Fig. 4 A) or delay (Fig. 4 B) period were distributed widely in the LPFC, with a tendency for tactileselective neurons to be located more anterior in the area ventral to the principal sulcus. In the cue period (Fig. 4 A), the tactile neurons were clustered differently from the visual and auditory neurons (MANOVA, p ⬍ 0.01), with the tactile neurons located more rostral than the visual neurons in the area ventral to the principal sulcus (Kolmogorov–Smirnov test, p ⬍ 0.01). The analyses described above revealed that subsets of LPFC neurons promptly retrieved the sensory signals after cue onset and then maintained the sensory information during the delay period. In this study, we further found that LPFC neurons encoded much information concerning the task phase in addition to that concerning the sensory signals themselves. In the following section, we will describe three types of task phase representations in the LPFC.
Figure 5. Four examples of the phase-selective neuronal activity in the cue period. Rasters and spike-density functions (smoothed using a Gaussian kernel; ⫽ 10 ms) indicate activity sorted according to the onset of each cue. The red-, green-, and blue-colored raster displays and spike– density functions represent the activities in the visual, auditory, and tactile trials, respectively. The ordinate represents the instantaneous firing rate (in spikes/s). The gray area indicates the 1 s period during which each cue was presented. The gray area for the fourth cue was trimmed at the average response time of animals. The reward was delivered 500 ms after button release. The tick marks on the horizontal axis were placed at 1 s intervals. A, Activity of a first cue-selective neuron. B, Activity of a second cue-selective neuron. C, Activity of a third cue-selective neuron. D, Activity of a fourth cue-selective neuron.
Development and maintenance of task phase selectivity during the cue and delay periods We examined the task phase selectivity of neuronal responses during the cue and delay periods by conducting a two-way ANOVA on cue period (50 –550 ms after cue onset) and delayperiod (500 ms before cue onset) activity. During the cue period, 30% (n ⫽ 498) of the responsive neurons were selective for only the task phase, and 33% (n ⫽ 553) were selective for both the task phase and the sensory modality (Table 2). During the delay period, 33% (n ⫽ 550) of responsive neurons were selective for only the task phase, and 17% (n ⫽ 279) were selective for both the task phase and the sensory modality (Table 2). Fewer neurons were selective for combinations of modality and phase during the delay period than during the cue period (p ⬍ 0.0001), and the number of neurons selective for phase did not differ according to period (p ⫽ 0.0568). Examination of the proportion of neurons with either phase or modality selectivity during the two task periods (Table 3) revealed the following. (1) Of the modality-selective neurons in the cue period (n ⫽ 303, the top row in Table 3), 53% (n ⫽ 161) turned into nonselective neurons in the delay period; the fraction of the nonselective neurons was greater than that of neurons
remaining in the same category (i.e., modality-selective, n ⫽ 79; Binomial test, p ⬍ 0.0001). (2) Of the phase-selective neurons in the cue period (n ⫽ 498, the second row in Table 3), 42% (n ⫽ 211) remained in the same class during the delay period. This fraction was greater than the fraction of neurons remaining in the same category in the other three groups ( 2 test, p ⬍ 0.0001). (3) Of the 553 combination-selective neurons in the cue period (the third row in Table 3), 32% (n ⫽ 179) turned into phase-selective neurons and 29% (n ⫽ 161) remained in the same category. These fractions were greater than the fraction of neurons turning into the modality-selective neurons (n ⫽ 57; binomial test, p ⬍ 0.0001). (4) Nonselective neurons in the cue period (n ⫽ 305, the fourth row in Table 3) tended to become phase-selective neurons in the delay period (n ⫽ 124, 41%; 2 test, p ⬍ 0.0001). These four observations revealed that the information reflecting task phase tended to increase from the cue to the delay period, indicating that task phase coding was developing into the dominant representation among LPFC neurons. In the following sections, we will describe three classes of phase coding found in the LPFC:
Saga et al. • Task Phase Coding in the LPFC
J. Neurosci., July 20, 2011 • 31(29):10648 –10665 • 10655
Figure 6. Population-level activities and normalized responses of phase-selective neurons. A–D, Population-level activities of neurons with phase-selective responses in the cue period. The format is the same as that used in Figure 3. Red, Visual trials; green, auditory trials; blue, tactile trials. Activity of neurons preferring the first cue (A, n ⫽ 39), the second cue (B, n ⫽ 16), the third cue (C, n ⫽ 20), and the fourth cue (D, n ⫽ 43) are shown separately. E–H, Population-level activities of phase-selective neurons in the delay period. Activity of neurons preferring the pre-first delay (E, n ⫽ 73), the first delay (F, n ⫽ 9), the second delay (G, n ⫽ 17), and the third delay (H, n ⫽ 20) are shown separately. A⬘–H⬘, Normalized activity (⫾ SEM) of phase-selective neurons in the cue period. Activity preferring the first cue (A⬘), the second cue (B⬘), the third cue (C⬘), and the fourth cue (D⬘) are displayed separately. E⬘–H⬘. Normalized activity of phase-selective neurons preferring the pre-first cue (E⬘), the first delay (F⬘), the second delay (G⬘), and the third delay (H⬘) in the delay period.
single-phase coding, two- or three-phase coding, and modality and phase coding. Single-phase coding During the cue period, 498 neurons exhibited selectivity for the task phase but not the modality; of these, 118 (24%) preferred a single phase (Tukey’s HSD test, p ⬍ 0.01). Figure 5 shows four examples of neurons that were preferentially active in response to the first (Fig. 5A), second (Fig. 5B), third (Fig. 5C), or fourth (Fig. 5D) cue, regardless of sensory modality. Preferences were distributed across the four cue periods (39 during the first cue, 16 during the second, 20 during the third, and 43 during the fourth). The population-level activity of each group of single-phase selective neurons is illustrated in Figure 6 A–D. The prompt development of the task phase-selective activity in response to one of the individual cues with a sharp preference for one of the four phases indicates the potency of LPFC neurons in providing phasespecific information. During the delay period, single-phase selective activity was observed in 119 of the 550 phase-selective neurons. Figure 7 shows four examples of neurons that were preferentially active in
the pre-first cue delay (Fig. 7A), the first delay (Fig. 7B), the second delay (Fig. 7C), and the third delay (Fig. 7D) regardless of sensory modality. The preferences of neurons were distributed across the four delay periods (73 during the pre-first cue delay, nine during the first delay, 17 during the second delay, and 20 during the third delay; Tukey’s HSD test, p ⬍ 0.01). The population-level activity of single-phase selective neurons during the delay period is displayed in Figure 6 E–H. The phase-selective activity during the delay period was characterized by its long duration, which prompted us to examine the duration of activity and to identify its beginning and end according to each cue. The activity onset was determined by identifying when the population-level activity exceeded a threshold, defined as baseline activity (the 100 ms period before cue onset) plus half the maximum modulation above this value during the last 100 ms of the subsequent delay period. The activity offset was determined by identifying when the population-level activity fell below a threshold, defined as baseline activity (the 100 ms period before cue onset) minus half the maximum modulation below this value during the last
10656 • J. Neurosci., July 20, 2011 • 31(29):10648 –10665
Saga et al. • Task Phase Coding in the LPFC
100 ms of the subsequent delay period. The onset latency, measured from the onset of the cue preceding the delay, ranged from 243 to 618 ms (Table 4). The offset latency ranged from 283 to 748 ms after the onset of the next cue that appeared during the later part of the delay (Table 4). This analysis indicated that the single-phase-selective delay-period activity encompassed a time period sufficiently long enough to link the two successive cue periods. To examine the magnitudes of the selectivity during the cue and delay periods, we normalized the activity of each singlephase neuron relative to its activity in the phase with the highest discharge rates. The normalized activity of each neuron was subsequently averaged across neurons in each group. The normalized population-level responses during the cue (Fig. 6 A⬘–D⬘) and delay (Fig. 6 E⬘– H⬘) periods revealed that the responses representing the preferred phase were twofold greater than those during other phases. Neurons displaying singlephase selectivity were distributed widely in both the dorsal and ventral aspects of the LPFC (Fig. 8 A, top row, for the cue period; Fig. 8 B, top row, for the delay period). We did not find any clustering of neurons classified in each group (MANOVA, p ⬎ 0.05). Two-phase and three-phase coding We identified the second group of task phase-selective neurons whose activity sig- Figure 7. Four examples of phase-selective neuronal activity in the delay period. The display format is the same as that used in naled the occurrence of two or three succes- Figure 5. A, Activity of a pre-first cue-selective neuron. B, Activity of a first delay-selective neuron. C, Activity of a second delaysive phases in combination. This property selective neuron. D, Activity of a third delay-selective neuron. was thought to be useful for binding Table 4. Onset and offset latency of single-phase-selective delay responses multiple task phases. Of the 498 neurons showing phase selecPhase selectivity tivity in the cue period, 25 also showed elevated activity during two successive cue periods (two-phase coding in the cue peTrial Pre-1st cue 1st delay 2nd delay 3rd delay riod; Tukey’s HSD test, p ⬍ 0.01) and 30 showed elevated Visual trial activity during three successive cue periods (three-phase codOnset 243 550 252 ing in the cue period; Tukey’s HSD test, p ⬍ 0.01). Of the 25 Offset 495 484 353 617 two-phase coding neurons, seven responded to the first and Auditory trial Onset 609 602 618 the second cues (Fig. 9 A, A⬘), 11 responded to the second and Offset 538 571 346 631 third cues (Fig. 9 B, B⬘), and seven responded to the third and Tactile trial fourth cues (Fig. 9C,C⬘). Of the 30 three-phase coding neuOnset 531 594 497 rons, 24 were active from the first to the third cues (Fig. Offset 540 748 283 643 9 D, D⬘, n ⫽ 24), and six were active from the second to the Data are in milliseconds. fourth cues (Fig. 9 E, E⬘). Of the 550 neurons with phase selectivity during the delay period, 24 showed elevated activity during two successive delay Of the 52 three-phase coding neurons, 20 were active from the periods (two-phase coding in the delay period; Tukey’s HSD test, pre-first delay to the second delay periods (Fig. 9 I, I⬘), and 32 p ⬍ 0.01) and 52 showed elevated activity during three successive were active from the first to the third delay periods (Fig. 9 J, J⬘). periods (three-phase coding in the delay period; Tukey’s HSD These neurons were distributed widely in both the dorsal and test, p ⬍ 0.01). Of the 24 two-phase coding neurons, five showed ventral aspects of the LPFC (Fig. 8 A presents the cue-periodelevated activity during the pre-first cue and first delay periods selective, and Fig. 8 B presents the delay-period-selective neu(Fig. 9 F, F⬘), 11 showed elevated activity during the first and rons; the middle row shows two-phase neurons, and the bottom second delay periods (Fig. 9G,G⬘), and eight showed elevated row shows three-phase neurons). We did not find any clustering of neurons classified in each group (MANOVA, p ⬎ 0.05). activity during the second and third delay periods (Fig. 9 H, H⬘).
Saga et al. • Task Phase Coding in the LPFC
J. Neurosci., July 20, 2011 • 31(29):10648 –10665 • 10657
third delay period in the visual trials. The activity of the neuron in Figure 10 B was greater in the first, second, and third delay periods during the auditory trials and also responded most strongly to the fourth auditory cue. The neuron displayed in Figure 10C showed greater discharge rates from the first to the second cues of the tactile trials. To examine the response profiles of neurons selective for combinations, we classified neurons according to the combination of the modality and phase that led to the highest discharge rate (Table 5). The population-level activity and the quantification of the activity (normalized responses) for each group of neurons during the cue period are shown in Figure 11, and those during the delay period are presented in Figure 12. These analyses indicated that every combination of phase and sensory modality was represented by LPFC neurons during both cue and delay periods. Modality- and-phase-coding neurons appeared widely in both the dorsal and ventral aspects of the LPFC when we examined both the cue (Fig. 13A) and delay (Fig. 13B) periods. We did not find any clustering of neurons classified in each group (MANOVA, p ⬎ 0.05). These results revealed that LPFC neurons were involved in encoding the phase in conjunction with the sensory modality. Development of task phase selectivity after the arrival of the sensory signal To investigate the temporal relationship between activity reflecting the modality of the sensory signals and that reflecting the task phase, we analyzed the onset activity of neurons in three groups of neurons possessing the following: (1) early cue responses with unimodal selectivity, (2) single phase-selective responses during the cue period; and (3) responses selective for combinations of modality and phase Figure 8. Cortical surface map displaying the distribution of neurons with phase-selective responses in the cue period (A) and during the cue period (see Materials delay period (B). A, B, The top row shows the distribution of neurons with preference for a single phase. The middle row shows the and Methods, Detection of activity ladistribution of neurons with preference for two successive phases. The bottom row shows the distribution of neurons with tency). We compared the cumulative dispreference for the three successive phases. The preference is indicated on top of each panel. tributions of the neuron latency in the modality-selective, phase-selective, and combination-selective categories (Fig. 14). Modality and phase coding In addition to the single-phase and the two- and three-phase The median latencies are summarized in Table 6. In the visual coding, a third type of task phase coding, in which the represen(Fig. 14 A), auditory (Fig. 14 B), and tactile (Fig. 14C) trials, neutation of the task phase was combined with that of the sensory rons with modality-selective early cue responses began to dismodality, was also observed. charge earlier than did phase-selective neurons after the Analysis using a two-way ANOVA revealed that 553 neuappearance of every cue (Kolmogorov–Smirnov Test, p ⬍ 0.05, rons were selective for a specific combination of modality and except for the responses to the third cues in the auditory triphase during the cue period, and 279 neurons exhibited this als), revealing that activity reflecting the modality of sensory selectivity during the delay period (Table 2). Three examples signals began earlier than did task phase-selective activity. We then of neuronal activity of this sort are shown in Figure 10 A–C. compared the onset latency of the combination-selective neurons The neuron in Figure 10 A was selectively active during the with that of the modality- and phase-selective neurons. Al-
10658 • J. Neurosci., July 20, 2011 • 31(29):10648 –10665
Saga et al. • Task Phase Coding in the LPFC
Figure 9. Population-level activities and normalized responses of phase-selective neurons with elevated activity in successive task phases. The display format is the same as that used in Figure 6. A–C⬘, Population-level activities (A–C) and normalized responses (A⬘–C⬘) of neurons with two successive phase-selective responses in the cue period. A, A⬘, First and second cue-selective responses (n ⫽ 7). B, B⬘, Second and third cue-selective responses (n ⫽ 11). C, C⬘, Third and fourth cue-selective responses (n ⫽ 7). D–E⬘, Population-level activities (D, E) and normalized responses (D⬘, E⬘) of neurons with three successivephase-selectiveresponsesinthecueperiod.D,D⬘,Firsttothirdcue-selectiveresponses(n⫽24).E,E⬘,Secondtofourthcue-selectiveresponses(n⫽6).F–H⬘,Population-levelactivities(F–H)and normalizedresponses(F⬘–H⬘)ofneuronswithtwosuccessivephase-selectiveresponsesinthedelayperiod.F,F⬘,Pre-firstcueandfirstdelayselectiveresponses(n⫽5).G,G⬘,Firstandseconddelay-selective responses(n⫽11).H,H⬘,Secondandthirddelay-selectiveresponses(n⫽8).I–J⬘,Population-levelactivities(I,J)andnormalizedresponses(I⬘,J⬘)ofneuronswiththreesuccessivephase-selectiveresponses in the delay period. I, I⬘, Pre-first cue to second delay-selective responses (n ⫽ 20). J, J⬘, First to third delay-selective responses (n ⫽ 32).
though the combination-selective neurons tended to discharge after the neurons with the early cue responses (Kolmogorov–Smirnov Test, p ⬍ 0.05, except for the responses to the third and fourth cues in the auditory trials and
the third cues in the tactile trials), the activity of the combination-selective neurons did not generally differ from those of the phase-selective neurons (Kolmogorov–Smirnov test, p ⱖ 0.05, with the exception of the responses to the first
Saga et al. • Task Phase Coding in the LPFC
J. Neurosci., July 20, 2011 • 31(29):10648 –10665 • 10659
modality selectivity. Moreover, these phase representations, found continuously arranged throughout the task sequence, were updated promptly by the reception of each sensory signal, which likely arrived via sensory association areas, in time for the initiation of the behavioral response. We will discuss these findings in the context of previous results and in terms of functional significance in what follows. Encoding of sensory signals by LPFC neurons Of the neurons exhibiting early cue responses, 84% (15% of the total population) were responsive to only one sensory modality. When all the neurons responsive during the cue period (50 –550 ms after onset) were considered, 18% were selective for only sensory modality. Thus, 15–18% of task-related LPFC neurons are thought to be involved in the initial reception of each sensory signal. Visual neurons were prevalent in the caudal region of the LPFC, which receives inputs from visual areas in the posterior association Figure 10. Three examples of neuronal activity selective for specific combinations of modality and phase. The display format is areas (Barbas and Mesulam, 1985, Webthe same as that in Figure 5. A, Activity selective for the visual modality and the phase position (the third delay). B, Activity selective ster et al., 1994, Schall et al., 1995). In confor the auditory modality and the phase position (the second delay to the fourth cue). C, Activity selective for the tactile modality trast, tactile-responsive neurons were and the phase position (the first to the second cue). primarily located ventral to the principal sulcus at the rostrocaudal middle level that corresponds to the region having anatomical connectivity Table 5. Distribution of the selectivity of neurons showing combination selectivity with the secondary somatosensory area (Preuss and GoldmanPhase Rakic, 1989). A somatosensory region in the ventral LPFC of Cue period 1st 2nd 3rd 4th humans (Kostopoulos et al., 2007) in which neurons reflect the Modality frequency of vibrotactile stimuli has been identified (Romo et al., Visual 96 73 58 58 1999). Wide regions in the LPFC receive specific inputs from Auditory 46 27 20 37 auditory areas in the superior temporal cortex (Hackett et al., Tactile 59 28 18 33 1999; Romanski et al., 1999a,b), and functional specialization has Phase been demonstrated between the dorsal and the ventral LPFCs Delay period Pre-1st 1st delay 2nd delay 3rd delay (Vaadia et al., 1986; Romanski et al., 1999b; Kikuchi-Yorioka and Sawaguchi, 2000; Romanski and Goldman-Rakic, 2002; Cohen et Modality Visual 26 17 21 34 al., 2004; Sugihara et al., 2006; Russ et al., 2008; Cohen et al., Auditory 15 24 19 17 2009). In the current study, we observed a widespread distribuTactile 35 28 20 23 tion of auditory neurons without a clear functional segregation, Each cell indicates the number of neurons with the highest discharge rates at the specific combination of modality which was reasonable because we asked the animals to detect the and phase. onset of a simple auditory signal. In general, the distribution of unimodal-responsive neurons during the cue period was consistent with the anatomical organization of prefrontal connections and second cues in the visual trials), suggesting that with sensory association areas, suggesting that the retrieval of combination-selective activity was similar to phase-selective each sensory signal was, at least in part, achieved through these activity in terms of time of appearance. pathways.
Discussion
By analyzing PFC neuronal activity while monkeys performed a task requiring the continuous monitoring of four consecutive signals to correctly initiate an action, we were able to identify three types of neuronal selectivity: sensitivity to sensory modality, sensitivity to task phase, and sensitivity to the combination of sensory modality and task phase. Most importantly, we found that LPFC neurons encoded the task phase indicated by the discrete sensory events in multiple ways: with single-phase selectivity, successive-phase selectivity, and a combination of phase and
Continuous and multidimensional representation of the behavioral phase Of the task-related neurons, 30 and 33% reflected only the task phase position during the cue and delay periods, respectively. A subset of these neurons exhibited preferential activity for a single phase. The timing of the onset and offset of the activity of these neurons tended to be later than the onset of unimodal-selective activity, suggesting that phase selectivity was initiated after a certain amount of information was processed following the arrival
10660 • J. Neurosci., July 20, 2011 • 31(29):10648 –10665
Saga et al. • Task Phase Coding in the LPFC
Figure 11. Population-level activities and normalized responses of neurons with selectivity for the combination of modality and phase in the cue period. The display format is the same as that used in Figure 6. A–D⬘, Population-level activities of visual neurons selective for the first cue (A, A⬘; n ⫽ 96), the second cue (B, B⬘; n ⫽ 73), the third cue (C, C⬘; n ⫽ 58), and the fourth cue (D, D⬘; n ⫽ 58). E–H⬘, Population-level activities of auditory neurons selective for the first cue (E, E⬘; n ⫽ 46), the second cue (F, F⬘; n ⫽ 27), the third cue (G, G⬘; n ⫽ 20), and the fourth cue (H, H⬘; n ⫽ 37). I–L⬘, Population-level activities of tactile neurons selective for the first cue (I, I⬘; n ⫽ 59), the second cue (J, J⬘; n ⫽ 28), the third cue (K, K⬘; n ⫽ 18), and the fourth cue (L, L⬘; n ⫽ 33).
Saga et al. • Task Phase Coding in the LPFC
J. Neurosci., July 20, 2011 • 31(29):10648 –10665 • 10661
Figure 12. Population-level activities and normalized responses of neurons with selectivity for the combination of modality and phase in the delay period. The display format is the same as that used in Figure 6. A–D⬘, Population-level activity of visual neurons selective for the pre-first delay (A, A⬘; n ⫽ 26), the first delay (B, B⬘; n ⫽ 17), the second delay (C, C⬘; n ⫽ 21), and the third delay (D, D⬘; n ⫽ 34). E–H⬘, Population-level activities of auditory neurons selective for the pre-first delay (E, E⬘; n ⫽ 15), the first delay (F, F⬘; n ⫽ 24), the second delay (G, G⬘; n ⫽ 19), and the third delay (H, H⬘; n ⫽ 17). I–L⬘, Population-level activities of tactile neurons selective for the pre-first delay (I, I⬘; n ⫽ 35), the first delay (J, J⬘; n ⫽ 28), the second delay (K, K⬘; n ⫽ 20), and the third delay (L, L⬘; n ⫽ 23).
10662 • J. Neurosci., July 20, 2011 • 31(29):10648 –10665
of the sensory signal. We further found that the activity of neurons with singlephase selectivity during the delay period had already begun while the preceding cue was present and continued until well after the subsequent cue was presented. This finding indicated that the task phase was continuously represented throughout the entire task period by the combination of cue-responsive and delay-responsive neurons. Additionally, the fourth cue-selective responses began in advance of the monkeys’ key release, which was early enough to trigger the motor task. These observations were construed as indicating that the task phase was continuously monitored by individual types of neuronal activity with selectivity for each phase until the initiation of an action, which occurred when the fourth signal was detected. We found neuronal activity reflecting specific combinations of sensory modality and task phase. Every combination of phase and modality preference was represented during both cue and delay periods. The onset latency of the combination-selective neurons was closer to that of the phaseselective neurons, and both were longer than that of the unimodal-selective neurons. This finding suggests that combination-selective activity may be involved in encoding the task phase in conjunction with the sensory modality. Alternatively, the combination selectivity may be used for monitoring the context of the behavioral sequence, encompassing a wide range of sensory and motor events. We also identified the phase-selective neurons that were active in two or three successive phases. The activity of these neurons seemed to be useful in binding multiple phases of the task to render the task phase coding more relational and robust. In relation to the last point, Bernacchia et al. (2011) applied a theoretical analysis to neuronal activity recorded from the dorsolateral prefrontal cortex and related areas of monkeys performing a matching penny task. They found that neuronal activity reflects multiple time scales of reward memory ranging from hundreds of milliseconds to tens of seconds, suggesting that the time and phase are represented with multiple spans in the association areas. Together, these results led to the view that LPFC neurons encode multiple task phases not only in a chain-like fashion by connecting activity with single-phase selectivity but also in a multidimensional manner by binding information representing multiple successive phases and by attaching information about the modality of sensory signals to task phase information at the level of individual neurons.
Saga et al. • Task Phase Coding in the LPFC
Figure 13. Cortical surface map displaying the distribution of neurons with combination selectivity in the cue period (A) and delay period (B). A, B, The top row shows the distribution of neurons with a preference for a specific combination of the visual cue and the phase position. The middle row shows the distribution of neurons with a preference for a specific combination of the auditory cue and the phase position. The bottom row shows the distribution of neurons with a preference for a specific combination of the tactile cue and the phase position. The activity preference is indicated at the top of each panel.
Saga et al. • Task Phase Coding in the LPFC
J. Neurosci., July 20, 2011 • 31(29):10648 –10665 • 10663
Figure 14. Latencies of individual neurons. A–C, Cumulative distributions of latencies at which individual neurons began to respond to the appearance of the cue. A, Visual trials. B, Auditory trials. C, Tactile trials. In A–C, the four panels from left to right indicate data after the onset of the first, second, third, and fourth cue, respectively. “M” shows the onset latencies of the unimodal neurons with early cue responses and with a preference for the visual cue (A, the red line labeled “Visual”), the auditory cue (B, the green line labeled “Auditory”), and the tactile cue (C, the blue line labeled “Tactile”). “P” (black line labeled “Phase”) shows the onset latencies of the single-phase selective neurons in the cue period. The latencies were calculated according to the preference for the phase position (first to fourth cue) and for the modality [visual trials (A), auditory trials (B), and tactile trials (C)]. “C” shows the onset latencies of neurons selective for the combination of phase and modality in the cue period (indicated with “Combination”). The latencies were calculated separately for neurons preferring a specific combination of phase and modality (Table 5). The p values of the statistical analysis (the two-sample Kolmogorov–Smirnov test) are displayed for each comparison of the onset latencies. M-P, Between unimodal neurons with early cue responses and neurons with single-phase selectivity; M-C, between unimodal neurons and combination neurons; P-C, between phase neurons and combination neurons. Table 6. Median onset latency of selective responses Phase Selectivity Modality* Visual trial Auditory trial Tactile trial Phase** Visual trial Auditory trial Tactile trial Combination of modality and phase** Visual ⫻ phase: visual trial Auditory ⫻ phase: auditory trial Tactile ⫻ phase: tactile trial
1st
2nd
3rd
4th
108 125 80
112 115 101
110 147 116
109 135 90
158 146 137
330 175 298
195 218 196
242 273 268
118 193 142
201 306 180
182 215 145
180 223 250
Data are in milliseconds. *Unimodal neurons with early cue-responses. **Neurons with selectivity in the cue period (50 –550 ms after cue onset).
It was reported previously that patients with excision of their frontal lobes experienced difficulty with counting tactile or auditory stimuli presented at 1 s intervals, although they performed normally when these stimuli were presented at shorter intervals, indicating that the frontal
lobe is involved in sustaining attention for counting sensory events (Wilkins et al., 1987). The continuous and sustained representation of the task phase found in our study is viewed as one of the crucial neural correlates of frontal lobe functions that could explain the deficits found in that report. Lashley (1951) commented on the neural mechanisms for temporal control by arguing as follows: “The signal input is never into a quiescent or static system, but always into a system that is already actively excited and organized. In the intact organism, behavior is the result of interaction of this background excitation with input from any designated stimulus” (p. 112). We suggest that the variety of LPFC activity found in the delay period corresponded to the background excitation and that the prompt development of the subsequent task phase and the prompt termination of the preceding task phase during the cue period corresponded to the interaction of this background excitation with input from the designated stimulus. Recent studies (Genovesio et al. 2006, 2011) showed that LPFC neurons of monkeys encoded whether the first or second stimulus had lasted longer or appeared farther as a part of neural processes, extending Lashley’s concept by revealing that phase coding is used as an intermediate representation in a variety of cognitive operations.
10664 • J. Neurosci., July 20, 2011 • 31(29):10648 –10665
Interaction between the LPFC and other cortical areas in phase coding The multimodal nature of information representation has been shown in the parietal association cortex (Andersen et al., 1997; Duhamel et al., 1998), the temporal cortex (Ghazanfar et al., 2005; Kayser et al., 2005, 2007), and the polysensory region of the superior temporal sulcus (Bruce et al., 1981; Hikosaka et al., 1988). Because the LPFC is connected with all these regions, it is probable that the variety of activity found in the current study developed through interactions with these areas. On the other hand, a robust rank or phase representation has been shown in multiple areas (Nieder and Dehaene, 2009), including the anterior part of the cingulate sulcus (Procyk et al., 2000; Hoshi et al., 2005), the supplementary eye field (Berdyyeva and Olson, 2009; Campos et al., 2010), the presupplementary motor area (Tanji, 2001; Sohn and Lee, 2007), and the parietal association cortex (Sawamura et al., 2002; Nieder et al., 2006), leading to the possibility that the interaction of the LPFC with these areas plays an important role. Barbas and colleagues have provided structural evidence that the anterior cingulate cortex (area 32) exerts an inhibitory effect on the neuronal activity of the LPFC (area 46) by preferentially innervating the inhibitory interneurons (Medalla and Barbas, 2009, 2010). Thus, the anterior cingulate may play a major role in terminating sustained delay period activity. We need to examine how the interaction of the LPFC with other cortical and subcortical areas leads to higher cognitive functions, such as task phase coding, which is well developed in human and nonhuman primates. Conclusions Neurons in the LPFC provide continuous and multidimensional representations of behavioral task phases that are updated promptly after the reception of sensory signals from multiple modalities. These properties of neuronal activity are viewed as essential for establishing the temporal contingencies among multiple behavioral events, leading to the purposeful organization of motor behavior.
References Amiez C, Petrides M (2007) Selective involvement of the mid-dorsolateral prefrontal cortex in the coding of the serial order of visual stimuli in working memory. Proc Natl Acad Sci U S A 104:13786 –13791. Andersen RA, Snyder LH, Bradley DC, Xing J (1997) Multimodal representation of space in the posterior parietal cortex and its use in planning movements. Annu Rev Neurosci 20:303–330. Averbeck BB, Chafee MV, Crowe DA, Georgopoulos AP (2002) Parallel processing of serial movements in prefrontal cortex. Proc Natl Acad Sci U S A 99:13172–13177. Averbeck BB, Sohn JW, Lee D (2006) Activity in prefrontal cortex during dynamic selection of action sequences. Nat Neurosci 9:276 –282. Barbas H, Mesulam MM (1985) Cortical afferent input to the principalis region of the rhesus monkey. Neuroscience 15:619 – 637. Barone P, Joseph JP (1989) Prefrontal cortex and spatial sequencing in macaque monkey. Exp Brain Res 78:447– 464. Bates JF, Goldman-Rakic PS (1993) Prefrontal connections of medial motor areas in the rhesus monkey. J Comp Neurol 336:211–228. Berdyyeva TK, Olson CR (2009) Monkey supplementary eye field neurons signal the ordinal position of both actions and objects. J Neurosci 29:591–599. Berdyyeva TK, Olson CR (2010) Rank signals in four areas of macaque frontal cortex during selection of actions and objects in serial order. J Neurophysiol 104:141–159. Bernacchia A, Seo H, Lee D, Wang XJ (2011) A reservoir of time constants for memory traces in cortical neurons. Nat Neurosci 14:366 –372. Bruce C, Desimone R, Gross CG (1981) Visual properties of neurons in a polysensory area in superior temporal sulcus of the macaque. J Neurophysiol 46:369 –384.
Saga et al. • Task Phase Coding in the LPFC Campos M, Breznen B, Andersen RA (2010) A neural representation of sequential states within an instructed task. J Neurophysiol 104:2831–2849. Cohen YE, Russ BE, Gifford GW 3rd, Kiringoda R, MacLean KA (2004) Selectivity for the spatial and nonspatial attributes of auditory stimuli in the ventrolateral prefrontal cortex. J Neurosci 24:11307–11316. Cohen YE, Russ BE, Davis SJ, Baker AE, Ackelson AL, Nitecki R (2009) A functional role for the ventrolateral prefrontal cortex in nonspatial auditory cognition. Proc Natl Acad Sci U S A 106:20045–20050. Duhamel JR, Colby CL, Goldberg ME (1998) Ventral intraparietal area of the macaque: congruent visual and somatic response properties. J Neurophysiol 79:126 –136. Fujii N, Graybiel AM (2003) Representation of action sequence boundaries by macaque prefrontal cortical neurons. Science 301:1246 –1249. Genovesio A, Tsujimoto S, Wise SP (2006) Neuronal activity related to elapsed time in prefrontal cortex. J Neurophysiol 95:3281–3285. Genovesio A, Tsujimoto S, Wise SP (2011) Prefrontal cortex activity during the discrimination of relative distance. J Neurosci 31:3968 –3980. Ghazanfar AA, Maier JX, Hoffman KL, Logothetis NK (2005) Multisensory integration of dynamic faces and voices in rhesus monkey auditory cortex. J Neurosci 25:5004 –5012. Hackett TA, Stepniewska I, Kaas JH (1999) Prefrontal connections of the parabelt auditory cortex in macaque monkeys. Brain Res 817:45–58. Hasegawa RP, Blitz AM, Goldberg ME (2004) Neurons in monkey prefrontal cortex whose activity tracks the progress of a three-step self-ordered task. J Neurophysiol 92:1524 –1535. Hikosaka K, Iwai E, Saito H, Tanaka K (1988) Polysensory properties of neurons in the anterior bank of the caudal superior temporal sulcus of the macaque monkey. J Neurophysiol 60:1615–1637. Hoshi E, Sawamura H, Tanji J (2005) Neurons in the rostral cingulate motor area monitor multiple phases of visuomotor behavior with modest parametric selectivity. J Neurophysiol 94:640 – 656. Kayser C, Petkov CI, Augath M, Logothetis NK (2005) Integration of touch and sound in auditory cortex. Neuron 48:373–384. Kayser C, Petkov CI, Augath M, Logothetis NK (2007) Functional imaging reveals visual modulation of specific fields in auditory cortex. J Neurosci 27:1824 –1835. Kikuchi-Yorioka Y, Sawaguchi T (2000) Parallel visuospatial and audiospatial working memory processes in the monkey dorsolateral prefrontal cortex. Nat Neurosci 3:1075–1076. Knutson KM, Wood JN, Grafman J (2004) Brain activation in processing temporal sequence: an fMRI study. Neuroimage 23:1299 –1307. Konishi S, Uchida I, Okuaki T, Machida T, Shirouzu I, Miyashita Y (2002) Neural correlates of recency judgment. J Neurosci 22:9549 –9555. Kostopoulos P, Albanese MC, Petrides M (2007) Ventrolateral prefrontal cortex and tactile memory disambiguation in the human brain. Proc Natl Acad Sci U S A 104:10223–10228. Lashley KS (1951) The problem of serial order in behavior. In: Cerebral mechanisms in behavior (Jeffress LA, ed), pp 112–136. New York: Wiley. Lu MT, Preston JB, Strick PL (1994) Interconnections between the prefrontal cortex and the premotor areas in the frontal lobe. J Comp Neurol 341:375–392. Mauritz KH, Wise SP (1986) Premotor cortex of the rhesus monkey: neuronal activity in anticipation of predictable environmental events. Exp Brain Res 61:229 –244. McAndrews MP, Milner B (1991) The frontal cortex and memory for temporal order. Neuropsychologia 29:849 – 859. Medalla M, Barbas H (2009) Synapses with inhibitory neurons differentiate anterior cingulate from dorsolateral prefrontal pathways associated with cognitive control. Neuron 61:609 – 620. Medalla M, Barbas H (2010) Anterior cingulate synapses in prefrontal areas 10 and 46 suggest differential influence in cognitive control. J Neurosci 30:16068 –16081. Miller EK, Cohen JD (2001) An integrative theory of prefrontal cortex function. Annu Rev Neurosci 24:167–202. Milner B (1982) Some cognitive effects of frontal-lobe lesions in man. Philos Trans R Soc Lond B Biol Sci 298:211–226. Mushiake H, Saito N, Sakamoto K, Itoyama Y, Tanji J (2006) Activity in the lateral prefrontal cortex reflects multiple steps of future events in action plans. Neuron 50:631– 641. Nieder A, Diester I, Tudusciuc O (2006) Temporal and spatial enumeration processes in the primate parietal cortex. Science 313:1431–1435.
Saga et al. • Task Phase Coding in the LPFC Nieder A, Dehaene, S (2009) Representation of number in the brain. Annu Rev Neurosci 32:185–208. Ninokura Y, Mushiake H, Tanji J (2004) Integration of temporal order and object information in the monkey lateral prefrontal cortex. J Neurophysiol 91:555–560. Petrides M (1991a) Monitoring of selections of visual stimuli and the primate frontal cortex. Proc Biol Sci 246:293–298. Petrides M (1991b) Functional specialization within the dorsolateral frontal cortex for serial order memory. Proc Biol Sci 246:299 –306. Petrides M (1995) Impairments on nonspatial self-ordered and externally ordered working memory tasks after lesions of the mid-dorsal part of the lateral frontal cortex in the monkey. J Neurosci 15:359 –375. Petrides M, Pandya DN (1999) Dorsolateral prefrontal cortex: comparative cytoarchitectonic analysis in the human and the macaque brain and corticocortical connection patterns. Eur J Neurosci 11:1011–1036. Petrides M, Pandya DN (2002) Comparative cytoarchitectonic analysis of the human and the macaque ventrolateral prefrontal cortex and corticocortical connection patterns in the monkey. Eur J Neurosci 16:291–310. Pochon JB, Levy R, Poline JB, Crozier S, Lehe´ricy S, Pillon B, Deweer B, Le Bihan D, Dubois B (2001) The role of dorsolateral prefrontal cortex in the preparation of forthcoming actions: an fMRI study. Cereb Cortex 11:260 –266. Preuss TM, Goldman-Rakic PS (1989) Connections of the ventral granular frontal cortex of macaques with perisylvian premotor and somatosensory areas: anatomical evidence for somatic representation in primate frontal association cortex. J Comp Neurol 282:293–316. Procyk E, Tanaka YL, Joseph JP (2000) Anterior cingulate activity during routine and non-routine sequential behaviors in macaques. Nat Neurosci 3:502–508. Romanski LM, Goldman-Rakic PS (2002) An auditory domain in primate prefrontal cortex. Nat Neurosci 5:15–16. Romanski LM, Bates JF, Goldman-Rakic PS (1999a) Auditory belt and parabelt projections to the prefrontal cortex in the rhesus monkey. J Comp Neurol 403:141–157. Romanski LM, Tian B, Fritz J, Mishkin M, Goldman-Rakic PS, Rauschecker JP (1999b) Dual streams of auditory afferents target multiple domains in the primate prefrontal cortex. Nat Neurosci 2:1131–1136. Romo R, Brody CD, Herna´ndez A, Lemus L (1999) Neuronal correlates of parametric working memory in the prefrontal cortex. Nature 399: 470 – 473. Russ BE, Orr LE, Cohen YE (2008) Prefrontal neurons predict choices during an auditory same-different task. Curr Biol 18:1483–1488.
J. Neurosci., July 20, 2011 • 31(29):10648 –10665 • 10665 Sawamura H, Shima K, Tanji J (2002) Numerical representation for action in the parietal cortex of the monkey. Nature 415:918 –922. Schall JD, Morel A, King DJ, Bullier J (1995) Topography of visual cortex connections with frontal eye field in macaque: convergence and segregation of processing streams. J Neurosci 15:4464 – 4487. Shallice T, Burgess PW (1991) Deficits in strategy application following frontal lobe damage in man. Brain 114:727–741. Shima K, Isoda M, Mushiake H, Tanji J (2007) Categorization of behavioural sequences in the prefrontal cortex. Nature 445:315–318. Shimamura AP, Janowsky JS, Squire LR (1990) Memory for the temporal order of events in patients with frontal lobe lesions and amnesic patients. Neuropsychologia 28:803– 813. Sigala N, Kusunoki M, Nimmo-Smith I, Gaffan D, Duncan J (2008) Hierarchical coding for sequential task events in the monkey prefrontal cortex. Proc Natl Acad Sci U S A 105:11969 –11974. Sohn JW, Lee D (2007) Order-dependent modulation of directional signals in the supplementary and presupplementary motor areas. J Neurosci 27:13655–13666. Sugihara T, Diltz MD, Averbeck BB, Romanski LM (2006) Integration of auditory and visual communication information in the primate ventrolateral prefrontal cortex. J Neurosci 26:11138 –11147. Takada M, Nambu A, Hatanaka N, Tachibana Y, Miyachi S, Taira M, Inase M (2004) Organization of prefrontal outflow toward frontal motor-related areas in macaque monkeys. Eur J Neurosci 19:3328 –3342. Tanji J (2001) Sequential organization of multiple movements: involvement of cortical motor areas. Annu Rev Neurosci 24:631– 651. Tanji J, Hoshi E (2008) Role of the lateral prefrontal cortex in executive behavioral control. Physiol Rev 88:37–57. Vaadia E, Benson DA, Hienz RD, Goldstein MH Jr (1986) Unit study of monkey frontal cortex: active localization of auditory and of visual stimuli. J Neurophysiol 56:934 –952. Webster MJ, Bachevalier J, Ungerleider LG (1994) Connections of inferior temporal areas TEO and TE with parietal and frontal cortex in macaque monkeys. Cereb Cortex 4:470 – 483. Wilkins AJ, Shallice T, McCarthy R (1987) Frontal lesions and sustained attention. Neuropsychologia 25:359 –365. Wise SP, Murray EA (2000) Arbitrary associations between antecedents and actions. Trends Neurosci 23:271–276. Yamagata T, Nakayama Y, Tanji J, Hoshi E (2009) Processing of visual signals for direct specification of motor targets and for conceptual representation of action targets in the dorsal and ventral premotor cortex. J Neurophysiol 102:3280 –3294.