15 OCTOBER 2012
SUH ET AL.
7067
Development of New Ensemble Methods Based on the Performance Skills of Regional Climate Models over South Korea M.-S. SUH AND S.-G. OH Kongju National University, Gongju, South Korea
D.-K. LEE Atmospheric Sciences Program, School of Earth and Environmental Sciences, Seoul National University, Seoul, South Korea
D.-H. CHA, S.-J. CHOI, AND C.-S. JIN Atmospheric Sciences Program, School of Earth and Environmental Sciences, Seoul National University, Seoul, South Korea
S.-Y. HONG Department of Atmospheric Sciences, College of Science, Yonsei University, Seoul, South Korea (Manuscript received 18 August 2011, in final form 12 April 2012) ABSTRACT In this paper, the prediction skills of five ensemble methods for temperature and precipitation are discussed by considering 20 yr of simulation results (from 1989 to 2008) for four regional climate models (RCMs) driven by NCEP–Department of Energy and ECMWF Interim Re-Analysis (ERA-Interim) boundary conditions. The simulation domain is the Coordinated Regional Downscaling Experiment (CORDEX) for East Asia, and the number of grid points is 197 3 233 with a 50-km horizontal resolution. Three new performance-based ensemble averaging (PEA) methods are developed in this study using 1) bias, root-mean-square errors (RMSEs) and absolute correlation (PEA_BRC), RMSE and absolute correlation (PEA_RAC), and RMSE and original correlation (PEA_ROC). The other two ensemble methods are equal-weighted averaging (EWA) and multivariate linear regression (Mul_Reg). To derive the weighting coefficients and cross validate the prediction skills of the five ensemble methods, the authors considered 15-yr and 5-yr data, respectively, from the 20-yr simulation data. Among the five ensemble methods, the Mul_Reg (EWA) method shows the best (worst) skill during the training period. The PEA_RAC and PEA_ROC methods show skills that are similar to those of Mul_Reg during the training period. However, the skills and stabilities of Mul_Reg were drastically reduced when this method was applied to the prediction period. But, the skills and stabilities of PEA_RAC were only slightly reduced in this case. As a result, PEA_RAC shows the best skill, irrespective of the seasons and variables, during the prediction period. This result confirms that the new ensemble method developed in this study, PEA_RAC, can be used for the prediction of regional climate.
1. Introduction It is well known that as the computing power of supercomputers increases, the global climate model (GCM), regional climate model (RCM), and numerical weather prediction models (NWPMs) are becoming the
Corresponding author address: Myoung-Seok Suh, Department of Atmospheric Science, Kongju National University, 182 Shinkwandong, Gongju City 314-701, Chungcheongnam-do, South Korea. E-mail:
[email protected] DOI: 10.1175/JCLI-D-11-00457.1 Ó 2012 American Meteorological Society
most powerful tools for the understanding and forecasting of climate and weather, and the physics and dynamics of numerical models are becoming more realistic. The improved quality and quantity of observations are significant contributors to the performance of various types of numerical models along with the data assimilation system. However, although the performance of NWPMs and GCMs/RCMs is greatly improved, the current state-of-the-art models are still less than satisfactory, especially when applied for simulation as well as prediction of precipitation (e.g., Krishnamurti
7068
JOURNAL OF CLIMATE
et al. 1999; Murphy et al. 2004; Palmer et al. 2004; Cha and Lee 2009). The limitations of various types of models mainly stem from the incompleteness of initial conditions, boundary conditions, model physics, and dynamics (e.g., Krishnamurti et al. 1999; Lee and Suh 2000; Palmer et al. 2004). Many studies have focused on resolving the limitations of the current models; these include studies focusing on understanding and improving the physics and dynamics of these models (e.g., Krishnamurti et al. 1999; Giorgi and Mearns 2002; Palmer et al. 2004; Kang et al. 2005; Cha and Lee 2009). The ensemble method (or superensemble) is one of the methods that is being widely used to minimize the uncertainty of the initialization and to improve the performance of models (e.g., Krishnamurti et al. 1999, 2000; Giorgi and Mearns 2002; Feng et al. 2011). In particular, ensemble methods are widely used in the community of global climate simulation, for shortterm and seasonal forecasts based on the simulation results of multiple models, and on multiple initial conditions and physical processes for the given model. Since Krishnamurti et al. (1999, 2000) and Yun et al. (2003) showed that the multimodel ensemble (MME) is superior to the single model by using an ensemble of global climate models from the Atmospheric Model Intercomparison Project (AMIP), various types of MMEs have been developed and widely applied to GCMs, RCMs, and seasonal forecast models to improve the performance of model simulations (e.g., Peng et al. 2002; Yun et al. 2003; Kim et al. 2004; Palmer et al. 2004; Kug et al. 2007; Casanova and Ahrens 2009; Coppola et al. 2010). In general, the ensemble methods can be categorized into three types: the first is a simple composite method (Peng et al. 2002; Palmer et al. 2004), the second is a version of the weighted ensemble method (Krishnamurti et al. 1999; Giorgi and Mearns 2002; Kharin and Zwiers 2002; Kug et al. 2007; Christensen et al. 2010; Coppola et al. 2010; Feng et al. 2011), and the third is a synthetic method (Chakraborty and Krishnamurti 2006). In some previous works, assigning different weightings for the ensemble members on the basis of each member’s performance has been suggested as a way to reduce unwanted uncertainty in climate model projections (Giorgi and Mearns 2002; Murphy et al. 2004; Tebaldi and Knutti 2007; Weigel et al. 2010). Feng et al. (2011) showed that multi-RCM ensembles outperform single-RCM ensembles in many aspects; for this purpose, they used intercomparison results of the arithmetic mean, the weighted mean, multivariate linear regression, and singular value decomposition, for temperature, precipitation, and sea level pressure. Among the four ensemble methods used, multivariate linear regression, which is based on the minimization of the root-mean-square
VOLUME 25
errors (RMSEs), significantly improved the ensemble results. Kug et al. (2007), Casanova and Ahrens (2009), Coppola et al. (2010), and many other authors showed that performance-based weights yield more accurate results than those that use equal weights. However, Christensen et al. (2010) showed that the use of model weights is sensitive to the aggregation procedure and has different sensitivities to the selected metrics. This conclusion is based on results showing that there is no compelling evidence of an improved description of mean climate states when using performance-based weights in comparison to the use of equal weights. Weigel et al. (2010) confirmed that equally weighted multimodels, on average, outperform single models and that projection errors can, in principle, be further reduced by optimum weighting. However, they also emphasized that the task of finding robust and representative weights for climate models is certainly a difficult problem. Relatively few ensemble works have been performed for RCMs because of a lack of long-term simulations with multi-RCMs (Christensen et al. 2010; Feng et al. 2011). Coordinated Regional Downscaling Experiment (CORDEX) is a WCRP (World Climate Research Programme)-sponsored program to organize an international coordinated framework to produce an improved generation of regional climate change projections worldwide to allow for input into impact and adaptation studies within the Fifth Assessment Report (AR5) timeline and beyond (http://www.meteo.unican.es/en/ projects/CORDEX). CORDEX will produce an ensemble of multiple dynamical and statistical downscaling models that will consider multiple forcing GCMs from the Climate Model Intecomparison Project phase 5 (CMIP5) archive. Using CORDEX for East Asia presents a good opportunity to carry out ensemble research related to RCMs. Among the various measures used in model evaluation studies, bias, correlation coefficients (Corr.), and RMSE are not only simple to calculate but also easy to interpret. In this study, the five ensemble methods, including the three newly developed ensemble methods based on the bias, Corr., and RMSE, were tested to improve the RCMs’ performance for two climatic variables, temperature and precipitation, over South Korea; this was done by using data from the 20-yr CORDEX East Asia experiments. The relative prediction performance of the five ensemble methods for temperature and precipitation over South Korea is explained. The paper is structured as follows. In section 2, the models, data, and ensemble methods are described. In section 3, the ensemble results and an intercomparison of their performance are shown. In section 4, we draw our conclusions.
15 OCTOBER 2012
SUH ET AL.
2. Data and method a. Models In this study, two nonhydrostatic RCMs [Seoul National University Regional Climate Model (SNURCM) and Weather Research and Forecasting model (WRF)] and two hydrostatic RCMs [RegCM version 4 (RegCM4) and Regional Spectral Model (RSM)] were used to simulate the 20-yr (from 1989 to 2008) regional climate over CORDEX East Asia by using two sets of boundary condition data. The SNURCM (Lee et al. 2004) was based on the fifth-generation Pennsylvania State University–National Center for Atmospheric Research (NCAR) Mesoscale Model (MM5) (Grell et al. 1994). An advanced and comprehensive land surface parameterization scheme, namely, the Community Land Model, version 3 (CLM3) (Bonan et al. 2002), was coupled to SNURCM for land surface and soil physical processes. The details of SNURCM were described by Cha and Lee (2009). Furthermore, the WRF (Skamarock et al. 2005), version 3.0, developed by NCAR, was used to simulate the regional climate over CORDEX East Asia. The WRF is the most popular mesoscale model, with various physical schemes and dynamical options that can capture weather phenomena as well as climate features. The RegCM4, developed by the International Centre for Theoretical Physics (ICTP), is a popular RCM that has been used for regional climate modeling studies with seasonal to decadal time scales. In particular, RegCM4 is the latest version, with some noteworthy improvements, such as the coupling of a sophisticated land surface model (LSM), CLM3 (http://www.ictp.it/research/esp/models/ regcm4.aspx). In this study, we also implemented spectral nudging (Von Storch et al. 2000) into RegCM4 to reduce the systematic errors generated in long-term simulation. The RSM (Juang et al. 1997) is a primitive equation model using the sigma-vertical coordinate. The performance of the RSM for the East Asia summer monsoon was also evaluated by Kang and Hong (2008) and Yhang and Hong (2008a). We selected these models because their performances have been evaluated through regional climate modeling studies for East Asia, such as reproducing extreme climate, investigating physical processes in East Asian climate, and downscaling GCM scenarios. Many studies (e.g., Lee and Suh 2000; Lee et al. 2004; Park et al. 2008; Yhang and Hong 2008b; Cha and Lee 2009; Hong and Yhang 2010; Cha et al. 2011) have shown that each model has an ability to reproduce the regional climate over East Asia reasonably. Moreover, the performances of the four models have been evaluated by participating in phase 3 of the international Regional Climate Model Intercomparison Project (RMIP) (Fu et al. 2005), in which current and future regional climate
7069
scenarios for East Asia are generated by downscaling the GCM results.
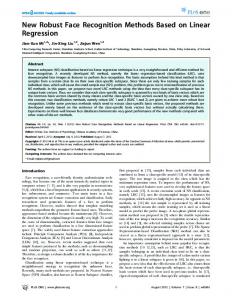
b. Experiment design The simulation domain (Fig. 1) of CORDEX East Asia covers most of Asia, the western Pacific, the Bay of Bengal, and the South China Sea. All models had the same domain center (358N, 1058E) and an identical horizontal resolution of 50 km. The zonal and meridional grid points of the SNURCM and WRF were 233 and 197, respectively, while those of the RegCM4 were 243 and 197 due to a technical problem related to parallelization. The RSM differed slightly from the other grid models, since its map projection (Mercator projection) was different from that of the other models (Lambert conformal projection). The dynamic frameworks and physical schemes used in this study are summarized in Table 1. For each model, optimal schemes of the dynamical and physical processes were chosen that were determined through the investigation of the model sensitivities to the schemes. In all the models, large-scale nudging methods (Von Storch et al. 2000; Miguez-Macho et al. 2005; Kanamaru and Kanamitsu, 2007) were applied to reduce the deviation due to a large-scale regime (.1000-km wavelength) between the RCM solution and large-scale forcing data. Large-scale nudging is an alternative approach to minimize the systematic errors in long-term integration. A number of studies have shown that the method can improve the performance of RCMs by preventing the distortion of large-scale fields (e.g., Kang et al. 2005; Miguez-Macho et al. 2005; Cha and Lee 2009). A spectral nudging technique (Von Storch et al. 2000) was applied in SNURCM and RegCM4, and a spectral nudging method using a Newtonian cooling (Miguez-Macho et al. 2005) was used in the WRF. In RSM, the scale-selective bias correction (SSBC) method (Kanamaru and Kanamitsu 2007) was applied, where the errors in large-scale horizontal wind components are reduced by applying spectral damping to the tendency. To assess the models’ performance in reproducing the statistical behavior of the Asian monsoon climate, the simulation period was set to 20 yr, from January 1989 to December 2008. Data from the National Centers for Environmental Prediction/Department of Energy (NCEP– DOE) Reanalysis 2 (R-2; Kanamitsu et al. 2002) and European Centre for Medium-Range Weather Forecasts Interim Re-Analysis (ERA-Interim) data (Simmons et al. 2006) were employed to provide the lateral boundary conditions and initial conditions for the four RCMs. The four RCMs are all driven by two sets of boundary data, R-2 data and ERA-Interim data. The coarse boundary data are bilinearly interpolated to the horizontal
7070
JOURNAL OF CLIMATE
VOLUME 25
FIG. 1. Domain used for RCM simulations over the CORDEX East Asia.
model grid points and are linearly interpolated to each RCM’s sigma levels. Skin temperatures from the R-2 and ERA-Interim data were used as sea surface temperature (SST) for SNURCM, WRF, and RSM, while the daily observed SST temporally interpolated from the weekly optimum interpolation analysis (Reynolds et al. 2002) was used for RegCM4. Thus, eight ensemble members are used for the development of new ensemble methods. From the simulation results for 20 yr, the data for 15 yr were considered as training data for the development of ensemble algorithms; the other data for the remaining 5 yr were used to evaluate the developed
ensemble methods. The detailed evaluation of simulated precipitation and temperature was conducted by using hourly precipitation and surface air temperature data obtained at 59 stations across South Korea for the 20 yr from 1989 to 2008; these data were obtained from the Korea Meteorological Administration (KMA).
c. Ensemble methods 1) EVALUATION STRATEGY The performance of each model is evaluated by using the ground observation data based on the observation
TABLE 1. The main characteristics of the four RCMs used in this study. PBL 5 planetary boundary layer. YSU 5 Yonsei University. Kain–Fritsch 2 5 new Kain–Fritsch cumulus parameterization. MIT–Emanuel 5 Massachusetts Institute of Technology and Kerry Emanuel. SAS 5 Simplified Arakawa–Schubert. CLM3 5 CLM, version 3. CLM 5 Community Land Model. CCM2 5 Community Climate Model, version 2. RRTM 5 Rapid Radiative Transfer Model. CCM3 5 CCM, version 3. GFDL 5 Geophysical Fluid Dynamics Laboratory longwave scheme. Dudhia 5 Dudhia scheme. GSFC 5 Goddard Space Flight Center shortwave scheme.
No. of grid points (lat 3 lon) Vertical levels Dynamic framework PBL scheme Convective scheme Land surface Longwave radiation scheme Shortwave radiation scheme Spectral nudging
SNURCM
WRF
RegCM4
RSM
197 3 233 s-24 Nonhydrostatic YSU Kain–Fritch 2 CLM3 CCM2 CCM2 Yes
197 3 233 s-27 Nonhydrostatic YSU Kain–Fritch 2 Unified Noah RRTM Dudhia Yes
197 3 243 s-18 Hydrostatic Holtslag MIT–Emanuel CLM CCM3 CCM3 Yes
198 3 241 s-22 Hydrostatic YSU SAS NOAH LSM GFDL GSFC Yes
15 OCTOBER 2012
7071
SUH ET AL.
points. The nearest four grid points from the observation point are bilinearly interpolated to the observation point. The interpolation of temperature has been performed with a constant lapse rate of 60.658C (100 m)21 after the correction of topography differences between the observation point and the grid points. In this study, the entire evaluation is performed based on the monthlymean temperature (8C) and daily mean precipitation (mm day21).
2) EQUAL-WEIGHTED AVERAGING (EWA) The spatially averaged bias (DTi) of the ith model for temperature (or precipitation) is defined by Eq. (1). Here, Np, Tisp, and Top are the number of validation points, the surface air temperature (or precipitation) simulated by the ith model, and the observed air temperature (precipitation) at point p, respectively:
DTi 5
1 Np
Np
å (Tisp 2 Top ) .
(1)
p51
The Tisp value is calculated by the bilinear interpolation of the nearest four grid points around the observation point. The RMSE and spatial (temporal) Corr. for each model and their equal weighting ensemble can also be calculated through a similar process. The model-averaged bias (simple ensemble or equal-weighting ensemble) of the total number of ensemble members (NM) over the analysis domain can be obtained from Eq. (2) as follows: DT 5
1 NM
NM
å DTi .
(2)
i51
As has been shown in many studies, this method is not only convenient but also powerful for increasing forecasting performance because there is no need to preprocess with observation data (e.g., Christensen et al. 2010).
3) PERFORMANCE-BASED ENSEMBLE AVERAGING In general, the simulation performance of each model is significantly different for models, variables, levels, seasons, and geographic regions. Therefore, it is necessary to take into consideration the simulation performance of each model to improve the ensemble results. Three types of weighted ensemble methods are being developed based on the simulation performance of the ensemble members. The weighting coefficients are mainly derived from the model evaluation results with observations. Hence, the weighting coefficients should
be calculated by using the simulation results for the historical climate and observed data through a corresponding statistical approach, that is, data training, to apply this method to the multimodel ensemble predictions of future climate. In general, bias (B), RMSE, and Corr. are the most widely used parameters in the evaluation of models. For this study, we have developed new ensemble methods based on these evaluation parameters, assuming that the simulation performance of RCM is inversely proportional to the bias and RMSE but proportional to the temporal correlation coefficients. In this study, the preliminary weighting value, Pwi, is defined in three ways [Eqs. (3)–(5)] using various combinations of the model’s evaluation parameters. The weighting in Eq. (3) is inversely proportional to the product of bias and RMSE, so the weighting is drastically reduced for low-performance models, as in Giorgi and Mearns (2002), who consider the product of a model’s bias and the distance between a given model’s change and the reliability ensemble average change. However, in Eq. (4), the weighting is only inversely proportional to the RMSE, as follows: )( ) 1. 1.0 Abs(Corri ), Pwi 5 [Abs(Bi )11.0] (RMSEi 11.0) (
(3) Pwi 5
1.0 Abs(Corri ), (RMSEi 1 1.0)
Pwi 5
1.0 Corri (RMSEi 1 1.0)
and
(4)
(5)
To avoid the mathematical problem of division by zero, we added 1 to the bias and the RMSE, and converted the bias and the temporal correlation coefficients into absolute values. We can easily see that the Pwi is inversely proportional to the bias and to the RMSE but proportional to the temporal correlation coefficients. If the RCM’s temporal correlation coefficient is positive, then there is no difference between Eqs. (4) and (5), as with the temperature. However, if the correlation is negative, then there will be a significant difference between Eqs. (4) and (5). The normalized weighting (NPwi) of each model is obtained by Eq. (6), as follows: NPwi 5
Pwi NM
.
(6)
å Pwi
i51
When Pwi is defined by Eq. (3), the weighted ensemble of each model’s variables can be calculated by Eq. (7). We
7072
JOURNAL OF CLIMATE
call the result performance-based ensemble averaging using bias, RMSE, and correlation (PEA_BRC). In Eq. (7), no bias correction is applied because the bias term is explicitly included in Eq. (3), as shown: T~ 5
NM
å NPwi Ti
(7)
i51
If Pwi is defined by Eqs. (4) and (5), then the weighted ensemble of each model’s variables can be calculated by Eq. (8). We call the result PEA using RMSE and absolute correlation coefficient (PEA_RAC) and PEA using RMSE and original correlation coefficient (PEA_ROC). In Eq. (8), bias correction is applied because the bias term is not explicitly included in Eqs. (4) and (5), as shown: T~ 5
NM
NM
i51
i51
å NPwi Ti 2 å NPwi DTi ;
(8)
Ti in Eqs. (7) and (8) is the temperature simulated by the ith model.
4) MULTIVARIATE LINEAR REGRESSION The ensemble method based on multivariate linear regression (Mul_Reg) is widely applied to ensemble studies. Feng et al. (2011) showed that multivariate linear regression, based on the minimization of the RMSE, significantly improved the ensemble results. In this method, the ensemble results are calculated by the linear combinations of the simulation results of each ensemble member. In this study, we used the method described in section 6 of Feng et al. (2011).
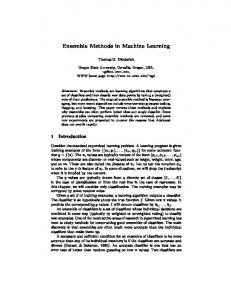
3. Ensemble results a. Simulation performance of RCMs Figure 2 shows the seasonal variations of the 20-yr averaged monthly-mean temperature and daily precipitation simulated by eight ensemble members over South Korea. In general, most of the RCMs simulate the annual cycle of temperature and precipitation well. However, the seasonal amplitudes of temperature and precipitation are significantly underestimated, especially for precipitation; this underestimation can be attributed to strongly underestimated amounts of precipitation during summer and overestimated amounts of precipitation during winter. The strong underestimation of summer precipitation can be partly attributed to the low spatial resolution (50 km) because summer precipitation over South Korea is caused by mesoscale
VOLUME 25
convective systems embedded in the changma front and, sometimes, by typhoons. The RCM simulation with 50-km grid size also significantly underestimates the height of the topography in South Korea; the resolution is too coarse to capture orographic influences on the rainfall. The impacts of grid and domain sizes on the RCM’s rainfall simulation have been well documented in many works (e.g., Leduc and Laprise 2009; Qian and Zubair 2010). Figure 3 shows the 20-yr biases of monthly-mean temperature and daily precipitation simulated by the eight ensemble members for four selected months over South Korea. As was mentioned before, the simulation performances of the eight ensemble members over South Korea are clearly dependent on the models, boundary conditions, season, year, and parameters. The large spread of simulation results, irrespective of the variables and months, suggests that the current state-ofthe-art RCMs are very diverse and less suitable for longterm prediction. In January, the spread of temperature biases is greater than that of precipitation. In contrast, in July, the spread of precipitation biases is much greater than that of temperature. Furthermore, most RCMs underestimate the temperature and precipitation, especially during summer. The spread of the temperature simulated by RCMs is relatively smaller during summer than during other seasons. Conversely, the large spread of simulated precipitation values for each ensemble member during July shows that the uncertainty of the simulated precipitation by RCMs is relatively large during summer. Figures 4 and 5 show the bias, spatial correlation coefficients, and RMSE of the 20-yr averaged seasonal mean temperature and precipitation over South Korea simulated by the eight ensemble members. The sizes of the boxes and triangles are proportional to the magnitude of the RMSE. The spatial correlation coefficients of the eight ensemble members for temperature are similar, with a minimum and a maximum in summer and winter, respectively. However, the bias and RMSE of temperature vary according to the models and seasons, although strong cold biases are very dominant in all four seasons. The impacts of boundary conditions (differences between boxes and triangles) on the RCM’s temperature simulations are not systematic and are relatively weak. The bias, spatial correlation coefficients, and RMSE of precipitation vary significantly according to the models and seasons. The simulation performance for precipitation is clearly lower than that for temperature in all seasons, especially during summer. The simulation performances of the eight ensemble members for precipitation during summer are characterized by large
15 OCTOBER 2012
SUH ET AL.
7073
FIG. 2. Seasonal variations in 20-yr averaged monthly-mean temperature (8C) and daily precipitation (mm day21) simulated by the eight ensemble members over South Korea.
RMSE, dry bias, and a low correlation coefficient. As with temperature, the performances of the eight ensemble members for precipitation are better during winter than during summer. The diverse and less satisfactory performance of RCMs regarding the current climate, driven by the reanalysis data, indicate that postprocessing, such as ensemble averaging, is needed to provide more reliable information to the climate-related community.
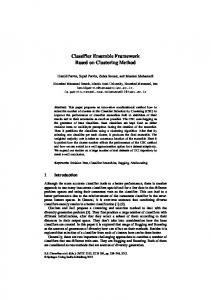
b. Performance of prediction Figure 6 shows the interannual variations of temperature and precipitation anomalies from the 20-yr averages of observations according to the ensemble methods, with observations. The weighting coefficients for each ensemble method were obtained by using all 20 yr of
data. As in Feng et al. (2011)’s work, Mul_Reg provides the most accurate results for both precipitation and temperature, although the number of ensemble methods is different. The new ensemble methods, PEA_RAC and PEA_ROC, show very similar performance compared to that of Mul_Reg, although PEA_BRC is significantly inferior to Mul_Reg. The reason for the inferior performance of PEA_BRC compared to PEA_RAC and PEA_ROC can be attributed to the choice of Eqs. (7) and (8), that is, whether a bias correction is included. EWA shows the largest negative anomalies, both in temperature and precipitation, because most of the eight ensemble members predicted lower temperatures and less precipitation than was observed.
7074
JOURNAL OF CLIMATE
VOLUME 25
FIG. 3. Scatterplots of biases of monthly-mean temperature (8C) and daily precipitation (mm day21) simulated by the eight ensemble members for four selected months.
To test the prediction performance and stability of the five ensemble methods for temperature and precipitation over South Korea, the 20-yr data simulated by the eight ensemble members are separated into data for a training period (15 yr) and data for a prediction period (5 years). The total number of trainings and evaluations is 20, using a cyclic method. The weighting coefficients for the ensemble members corresponding to the selected ensemble method were obtained by Eqs. (3)–(6) using the selected 15 yr of training data.
Figures 7 and 8 show the performance for annual mean temperature and precipitation averaged over the 20 cases by the five ensemble methods, both for the training period and the prediction period. The bias of Mul_Reg is not only very small but also consistent, in both the training and prediction periods. Further, the biases of PEA_RAC and PEA_ROC are almost zero and consistent for the training and prediction periods. However, the biases and RMSE of EWA and PEA_BRC are consistently large compared to those values for the other three ensemble methods, in both the training and
15 OCTOBER 2012
SUH ET AL.
7075
FIG. 4. Scatterplots of biases, spatial correlation, and RMSE of 20-yr averaged seasonal mean temperature (8C) simulated by the eight ensemble members.
prediction periods. The same results for EWA in both the training and prediction periods are attributed to the 20-yr cyclic tests. The worst performance of EWA is related to the fact that most of the RCMs systematically underestimate the temperature and precipitation. As with the bias, Mul_Reg shows the lowest RMSE during the training period, but the RMSE of Mul_Reg abruptly increases when it is applied to the prediction of temperature. The degradation of Mul_Reg can be related to overfitting problems arising from an insufficient number of samples used for the retrieval of regression coefficients. In contrast, the RMSEs of PEA_RAC and PEA_ROC are slightly larger than that of Mul_Reg, and the RMSEs of PEA_RAC and PEA_ROC are very consistent when they are applied to prediction. Despite the sampling problems, we can conclude that PEA_RAC and PEA_ROC improve the results for precipitation and temperature, and that they are superior to Mul_Reg for all the evaluation parameters and for the 5 yr when the data are applied to prediction. To evaluate the time dependency of the new ensemble methods, they are applied to the seasonal mean climate.
Table 2 shows the statistical evaluation results for summer mean temperature and precipitation from the observations, and the five sets of ensemble results for the training period (15 yr) and the evaluation period (5 yr) according to the ensemble methods. As in other studies, the performance of all five ensemble methods is much better for temperature than for precipitation. As can be seen in Figs. 7 and 8, Mul_Reg and EWA are the most accurate and least accurate, respectively, during the training period for each evaluation parameter. However, the performance of Mul_Reg is significantly decreased when it is applied to prediction. Contrary to the Mul_Reg method, the prediction performances of PEA_RAC and PEA_ROC are relatively stable in prediction. As a result, the prediction performances of PEA_RAC and PEA_ROC are superior to that of Mul_Reg for each evaluation parameter. Compared to temperature, the performance of all ensemble methods is significantly low for precipitation because the model errors for that parameter are generally high. As with temperature, the Mul_Reg method shows the best performance among the five ensemble methods during
7076
JOURNAL OF CLIMATE
VOLUME 25
FIG. 5. As in Fig. 4, but for precipitation.
the training period. However, PEA_RAC shows the best performance during the prediction period and a slightly better performance than PEA_ROC. The different temporal correlation coefficients of precipitation resulted in different performances by PEA_RAC and PEA_ROC. This indicates that at least one RCM shows negative correlation for precipitation. The performances of all ensemble methods, except for EWA, are significantly decreased during the prediction period compared to their performances during the training period. Table 3 lists the prediction performance of the five ensemble methods for winter mean temperature and precipitation over South Korea. As in summer, during the training period Mul_Reg and EWA are the most accurate and least accurate, respectively, for both temperature and precipitation. PEA_RAC shows a very consistent and accurate performance during the prediction period. The statistical evaluation results confirm that PEA_RAC and PEA_ROC are the most accurate and stable methods for predicting temperature and precipitation among the five ensemble methods. As can be
seen in Tables 2 and 3, the performance of PEA_RAC is skillful and very consistent, irrespective of seasons and variables.
4. Summary In this paper, the prediction performance for temperature and precipitation of five ensemble methods—equal weighted averaging (EWA), three performance-based ensemble averaging methods (PEA_BRC, PEA_RAC, PEA_ROC), and multivariate linear regression (Mul_ Reg)—were discussed by using simulation results for 20 yr obtained from four RCMs driven by two sets of boundary data, namely, R-2 and ERA-Interim. The simulation domain of CORDEX East Asia covers most of Asia, the western Pacific, the Bay of Bengal, and the South China Sea; the number of grid points is 197 3 233 with a 50-km horizontal resolution. The four RCMs used in this study are SNURCM, WRF, RegCM4, and RSM. The new performance-based ensemble methods developed in this study—PEA_BRC, PEA_RAC, and
15 OCTOBER 2012
SUH ET AL.
7077
FIG. 6. Interannual variations in annual-mean temperature (8C) and precipitation (mm day21) anomalies according to the ensemble methods with observations over South Korea.
PEA_ROC—assign weights to each model based on its performance through various combinations of statistical evaluation parameters, such as bias, RMSE, and temporal correlation coefficient. As the RCM’s performances are clearly dependent on the variables, location, vertical layers, and season, the weights also are functions of the variables, geographic location, and season. Fifteen years and 5 yr of data from the 20-yr set of simulation data were used to derive the weighting coefficients and to cross validate the prediction performance, respectively, of the five ensemble methods. Overall, the ensemble results for temperature are better than those for precipitation in all five ensemble methods. The ensemble results for temperature and precipitation during winter are better than those during summer. According to the analysis of annual and seasonal mean, the performance of the five ensemble
methods is proportional to the averaging time scale. Further, the performances of the Mul_Reg and the bias-correction methods (PEA_RAC, PEA_ROC) are much better than those of the EWA and PEA_BRC ensemble methods, irrespective of the variables and averaging time scales. The biases (RMSE) of EWA and PEA_BRC are consistently larger than those of PEA_RAC and PEA_ROC. The spatial correlation coefficients of EWA and PEA_BRC are significantly lower than those of PEA_RAC and PEA_ROC. The relatively low performance of PEA_BRC was partly caused by overweighting through the combined use of bias and RMSE. The identical result of PEA_RAC and PEA_ROC for temperature was caused by the consistent positive temporal correlation coefficient. However, the different temporal correlation of precipitation resulted in different performances for PEA_RAC and PEA_ROC.
7078
JOURNAL OF CLIMATE
FIG. 7. The 20 cases average of statistical validation results of the five ensemble methods for temperature over South Korea during the 15-yr training and 5-yr prediction periods.
VOLUME 25
15 OCTOBER 2012
SUH ET AL.
FIG. 8. As in Fig. 7, but for precipitation.
7079
7080
0.55 0.35 0.06 0.07 3.24 0.36 0 1.17 0.85 0.48 0.30 0.07 21.12 2.48 0.47 21.12 2.29 0.57 0.42 0.12 0.06 0.08 2.08 0.57 0.08 1.85 0.67 0.35 0.25 0.08 21.04 2.42 0.42 21.03 2.31 0.48 21.20 2.64 0.35 21.20 2.64 0.35 Precipitation
Temperature
Variables
Bias (8C) RMSE (8C) Spatial correlation Bias (mm day21) RMSE (mm day21) Spatial correlation
21.37 1.53 0.80
0.49 0.29 0.11
0.14 0.11 0.03 0.00 0.74 0.84 0.00 0.26 0.98 0.28 0.31 0.12 0.03 0.64 0.88 0.03 0.56 0.90 0.18 0.06 0.01 0.09 0.48 0.94 0.09 0.42 0.95 0.15 0.11 0.03 21.06 1.26 0.80 21.05 1.25 0.81
5-yr avg
21.37 1.53 0.80
0.14 0.12 0.02
Std dev 5 yr 5-yr avg
Mul_Reg
15-yr avg Std dev 5 yr PEA_ROC
15-yr avg Std dev 5 yr 5-yr avg
PEA_RAC
15-yr avg Std dev 5 yr 5-yr avg
PEA_BRC
15-yr avg Std dev 5 yr 5-yr avg
EWA
15-yr avg Ensemble methods
TABLE 2. Intercomparison results of the five ensemble methods for the summer mean temperature and precipitation for the 15-yr training and 5-yr prediction periods.
JOURNAL OF CLIMATE
VOLUME 25
Among the five ensemble methods, the Mul_Reg method shows the best performance, irrespective of seasons and parameters, during the training period. The bias and RMSE of Mul_Reg for temperature and precipitation are consistently small during the training period. This result is consistent with Feng et al.’s (2011) results, who found that Mul_Reg is the most efficient ensemble method for temperature and precipitation. However, the EWA method shows the worst performance, with a large bias and RMSE, irrespective of seasons and variables, during the training period. PEA_RAC shows a performance very similar to that of Mul_Reg for temperature and precipitation during the training period. However, the performance and stability of Mul_Reg are drastically reduced when the method is applied to prediction of both temperature and precipitation, although the performance of PEA_RAC for temperature and precipitation prediction is only slightly reduced. As a result, PEA_RAC shows the best performance, irrespective of seasons and variables, during the prediction period. The training and prediction process of the ensemble methods could be applied in future RCM projections driven by GCMs. The historical simulation results of RCMs driven by GCMs can be used as training data, making it possible to then apply the ensemble methods to future projection results. Although the assumption of stationariness under a changing climate can be an issue (Christensen et al. 2008), these results confirm that the new ensemble method developed in this study, PEA_RAC, can be used for the prediction of regional climate, irrespective of the variables or averaging time scale. Casanova and Ahrens (2009) also showed that the impact of weighting on multimodel ensemble forecasts is independent of spatial scales and forecast ranges. The simplicity of the derivation process for the weighting coefficients and applications is also a strong point of the ensemble method. However, as Christensen et al. (2010) asserted, a subjective selection of a limited set of metrics with a priori largely unknown interdependency is unavoidable. Furthermore, application methods for weighting coefficients, products of individual weightings of a metrics set with equal weighting or different weighting, are also subjectively designed. Weigel et al. (2010) also mentioned the difficulties of finding robust and representative weights for climate models due to (i) the inconveniently long time scales considered, which strongly limit the number of available verification samples; (ii) nonstationarities of model skill under a changing climate; and (iii) the lack of convincing alternative ways to accurately determine skill. Hence, intensive testing with various combinations of weightings performed with simulation data of longer duration is
0.13 0.05 0.06 20.01 0.53 0.65 0.10 0.07 0.10 0.15 0.45 0.75 0.15 0.45 0.75
0.12 0.07 0.05
0.05 0.36 0.81
0.05 0.38 0.79
0.07 0.08 0.05
0.00 0.33 0.85
0.00 0.37 0.81
0.10 0.07 0.03
20.06 0.41 0.71
20.05 0.45 0.67
0.00 0.20 0.94
0.27 0.27 0.04 0.01 0.82 0.95 0.25 0.04 0.00 0.73 1.36 0.92
Precipitation
Temperature
Variables
Bias (8C) RMSE (8C) Spatial correlation Bias (mm day21) RMSE (mm day21) Spatial correlation
20.73 1.36 0.92
0.21 0.16 0.01
20.33 0.68 0.98
20.33 0.72 0.97
0.18 0.09 0.01
0.04 0.43 0.99
0.05 0.53 0.99
0.25 0.04 0.00
0.04 0.43 0.99
0.05 0.53 0.99
0.00 0.22 1.00
5-yr avg
Mul_Reg
15-yr avg Std dev 5 yr 5-yr avg
PEA_ROC
15-yr avg Std dev 5 yr 5-yr avg
PEA_RAC
15-yr avg Std dev 5-yr 5-yr avg
PEA_BRC
15-yr avg Std dev 5 yr 5-yr avg
EWA
15-yr avg Ensemble methods
TABLE 3. As in Table 2, but for winter.
7081
SUH ET AL. Std dev 5 yr
15 OCTOBER 2012
recommended, especially for the improvement of the quality of the projected regional climate. Acknowledgments. This work was supported by the CATER 2012-3081, ‘‘Production and Uncertainty Analysis of Long Term Climate Change Data over the Korean Peninsula Using Regional Climate Models and RCP Scenarios.’’ We thank all participants of this project for their efforts in conducting the model simulations and data collection. We would also like to express our sincere appreciation for the anonymous reviewers for their invaluable comments. REFERENCES Bonan, G. B., K. W. Oleson, M. Vertenstein, S. Levis, X. Zeng, Y. Dai, R. E. Dickinson, and Z. L. Yang, 2002: The land surface climatology of the Community Land Model coupled to the NCAR Community Climate Model. J. Climate, 15, 3123–3149. Casanova, S., and B. Ahrens, 2009: On the weighting of multimodel ensembles in seasonal and short-range weather forecasting. Mon. Wea. Rev., 137, 3811–3822. Cha, D.-H., and D.-K. Lee, 2009: Reduction of systematic errors in regional climate simulations of the summer monsoon over East Asia and the western North Pacific by applying the spectral nudging technique. J. Geophys. Res., 114, D14108, doi:10.1029/2008JD011176. ——, C.-S. Jin, D.-K. Lee, and Y.-H. Kuo, 2011: Impact of intermittent spectral nudging on regional climate simulation using Weather Research and Forecasting model. J. Geophys. Res., 116, D10103, doi:10.1029/2010JD015069. Chakraborty, A., and T. N. Krishnamurti, 2006: Improved seasonal climate forecasts of the South Asian summer monsoon using a suite of 13 coupled ocean–atmosphere models. Mon. Wea. Rev., 134, 1697–1721. Christensen, J. H., F. Boberg, O. B. Christensen, and P. Lucas-Picher, 2008: On the need for bias correction of regional climate change projections of temperature and precipitation. Geophys. Res. Lett., 35, L20709, doi:10.1029/2008GL035694. ——, E. Kjellstro¨m, F. Giorgi, G. Lenderink, and M. Rummukainen, 2010: Weight assignment in regional climate models. Climate Res., 44, 179–194. Coppola, E., F. Giorgi, S.-A. Rauscher, and C. Piani, 2010: Model weighting based on mesoscale structures in precipitation and temperature in an ensemble of regional climate models. Climate Res., 44, 121–134. Feng, J., D.-K. Lee, C. Fu, J. Tang, Y. Sato, H. Kato, J. L. Mcgregor, and K. Mabuchi, 2011: Comparison of four ensemble methods combining regional climate simulations over Asia. Meteor. Atmos. Phys., 111, 41–53, doi:10.1007/s00703-010-0115-7. Fu, C., and Coauthors, 2005: Regional Climate Model Intercomparison Project for Asia. Bull. Amer. Meteor. Soc., 86, 257–266. Giorgi, F., and L. O. Mearns, 2002: Calculation of average, uncertainty range, and reliability of regional climate changes from AOGCM simulations via the ‘‘reliability ensemble averaging’’ (REA) method. J. Climate, 15, 1141–1158. Grell, G. A., J. Dudhia, and D. R. Stauffer, 1994: A description of the fifth-generation Penn State/NCAR Mesoscale Model (MM5). NCAR Tech. Note NCAR/TN-3981STR, 122 pp.
7082
JOURNAL OF CLIMATE
Hong, S.-Y., and Y.-B. Yhang, 2010: Implications of a decadal climate shift over East Asia in winter: A modeling study. J. Climate, 23, 4989–5001. Juang, H.-M. H., S.-Y. Hong, and M. Kanamitsu, 1997: The NCEP Regional Spectral Model: An update. Bull. Amer. Meteor. Soc., 78, 2125–2143. Kanamaru, H., and M. Kanamitsu, 2007: Scale-selective bias correction in a downscaling of global analysis using a regional model. Mon. Wea. Rev., 135, 334–350. Kanamitsu, M., W. Ebisuzaki, J. Woollen, S.-K. Yang, J.-J. Hnilo, M. Fiorino, and G. L. Potter, 2002: NCEP–DOE AMIP-II Reanalysis (R-2). Bull. Amer. Meteor. Soc., 83, 1631–1643. Kang, H.-S., and S.-Y. Hong, 2008: Sensitivity of the simulated East Asian summer monsoon climatology to four convective parameterization schemes. J. Geophys. Res., 113, D15119, doi:10.1029/2007JD009692. ——, D.-H. Cha, and D.-K. Lee, 2005: Evaluation of the mesoscale model/land surface model (MM5/LSM) coupled model for East Asian summer monsoon simulations. J. Geophys. Res., 110, D10105, doi:10.10292004JD005266. Kharin, V., and F. Zwiers, 2002: Climate predictions with multimodel ensembles. J. Climate, 15, 793–799. Kim, M.-K., I.-S. Kang, and C.-K. Park, 2004: Super ensemble prediction of regional precipitation in decadal time series. Int. J. Climatol., 24, 777–790. Krishnamurti, T. N., C. M. Kishtawal, T. LaRow, D. Bachiochi, Z. Zhang, E. Williford, S. Gadgil, and S. Surendran, 1999: Improved weather and seasonal climate forecasts from multimodel superensemble. Science, 285, 1548–1550. ——, ——, Z. Zhang, T. LaRow, D. Bachiochi, and E. Williford, 2000: Multimodel ensemble forecasts for weather and seasonal climate. J. Climate, 13, 4196–4216. Kug, J.-S., J.-Y. Lee, and I.-S. Kang, 2007: Global sea surface temperature prediction using a multimodel ensemble. Mon. Wea. Rev., 135, 3239–3247. Leduc, M., and R. Laprise, 2009: Regional climate model sensitivity to domain size. Climate Dyn., 32, 833–854. Lee, D. K., and M. S. Suh, 2000: Ten-year Asian summer monsoon simulation using a regional climate model (RegCM2). J. Geophys. Res., 105 (D24), 29 565–29 577. ——, D. H. Cha, and H. S. Kang, 2004: Regional climate simulation for the 1998 summer flood over East Asia. J. Meteor. Soc. Japan, 82, 1735–1753. Miguez-Macho, G., G. L. Stenchikov, and A. Robock, 2005: Regional climate simulations over North America: Interaction of local processes with improved large-scale flow. J. Climate, 18, 1227–1246. Murphy, J. M., D. M. H. Sexton, D. N. Barnett, G. S. Jones, M. J. Webb, M. Collins, and D. A. Stainforth, 2004: Quantification of
VOLUME 25
modelling uncertainties in a large ensemble of climate change simulations. Nature, 430, 768–772, doi:10.1038/nature02771. Palmer, T. N., and Coauthors, 2004: Development of a European Multimodel Ensemble System for Seasonal-to-Interannual Prediction (DEMETER). Bull. Amer. Meteor. Soc., 85, 853– 872. Park, E.-H., S.-Y. Hong, and H.-S. Kang, 2008: Characteristics of an East-Asian summer monsoon climatology simulated by the RegCM3. Meteor. Atmos. Phys., 100, 139–158. Peng, P., A. Kumar, H. Van den Dool, and A. G. Barnston, 2002: An analysis of multimodel ensemble predictions for seasonal climate anomalies. J. Geophys. Res., 107, 4710, doi:10.1029/ 2002JD002712. Qian, J.-H., and L. Zubair, 2010: The effect of grid spacing and domain size on the quality of ensemble regional climate downscaling over South Asia during the northeasterly monsoon. Mon. Wea. Rev., 138, 2780–2802. Reynolds, R. W., N. A. Rayner, T. M. Smith, D. C. Stokes, and W. Wang, 2002: An improved in situ and satellite SST analysis for climate. J. Climate, 15, 1609–1625. Simmons, A., S. Uppala, D. Dee, and S. Kobayashi, 2006: ERAInterim: New ECMWF reanalysis products from 1989 onwards. ECMWF Newsletter, No. 110, ECMWF, Reading, United Kingdom, 25–35. Skamarock, W. C., J. B. Klemp, J. Dudhia, D. O. Gill, D. M. Barker, W. Wang, and J. G. Powers, 2005: A description of the Advanced Research WRF version 2. NCAR Tech. Note NCAR/TN-4681STR, 100 pp. Tebaldi, C., and R. Knutti, 2007: The use of the multi-model ensemble in probabilistic climate projections. Philos. Trans. Roy. Soc. London, A365, 2053–2075. Von Storch, H., H. Langerberg, and F. Feser, 2000: A spectral nudging technique for dynamical downscaling purposes. Mon. Wea. Rev., 128, 3664–3673. Weigel, A. P., R. Knutti, M. A. Liniger, and C. Appenzeller, 2010: Risks of model weighting in multimodel climate projections. J. Climate, 23, 4175–4191. Yhang, Y.-B., and S.-Y. Hong, 2008a: A simulated climatology of the East Asian summer monsoon using a regional spectral model. Asia-Pac. J. Atmos. Sci., 44, 325–339. ——, and ——, 2008b: Improved physical processes in a regional climate model and their impact on the simulated summer monsoon circulation over East Asia. J. Climate, 21, 963– 979. Yun, W. T., L. Stefanova, and T. N. Krishnamurti, 2003: Improvement of the multimodel superensemble technique for seasonal forecasts. J. Climate, 16, 3834–3840.