q NIAB 2003 ISSN 1479-2621
Plant Genetic Resources 1(2-3); 103–113 DOI: 10.1079/PGR200317
Development of new marker methods—an example from oil palm Zuzana Price1*, Alan H. Schulman2 and Sean Mayes1 1
Cambridge University, Department of Genetics, Downing Site, Downing Street, Cambridge CB2 2EH, UK and 2MTT/BI Plant Genomics Laboratory, Institute of Biotechnology, Viikki Biocenter, P.O. Box 56, FIN-00014 University of Helsinki, Finland and Plant Breeding Biotechnology, MTT Agrifood Research Finland, Jokioinen, Finland
Received 2 January 2003; Accepted 19 June 2003
Abstract This paper reviews marker methods based on retrotransposons and illustrates examples from oil palm. Prior to this study, very little had been known about the repetitive DNA present in oil palm and no marker systems based on retrotransposons had been developed. Firstly, copialike retrotransposons of Elaeis oleifera, Elaeis guineensis and Cocos nucifera were characterized by performing phylogenetic analyses on a portion of the reverse transcriptase (RT) gene of copia-like retrotransposons. The results identified three classes of copia-like retrotransposons in the three species studied. While the C-class RT sequences seemed to have amplified preferentially only in Elaeis guineensis, the classes A and B were present in Elaeis guineensis and Cocos nucifera as well. Secondly, long terminal repeats (LTRs) from these retrotransposon classes were isolated as a prelude to developing a marker system in palm based on retrotransposons. The B- and C-class LTRs were isolated by primer walking from the RT region and the B-class from Elaeis oleifera and Cocos nucifera with the use of oil palm-specific RnaseH primers. The method has been developed and applied for breeding purposes in oil palm, hybrids between E. oleifera and E. guineensis and within the tribe Cocoeae. There is scope for the method to be used in the isolation of new retrotransposon families endogenous for each palm species and as an alternative to amplified fragment length polymorphism (AFLP) in diversity studies within the Palmae.
Keywords: Elaeis guineensis; Elaeis oleifera; Cocos nucifera; copia-like retrotransposons; diversity Introduction
markers because of their ability to integrate into a multitude of loci in the genome and thereby generate insertional polymorphisms between individuals. RTNs encode the proteins needed for their own propagation, and through cycles of replication have come to represent major fractions of the genome in many eukaryotes. While in this way they are both ‘selfish’ and parasitic, RTNs nevertheless can be of potential benefit to their host.
The genetic variation inherent in most species provides both the basis for breeding and natural selection and the means to track these processes. Genetic variation is associated with polymorphisms in DNA sequences, which can be studied by using molecular markers. Molecular marker technology is playing a vital role in plant biology, including DNA fingerprinting, genetic linkage mapping and phylogenetic studies to reveal ancestry. Retrotransposons (RTNs) can be used as a source of informative
Marker methods based on retrotransposons
* Corresponding author. E-mail:
[email protected]
Long terminal repeat (LTR) RTNs are ubiquitous in plant genomes (Flavell et al., 1992; Kubis et al., 1998) and often
104
present in high copy number. They are widely dispersed on chromosomes and widely distributed within the euchromatin domains of chromosomes in plants (Pearce et al., 1997; Castilho et al., 2000) whereas their distribution in heterochromatin may differ between plant species (Pearce et al., 1996). Ty3-gypsy elements show a preference for centromeric regions and may colocalize with rRNA genes (Presting et al., 1998; BalintKurti et al., 2000). Sequence heterogeneity is high among retroelements, associated with the comparatively low fidelity of both transcription and reverse transcription, resulting in accelerated sequence divergence (Gabriel and Mules, 1999). Because of their ubiquity and diversity, RTNs have great potential as genetic markers for plant genome and biodiversity analysis (Lee et al., 1990; Kumar et al., 1997; Waugh et al., 1997; Ellis et al., 1998; Kalendar et al., 1999; Pearce et al., 2000). There have been several marker systems based on LTR RTNs, including sequence-specific amplified polymorphism (SSAP), inter-retrotransposon amplified polymorphism (IRAP) and retrotransposon-microsatellite amplified polymorphism (REMAP), developed for plants (Waugh et al., 1997; Ellis et al., 1998; Kalendar et al., 1999). In the case of RTN-based markers, polymorphisms are generated by retrotransposition, which is a unidirectional process resulting in insertions of RTN daughter copies into new sites without removal of the parental copies from their sites. The consequence of retrotransposition is the alteration of a target site by integration of a few
Zuzana Price et al.
hundred base pairs to a few kilobases. By contrast, marker systems based on simple sequence repeats (SSRs) detect random, small-scale (i.e. from one up to a few tens of nucleotides) and bi-directional changes at a particular locus between individuals of the same species. Genomic locations of MITE (miniature inverted transposable element) transposons are also variable within species. These polymorphisms have been successfully exploited as genetic markers in maize and rice (Casa et al., 2000; Chang et al., 2001). The fact that MITEs reside close to genes and the high sequence identity within some families such as Heartbreaker (Hbr) makes them useful genetic markers (Casa et al., 2000; Chang et al., 2001), although they may not stay stably integrated. The SSAP (Fig. 1) method is a modified version of amplified fragment length polymorphism (AFLP; Vos et al., 1995), in which one AFLP primer is replaced with an LTR primer. REMAP (Fig. 2) exploits polymorphisms among amplicons produced between anchored microsatellite sequences and RTNs. IRAP (Fig. 3) amplifies segments lying between two LTR sequences in any orientation. Retrotransposon-based insertional polymorphism (RBIP) involves polymerase chain reaction (PCR) with primers derived from the RTN and flanking sequences to codominantly score for the presence or absence of an insertion at specific loci. Retrotransposon internal variation polymorphism (RIVP; Fig. 4) exploits heterogeneity of an internal structure of a RTN in a PCR-based SSAP method (Vershinin and Ellis, 1999).
Fig. 1. SSAP (sequence-specific amplified polymorphism). DNA is digested with one or two enzymes, adapters are ligated to all cut fragments, and the product is used for PCR. The choice of enzyme is dependent on the fact that it should cut in the flanking DNA but not within the LTR between the priming site and the terminus. PCR is performed using primers complementary, respectively, to the adapter and to ends of LTRs (arrows). Insertional polymorphisms are visualized as dominant bands on a sequencing gel. The SSAP method has been applied in barley (Kumar et al., 1997; Waugh et al., 1997), peas (Ellis et al., 1998; Pearce et al., 2000), wheat (Gribbon et al., 1999), Medicago (Porceddu et al., 2002), tobacco (Melayah et al., 2001) and grapevine (Pelcy and Merdinoglu, 2002).
Development of new marker methods
105
crop plants, managing genetic resources in genebanks, for fingerprinting of existing or new crop plant varieties and for mapping agronomically important traits and resistance to diseases. Some of the recent applications are described below.
Fig. 2. REMAP (retrotransposon microsatellite amplified polymorphism). PCR primers (black arrows) face each other respectively from the end an LTR and the proximal end of a microsatellite. The microsatellite is anchored at its flank. Microsatellites and retrotransposons appear to be often associated (Ramsay et al., 1999; Castilho et al., 2000). This method was used in barley (Kalendar et al., 1999; Manninen et al., 2000; Vicient et al., 2001); in producing a highdensity cytogenetic map of Aegilops tauschii (Boyko et al., 2002); and in studying the genomic stability of an allopolyploid Spartina anglica (Baumel et al., 2002).
The LTR sequences for developing marker methods based on RTNs can be isolated either by primer walking from the reverse transcriptase gene or can be mined from databases for some crops. However, the development of a rapid technique for isolating LTRs made this process faster and easier (Pearce et al., 1999). Marker systems based on LTR RTNs such as SSAP (Waugh et al., 1997), IRAP and REMAP (Kalendar et al., 1999) and RBIP (Ellis et al., 1998) provide useful genetic markers for saturating existing genetic maps, for assessing biodiversity within
Identifying new insertions RTNs increase their copy number by replication followed by insertion of a new copy into the genome. It is possible to visualize those insertions with RTN-based marker methods. Melayah et al. (2001) showed that 38 out of 41 new RTN marker bands corresponded to de novo insertions of Tnt1 in stressed tobacco plants. The IRAP method was also used in identifying new insertions of BARE-1 element in an interspecific hybrid in Spartina (cordgrass; Baumel et al., 2002). BARE-1 is an active, copia-like RTN (Ja¨a¨skela¨inen et al., 1999), which shows remarkable variation among species in the genus Hordeum and among populations of the wild barley species Hordeum spontaneum (Vicient et al., 1999; Kalendar et al., 2000). Approximately 100 years after its formation, the parental marker bands were still additive and few new insertions were observed in the interspecific Spartina hybrid (Baumel et al., 2002). Novel BARE-1 insertions were observed by Yu and Wise (2000) in
Fig. 3. IRAP (inter-retrotransposon amplified polymorphism). IRAP amplifies polymorphism between two LTR sequences in any orientation. There is no need to digest genomic DNA with enzymes. PCR is performed with one or two LTR primers. The figure illustrates bands that might be observed when either or both of two primers (black and white arrows) matching the LTR and oriented in either the sense (black) or antisense (white) direction with respect to the coding region are used. The retrotransposons can be in the three possible orientations shown. Insertional polymorphisms are visualized as polymorphic, dominant bands on either sequencing or on agarose gels. This method was first implemented in Hordeum by Kalendar et al. (1999) and since then has used by Kalendar et al. (2000) and Vicient et al. (2000) for fingerprinting and biodiversity analysis, and for mapping of agronomically important traits by Manninen et al. (2000) and Boyko et al. (2002). Baumel et al. (2002) investigated genomic stability of an allopolyploid (Spartina anglica) with the use of this method. Price et al. (2002a) reported development and application of IRAP for oil palm.
106
Zuzana Price et al.
Fig. 4. RIVP (retrotransposon internal variation polymorphism). DNA is digested with one or two enzymes, adapters are ligated to all cut fragments and the mixture is used for PCR. PCR is performed using primers complementary to the adapter and primers that are complementary to GAG (arrows). Insertional polymorphism appears as polymorphic, dominant bands on a sequencing gel. The profile of amplified products is visualized on a sequencing (PAGE) gel. This method has been used for studying genetic diversity in 56 Pisum accessions (Vershinin and Ellis, 1999).
recombinant inbred (RI) lines of Avena. Over a broad range of grasses, BARE-1 is actively expressed (Vicient et al., 2001).
Linkage analyses and mapping of agronomic traits Kenward et al. (1998) cloned and sequenced a randomly amplified polymorphic DNA (RAPD) maker associated with black root resistance in tobacco and found it to be a part of the retrotransposon Tnd-1. The Tnd-1 RTN is present in multiple copies in Nicotiana debneyi, a wild progenitor of Nicotiana tabacum, and it is believed to have been introgressed into cultivated tobacco in association with the black root resistance gene. A BARE-1 RTN was found to be located 0.28 cM from the Mla locus, a member of a multigene family that confers resistance to powdery mildew (Erysiphe graminis). Analysis of nested complexes of LTR RTNs adjacent to the Mla locus showed that the present Mla locus evolved over a period of more than seven million years via duplication, inversion and transposon-insertion events and that meiotic recombination was not favoured as a means of diversification of this locus (Wei et al., 1999, 2002). Bhattacharyya et al. (1997) isolated and characterized the low copy copia-like RTN Tgmr, tightly linked to the Rps1-k allele that confers race-specific resistance to Phytophtora sojae in soybean. Schneider et al. (1999) identified a PDR-1-based marker closely associated (, 0.5 cM) with the gene Sym19 which is likely to be involved in the early stages of nodule formation in peas. SSAP analysis was used for constructing linkage maps in
barley (Waugh et al., 1997), peas (Ellis et al., 1998), oat (Yu and Wise, 2000), and IRAP was used for oil palm (Price et al., 2002a). Manninen et al. (2000) identified 10 REMAP markers linked to seedling resistance to net blotch in barley and suggested the possibility of applying RTN markers in mapped-based cloning. RTN markers are often clustered as observed by Manninen et al. (2000) and some clustering of BARE-1-based SSAP markers is obvious in Yu and Wise’s (2000) map of Avena as well. Boyko et al. (2002) mapped 80 RTN (IRAP and REMAP) markers on to a high-density cytogenetic map of Aegilops tauschii. Although most of the RTN loci were clustered in pericentromeric regions, some mapped into gene islands. RTN clusters coincided with the areas of lower recombination frequency and thus clustering most likely reflects the structure of the grass genome in which ‘gene islands’ are surrounded by ‘repeat seas’ (Panstruga et al., 1998). Similarly in Arabidopsis, higher RTN density coincided with regions of lower recombination (Arabidopsis Genome Initiative, 2000).
Biodiversity, phylogeny and varietal classification Phylogenetic analysis of a portion of the RT gene revealed a complex relationship between RTNs within the Triticeae (Gribbon et al., 1999; Matsuoka and Tsunewaki, 1999). These studies showed that many groups were shared though some were species-specific. The lowest organizational level consists of a subgroup that is shared among closely related species but not shared among distant relatives. The subgroups cluster
Development of new marker methods
into supergroups (such as BARE1 and Tta15) that are present across the entire extent of the Gramineae. The cladistic topology of RTNs in the Triticeae is consistent with a long history of replication and integration, combined with the more recent emergence of new variants. The insertional polymorphism of BARE-1 RTNs in the Triticeae was examined by SSAP analysis (Gribbon et al., 1999). The analysis revealed common bands shared by members of the Triticeae. However, various RTNs exhibit different degrees of insertional polymorphism within the same species (Gribbon et al., 1999). SSAP markers cannot be attributed solely to retroelement mobility because of the contribution of variability in the occurrence of restriction sites to the overall observed polymorphism. Vicient et al. (2001) used IRAP to examine insertional polymorphism of the BARE-1 retroelement in the grass family. The authors reported amplification of bands not only in the tribes Triticeae (Triticum spp.) and Erhathoideae (Oryza spp.) but also for the cordgrass tribe Chloroideae and for maize (tribe Panicoideae). Furthermore, IRAP polymorphisms revealed that Aegilops tauschii, the D-genome donor to the bread wheat (Triticum aestivum), shares with bread wheat monomorphic bands that may represent BARE-1 copies integrated prior to the advent of T. aestivum. The prevalence of RTNs in IRAP is consistent with the observed retroelement clusters in grasses (San Miguel et al., 1996; Panstruga et al., 1998; Shirasu et al., 2000). Iwamoto et al. (1999) used intron-2 of the Oryza sativa CatA catalase gene, which shows similarity to the retroposon p-SINE1, for phylogenetic studies within genus Oryza. His studies revealed that Oryza species with genomes other than AA do not possess the CatA homologue with an intron-2. Tatout et al. (1999) applied SINE1 insertions (the presence or absence of SINE1 at a given genomic site) and a microsatellite-like variation of S1 30 poly(A) tails as a classification criterion for evaluating phylogenetic relationships within Brassica oleareacea complex. RTN insertional polymorphism was exploited in varietal classification of barley (Gribbon et al., 1999; Kalendar et al., 1999), Hibiscus (Lee et al., 2002), Citrus clementina (Breto et al., 2001) and grapevine (Pelcy and Merdinoglu, 2002). Vershinin and Ellis (1999), Ellis et al. (1998) and Pearce et al. (2000) used RBIP and SSAP analysis for assessing patterns of genetic diversity and phylogeny within 56 accessions of the genus Pisum. Vershinin and Ellis (1999) estimated a phylogenetic tree based on the gag gene of the PDR1 RTN and Pearce et al. (2000) combined data from four different pea RTNs with contrasting integrational histories (i.e. the time and rate of integration). The data indicated that each element shows a high level of polymorphism but a different level of fixation
107
within the species studied as revealed by Fst (level of fixation) and Nei’s genetic distance. The finding that each element provides a high resolution for the Pisum lineages in which it has been active suggests that individual elements may proliferate differently as each diversifies through evolution. Both the gag and the combined phylogenetic trees resolved the Pisum accessions into four main clusters corresponding to different Pisum species lineages.
Genomic diversity Kalendar et al. (1999) examined genomic diversity within a natural population of wild barley (Hordeum spontaneum) with the use of a REMAP marker system. They described patterns of RTN accumulation on a local spatial scale. The barley plants studied represented six natural populations growing under different conditions distributed across a 300 m transect of a single canyon in Israel. They observed variation in genome size which spanned across an environmental gradient and noted that plants from stressed sites (dry and south facing) had larger genome sizes. Using the REMAP marker system they examined transpositional activity of BARE-1 RTN and were able to distinguish clearly populations from southfacing slopes and populations from north-facing slopes. An important implication of this study is that the positive correlation between the height of the canyon and the BARE-1 copy number and observed BARE-1 transpositional activity might represent co-adaptation to environmental conditions on a local ecological scale (i.e. plants from stressed sites have the highest ratio of full-length to solo LTRs).
Gene tagging The ability of some LTR RTNs to insert into low-copy regions (Tos17, Yamazaki et al., 2001; Tto1, Okamoto and Hirochika, 2000) can be used for gene tagging (reviewed by Kumar and Hirochika, 2001). The ability of Tos17 to produce mutations has been exploited by Hirochika (2001) in generating mutant lines. The insertion into a particular gene can be identified by PCR with gene-specific and RTN-specific primers using DNA samples from a pool of mutant lines. The insertional polymorphisms are identified within a DNA pool by using a two- or three-dimensional pooling system. Several genes isolated from the tagged mutants by PCR screening for pooled DNAs of Tos17 transposed lines have been reported (a mutant of the homeobox gene OSH15, Sato et al., 1999; a mutant of the phytochrome A ( phyA) photoreceptors in plants, Takano et al., 2001).
108
Okamoto and Hirochika (2000) reported that Tto1, the tobacco LTR RTN, is activated in Arabidopsis during tissue culture. The analysis of sequences flanking the Tto1 insertion showed that many of the amplified products exhibit homology to known genes or hypothetical proteins. The authors suggested that Tto1 could be used as a tool for efficient insertion mutagenesis of Arabidopsis.
Oil palm Palms are woody monocotyledons in the family Arecaceae, which is placed in the order Arecales ( Jones, 1994). Oil palm, Elaeis guineensis, plays a vital role in the economy of many developing countries in SouthEast Asia, such as Malaysia and Indonesia. The major advantages of oil palm are firstly its high yield, and secondly the fact that two distinct oils (which can be used for different purposes) are produced. In addition, palm oil also has potential in development of alternative technologies, such as bio-fuel. Copia-like RTNs of Elaeis guineensis, Elaeis oleifera and Cocos nucifera were characterized by performing phylogenetic analyses on a portion of the RT gene of copialike RTNs. In addition to this, the aim of this work was to develop a marker system based on copia-like RTNs in oil palm. A prerequisite for such a marker system is the isolation of LTRs. The LTRs, a characteristic feature of LTR RTNs, are oriented as direct repeats at termini of members of this class of elements. Although LTRs do not encode proteins, they contain promoters and terminators necessary for transcription of the RTNs. In addtion, the LTRs are recognized by the RTN-encoded integrase that inserts the element into the genome. The LTRs are divided into three regions: the U3 region, the R region and the U5 region (reviewed in Kumar and Bennetzen, 1999).
Materials and methods A PCR reaction was carried out using degenerate primers as described in Flavell et al. (1992) and Price et al. (2002b) in order to amplify a band of approximately 280 base pairs corresponding to part of the RT domain of copia-like RTNs. The primers correspond to domains conserved on the protein level within RTs. Multiple sequence alignments were made with Clustal W (Thompson et al., 1994), using the default gap insertion/extension penalties. Phylogenetic reconstruction of the aligned sequences was performed by using maximum likelihood, with PAUP* 4.0b10 (Swofford, 2001). Model for maximum likelihood (ML) (HKY þ I þ G) was calculated by Modeltest3-04 (Posada and Crandall, 1998).
Zuzana Price et al.
Using two different approaches, oil palm LTRs, the basis for a marker system, were isolated. Firstly, primer-walking from the RT region of the C- and B-class to the LTR of the element was performed. Secondly, the LTRs from oil palm (D-class), Elaeis oleifera (B-class) and Cocos nucifera (Bclass) were identified by using a modified method of Pearce et al. (1999, 2000) and by using RnaseH primers specific to oil palm LTRs isolated originally by primer walking (Fig. 5). The IRAP (Fig. 3) PCR amplification was performed in a Hybaid PCR Express machine using the protocol of Kalendar et al. (1999). Following the PCR reaction, 20 ml of gel loading buffer containing formamide were added to each sample. Products were analysed by electrophoresis on a denaturing 4.5% PAGE sequencing gel (Sambrook and Russell, 2001) and visualized by autoradiography using Kodak MR film. The reproducibility of each primer combination was tested in two separate amplifications and on two different Hybaid PCR Express machines. Clones that did not identify a match to any known RTN sequence in the databases were not used as the basis for developing the marker system.
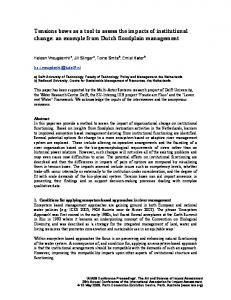
Results and discussion The results confirmed previous results of Price et al. (2002b) and demonstrated that no lineages that include RT sequences from just Cocos nucifera and Elaeis oleifera were detected. The C-class RT sequences seem to have amplified preferentially only in Elaeis guineensis (Fig. 6). The unrooted phylogram of RT sequences exhibits a similar pattern to that revealed in the oil palm tree (Price et al., 2002b). It shows that: class C1 sequences are present only in oil palm, and that class C2 includes one coconut and two E. oleifera sequences. In addition to this it also illustrates that class B is present in all the three species and divides into two subclasses and that class A consists of many subclasses. The phylogenetic topologies of retroelements are often interpreted at three levels: the length of the main branches indicate heterogeneity of RT sequences; clustering of related elements defines groups and the highly unresolved terminal branches indicate the explosive proliferation associated with the transposition process (Feschotte et al., 2002). The C1-class is associated with highly unresolved, ‘star’-like trees which might be an indication that the C1-class RT sequences diverged rapidly at the same time. Futhermore, we have developed a method based on a medium copy number (,10,000 copies) family of copialike RTNs in oil palm. This PCR-based approach detects individual RTN insertions using primers derived from the RTN. The insertions can be seen as bands on a sequencing gel; the polymorphic bands (polymorphic markers) are then detected as an absence or presence
Development of new marker methods
109
Fig. 5. Phylogram of oil palm, coconut and E. oleifera RT sequences. Phylogenetic reconstruction of the aligned sequences was performed by using maximum likelihood, with PAUP* 4.0b10 (Swofford, 2001). The numbers at the ends of the branches indicate individual RT DNA sequences (op—oil palm, CN—coconut, EO—E. oleifera, aj series—oil palm and Ecorep—coconut RT sequences from NCBI). The numbers on the branches indicate bootstrap values for the support of the branches. The branches with bootstrap values under 50 have been collapsed. A, B and C indicate RT groups and B1, B2, C1 and C2 subgroups.
of bands. The method was successfully used to detect polymorphisms in 67 samples of the DM635 cross (Fig. 7). This is a dura £ dura cross (Dami dura £ Ulu Remis) of relatively narrow genetic base central to the NBPOL dura improvement programme. The method is easily transferable between different populations and allows objective assessment of polymorphisms (Price, 2003). The study of Price (2003) indicated that AFLP and RTN-based markers in oil palm had similar numbers of polymorphic bands per primer combination but the RTN-based marker system showed a far higher proportion of polymorphic bands per band generated (approximately eight times higher; Price, 2003). A range
of breeding populations of restricted origin (BPRO) has been tested, such as POBE, LAME, Yangambi, Deli dura, Avros and others, documented by Rosenquist (1985), as well as hybrids between E. oleifera and E. guineensis. The number of polymorphic bands per primer combination in the DM635 cross ranged from one to 16 with an average of six. The primer combinations between B- and C-, and B- and D-classes were the most polymorphic ones, producing on average seven polymorphic bands per primer combination (Table 1). Preliminary results demonstrated the possibility of applying the method to not only breeding purposes in oil palm but also within closely related species such as
110
coconut (Price, 2003). However, the primers for the tribe Cocoeae have not been applied palm subfamilies. The authors believe that scope for applying the approach in botanical within the family Palmae and for assessing
Zuzana Price et al.
isolated to other there is research diversity
Fig. 7. Application of an IRAP marker system in oil palm (Elaeis guineensis Jacq.), mapping population DM635. The autoradiograph above of a 4.5% PAGE gel shows bands generated by primer combinations between LTR5r (labelled with g33P) and LTR2.7r (a), LTR5r and LTRole7r (b), LTR5r and LTR4.1r (c), LTR5r and LTR15r (d), LTR 5r and LTRole6r (e). The samples used were of DM635 (lanes 1– 4), one of Elaeis oleifera (lane 5) and one of Elaeis guineensis and Elaeis oleifera hybrid (lane 6). The primers LTRole6r and LTRole7r were based on Elaeis oleifera LTR sequence (note the stronger signal in the E. oleifera lane).
Fig. 6. LTR isolation method with the use of RnaseH primer RnaseHOP4 (B-class). The figure shows an autoradiograph of a 6% PAGE (polyacrylamide) sequencing gel. Templates for the PCR reaction were partially digested oil palm DNAs (samples 1– 8) ligated into T-GEM easy vector (Promega). The template DNAs (lanes 1– 8) were digested with the enzymes Eco RI, Msp I, Mse I and Sau3AI (Invitrogen) as indicated. The PCR reaction was performed by using the oil palm RnaseH primer labelled with g33P (B-class, RnaseHOP4) and M13 universal primers. The samples 1, 3, 4, 7 and 8 were excised, re-amplified and sequenced (for details see Pearce et al., 2000).
Development of new marker methods
111
Table 1. PCR primer used in the IRAP marker system Primer combination LTR5r þ LTR7r LTR5r þLTR3f LTR5r þ LTR6r LTR5r þ LTR5r LTR5r þ LTR1f LTR6f þ LTR7r LTR5r þ LTR14br LTR5r þ LTR2.7r LTR5.3r þ LTR5r LTR5r þ LTR15r LTR4.1r þ LTR5r LTR6f þ LTR5.3r LTRole1f þ LTR5r LTR5r þ LTR14r LTRole6r þ LTR5r LTR7r1 þ LTR5r
LTR combination
Polymorphic bands
BD BB BD BB BB BD BC BD BD BC BD BD BoB BC BoB BD
9 2 5 2 2 2 7 8 7 12 9 16 8 4 2 1
The DNA sequences for each primer are detailed in Price (2003). LTRole1f, LTRole6r, LTRole6f and LTRole7r were isolated from Elaeis oleifera.
within endangered palm species and the palm species stored in genebanks. For this purpose the method can also be used for isolation of new RTN families endogenous for each palm species as suggested by Mhiri and Grandbastien (2001) for Solanaceae. There is a great need for easily developed, new marker systems not requiring extensive sequencing, as do single nucleotide polymorphism (SNP) or microsatellite-based markers. Many plants will not be subjects of major cDNA or genomic sequencing projects. The intriguing aspect about repetitive DNA, mostly RTNs and up to 80% of many genomes, is that it can itself be used as a genetic tool to analyse plant genomes and thereby improve our knowledge about the biology of plants. There are significant applications for RTNs in determining phylogeny (ancestry), for assessing diversity of wild, cultivated or endangered species, and in functional analyses of plant genes. For the future, the methods and analyses presented here could be used as tools for understanding one of the underlying mechanisms of plant diversity that has shaped and is still shaping plant genomes.
References Arabidopsis Genome Initiative (2000) Analysis of the genome sequence of the flowering plant Arabidopsis thaliana. Nature 408: 796– 815. Balint-Kurti PJ, Clendennen SK, Dolezelova M, Valarik M, Dolezel J, Beetham PR and May GD (2000) Molecular Genetics and Genomics 263: 908 –915. Baumel A, Ainouche M, Kalendar R and Schulman AH (2002) Retrotransposons and genomic stability in populations of the young allopolyploid species Spartina anglica C.E.
Hubbard (Poaceae). Molecular Biology and Evolution 19: 1218 – 1227. Bhattacharyya MK, Gonzales RA, Kraft M and Buzzll RI (1997) A copia-like retrotransposon Tgmr closely linked to the R K allele that confers race specific resistance to soybean to Phytophthora sojae. Plant Molecular Biology 34: 255–264. Boyko E, Kalendar R, Korzun V, Fellers J, Korol A, Sculman AH and Gill BS (2002) A high-density cytogenetic map of the Aegilops tauschii genome incorporating retrotransposons and defence-related genes: insights into cereal chromosome structure and function. Plant Molecular Biology 48: 767– 790. Breto MP, Ruiz C, Pina JA and Asins MJ (2001) The diversification of Citrus clementina Hort. Ex Tan., a vegetatively propagated crop species. Molecular Phylogenetics and Evolution 21: 285– 293. Casa AM, Brouwer C, Nagel A, Wang L, Zhang Q, Kresiwich S and Wessler SR (2000) The MITE family Heartbreaker (Hbr): molecular markers in maize. Proceedings of the National Academy of Science USA 97: 10083– 10089. Castilho A, Vershinin A and Heslop-Harrison JS (2000) Repetitive DNA and the chromosomes in the genome of oil palm (Elaeis guineensis). Annals of Botany 85: 837– 844. Chang RY, O’Donoughue LS and Bureau TE (2001) Inter-MITE polymorphisms (IMP): a high throughput transposonbased genome mapping and fingerprinting approach. Theoretical and Applied Genetics 102: 773– 781. Ellis THN, Poyser IJ, Knox MR, Vershinin AV and Ambrose MJ (1998) Ty1 copia class retrotransposon insertion site polymorphism for linkage and diversity analysis in pea. Molecular Genetics and Genomics 260: 9– 19. Feschotte C, Jiang N and Wessler SR (2002) Plant transposable elements: where genetics meets genomics. Nature Reviews 3: 329– 341. Flavell AJ, Dunbar E, Anderson R, Pearce SR, Hartley R and Kumar A (1992) Ty1-copia group retrotransposons are ubiquitous and heterogeneous in higher plants. Nucleic Acids Research 20: 3639– 3644. Gabriel A and Mules EH (1999) Fidelity of retrotransposon replication. Annals of the New York Academy of Science 870: 108– 118. Gribbon BM, Pearce SR, Kalendar R, Schulman AH, Paulin L, Jack P, Kumar A and Flavell AJ (1999) Phylogeny and transpositional activity of Ty1-copia group retrotransposons in cereal genomes. Molecular Genetics and Genomics 261: 883– 891. Hirochika H (2001) Contribution of the Tos17 retrotransposon to rice functional genomics. Current Opinions in Plant Biology 4: 118– 122. Iwamoto M, Nagashima H, Nagamine T, Hogo H and Higo K (1999) p-SINE1-like intron of the CatA catalase homologs and phylogenetic relationships among AA-genome Oryza and related species. Theoretical and Applied Genetics 98: 853– 861. Ja¨a¨skela¨inen M, Mykka¨nen TA, Vicient CM, Suoniemi A, Kalendar R, Savilahti H and Schulman AH (1999) Retrotransposonn BARE-1: expression of encoded proteins and formation of virus-like particles in barley cells. Plant Journal 20: 413– 422. Jones DL (1994) Palms Throughout the World. Australia: Reed New Holland Publishers. Kalendar R, Grob T, Regina M, Suoniemi A and Schulman A (1999) IRAP and REMAP: two new retrotransposon-based
112
DNA fingerprinting techniques. Theoretical and Applied Genetics 98: 704– 711. Kalendar R, Tanskanen J, Immonen S, Nevo E and Schulman AH (2000) Genome evolution of wild barley (Hordeum spontaneum) by Bare-1 retrotransposon dynamics in response to sharp microclimatic divergence. Proceedings of the National Academy of Science USA 97: 6603– 6607. Kenward KD, Bai D, Ban MR and Brandle JE (1998) Isolation and characterization of Tnd-1, a retrotransposon marker linked to black rot resistance in tobacco. Theoretical and Applied Genetics 198: 387 –395. Kubis S, Schmidt T and Heslop-Harrison JS (1998) Repetitive DNA elements as a major component of plant genomes. Annals of Botany 82: 45– 48. Kumar A and Bennetzen JL (1999) Plant retrotransposons. Annual Review of Genetics 33: 479 – 532. Kumar A and Hirochika H (2001) Applications of retrotransposons as genetic tools in plant biology. Trends in Plant Science 6: 127–133. Kumar A, Pearce SR, McLean K, Harrison G, Heslop-Harrison JS, Waugh R and Flavell AJ (1997) The Ty1-copia group of retrotransposons in plants: genomic organisation, evolution and use as molecular markers. Genetica 100: 205 – 217. Lee DL, Ellis THN, Turner L, Hellens RP and Cleary WG (1990) A copia-like element in Pisum demonstrates the uses of dispersed repeated sequences in genetic analysis. Plant Molecular Biology 15: 707 – 722. Lee SJ, Jeung JU, Cho SK, Um BY, Chung WI, Bae JM and Shin JS (2002) Diversity and varietal classification of Hibiscus syriacus L with the heterogeneity within retrotransposonlike elements. Molecular Cells 30: 362 – 368. Manninen O, Kalendar R, Robinson J and Schulman AH (2000) Application of BARE-1 retrotransposon markers to the mapping of major resistance gene for net blotch in barley. Molecular Genetics and Genomics 264: 325 – 334. Matsuoka Y and Tsunewaki K (1999) Evolutionary dynamics of Ty1-copia group retrotransposons in grass shown by reverse transcriptase domain analysis. Molecular Biology and Evolution 16: 208 – 217. Melayah D, Bonnivard E, Chalhoub B, Audeon C and Grandbastien MA (2001) The mobility of the Tobacco Tnt1 retrotransposon correlates with its transcriptional activation by fungal factors. Plant Journal 28: 159 –168. Mhiri C and Grandbastien MA (2001) Analysis of Solanaceae biodiversity using Tnt1-related retrotransposons. In: Proceedings of the 1st ESF Meeting on ‘Retrotransposons; Their Impact on Organisms, Genomes, and Biodiversity’. Okamoto H and Hirochika H (2000) Efficient insertion mutagenesis of arabidopsis by tissue culture-induced activation of the tobacco retrotransposon Tto1. Plant Journal 23: 291– 304. Panstruga R, Blschges R, Piffanelli P and Schulze-Lefert P (1998) A contiguous 60 kb genomic stretch from barley reveals molecular evidence for gene islands in a monocot genome. Nucleic Acids Research 26: 1056– 1062. Pearce SR, Harrison G, Li D, Heslop-Harison JS, Kumar A and Flavell AJ (1996) The Ty1-copia group retrotransposons in Vicia species: copy number, sequence heterogeneity and chromosomal localisation. Molecular Genetics and Genomics 250: 305 – 315. Pearce SR, Harrison G and Heslop-Harrison JS (1997) Characterization and genomic organization of Ty1-copia retrotransposon in rye (Secale cereale). Genome 40: 617 –625. Pearce SR, Stuart-Rogers C, Knox MR, Kumar A, Ellis THN and
Zuzana Price et al.
Flavell A (1999) Rapid isolation of plant Ty1-copia retrotransposon sequences for molecular marker studies. Plant Journal 19: 711– 717. Pearce SR, Knox M, Ellis TNH, Flavell AJ and Kumar A (2000) Pea Ty1-copia group retrotransposons: transitional activity and use as markers to study genetic diversity in Pisum. Molecular Genetics and Genomics 263: 898–907. Pelcy F and Merdinoglu D (2002) Development of grape molecular markers based on retrotransposons. Poster at Plant, Animal and Microbe Genome X, San Diego. Porceddu A, Albertini E, Barcaccia G, Marconi G, Bertoli FB and Veronesi F (2002) Development of S-SAP markers based on an LTR-like sequence from Medicago sativa L. Molecular Genetics and Genomics 267: 107 –114. Posada D and Crandall KA (1998) MODEL TEST: testing the model of DNA substitution. Bioinformatics 14: 817–818. Presting GG, Malysheva L, Fuchs J and Schubert I (1998) A Ty3/ gypsy retrotransposon-like sequence localizes to the centromeric regions of cereal chromosomes. Plant Journal 16: 721– 728. Price Z (2003) Investigation of copia-like retrotransposons and their application in oil palm. PhD Thesis, Cambridge University, UK. Price Z, Dumortier F and Mayes S (2002a) Development of an application of IRAP (Inter Retrotransposon Amplified Polymorphism) based on copia-like retrotransposons in African oil palm (Elaeis guineensis Jacq.). Poster at Plant, Animal and Microbe Genome X, San Diego. Price Z, Dumortier F, MacDonald DW and Mayes S (2002b) Characterisation of copia-like retrotransposons in oil palm (Elaeis guineensis Jacq.). Theoretical and Applied Genetics 104: 860–867. Ramsay L, Macaulay M, Cardle L, Morgante M, Degli Ivanissevich S, Maestri E, Powell W and Waugh R (1999) Intimate association of microsatellite repeats with retrotransposons and other dispersed repetitive elements in barley. Plant Journal 17: 415– 425. Rosenquist E-A (1985) The genetic base of oil palm breeding populations. Proceedings of the Palm Oil Research Institute, Malaysia 10: 10– 27. Sambrook J and Russell DW (2001) Molecular Cloning, a Laboratory Manual, 3rd edn. Cold Spring Harbor, NY: Cold Spring Harbor Laboratory Press. San Miguel P, Tikhonov A, Jin YK, Motchoulskaia N, Zakharov D, Melake-Berlan A, Springer PS, Edwards KJ, Lee M, Avramova Z and Bennetzen JL (1996) Nested retrotransposons in the intergenic regions of the maize genome. Science 274: 765– 768. Sato Y, Sentoku N, Miura Y, Hirochika H, Kitano H and Matsuoka M (1999) Loss-of-function mutations in the rice homeobox gene OSH15 affect the architecture of internodes resulting in dwarf plants. EMBO Journal 18: 992– 1002. Schneider A, Walker SA, Poyser S, Sagan M, Ellis TH and Downie J (1999) Genetic mapping and functional analysis of a nodulation-defective mutant (sym19) of pea (Pisum sativum L.). Molecular Genetics and Genomics 262: 1 – 11. Shirasu K, Schulman AH, Lahaye T and Schulze-Lefert P (2000) A contiguous 66-kb barley DNA sequence provides evidence for reversible genome expansion. Genome Research 10: 908–915. Swofford DL (2001) PAUP*. Phylogenetic Analysis Using Parsimony (*and Other Methods), Version 4.0b10. Sunderland, MA: Sinauer Associates.
Development of new marker methods
Takano M, Kanegae H, Shinomura T, Miyao A, Hirochika H and Furuya M (2001) Isolation and characterization of rice phytochome A mutants. Plant Cell 13: 521 – 534. Tatout C, Warwick S, Lenoir A and Deragon JM (1999) SINE insertion as clade markers for wild crucifer species. Molecular Biology and Evolution 16: 1614 –1621. Thompson JD, Higgins DG and Gibson TJ (1994) CLUSTAL W: improving the sensitivity of progressive multiple sequence alignment through sequence weighting, position-specific penalties and weight matrix choice. Nucleic Acids Research 22: 4673 –4680. Vershinin AV and Ellis THN (1999) Heterogeneity of the internal structure of PDR1, a family of Ty1 copia-like retrotransposons. Molecular Genetics and Genomics 262: 703 – 713. Vicient CM, Suoniemi A, Anamthawat-Jonsson K, Tanskanen J, Beharav A, Nevo E and Schulman AH (1999) Retrotransposon BARE-1 and its role in genome evolution in the genus Hordeum. Plant Cell 11: 1769– 1784. Vicient CM, Ja¨a¨skela¨inen M, Kalendar R and Schulman AH (2001) Active retrotransposons are a common feature of grass genomes. Plant Physiology 125: 1283 –1292. Vos P, Hogers R, Bleeker M, Reijans M, van de Lee T, Hornes M, Frijters A, Pot J, Peleman J, Kuiper M and Zabeau M (1995)
113
AFLP: a new technique for DNA fingerprinting. Nucleic Acids Research 23: 4407 – 4414. Waugh R, McLean K, Flavell AJ, Pearce SR, Kumar A, Thomas BBT and Powell W (1997) Genetic distribution of Bare-1-like retrotransposable elements in the barley genome revealed by sequences-specific amplification polymorphisms (S-SAP). Molecular Genetics and Genomics 253: 687– 694. Wei F, Gobelman-Werner K, Moroll SM, Kurth J, Mao L, Wing RA, Leister D, Schulze-Lefert P and Wise R (1999) The Mla (powdery mildew) resistance cluster is associated with three NBS-LRR families and suppressed recombination within a 240 kb DNA interval on chromosome 5S (1HS) of barley. Genetics 153: 1929– 1948. Wei F, Wing RA and Wise R (2002) Genome dynamics and evolution of the Mla (powdery mildew) resistance locus in barley. Plant Cell 14: 1903 – 1917. Yamazaki M, Tsugawa H, Miyao A, Yano M, Wu J, Yamamoto S, Matsumoto T, Sasaki T and Hirochika H (2001) The rice retrotransposon Tos17 prefers low-copy-number sequences as integration targets. Molecular Genetics and Genomics 265: 336– 344. Yu GX and Wise RP (2000) An anchored AFLP- and retrotransposon-based map of diploid Avena. Genome 43: 736– 749.