588
IEEE TRANSACTIONS ON ENGINEERING MANAGEMENT, VOL. 54, NO. 3, AUGUST 2007
Development of New Technology Forecasting Algorithm: Hybrid Approach for Morphology Analysis and Conjoint Analysis of Patent Information Byungun Yoon and Yongtae Park
Abstract—Despite being a strong stimulus for the invention of new alternatives, morphology analysis (MA) suffers the limitations of being a nonquantitative, vague, and static methodology. As a consequence, the MA outcomes typically do not provide practical technology opportunities. This paper, therefore, proposes a new hybrid approach that enhances the performance of MA by combining it with conjoint analysis (CA) and citation analysis of patent information. First, keywords are extracted from patent documents using text mining, and the morphology of existing patents is identified by these keywords. Alternatives for new technology development from among the emerging technologies are presented by combining the valuable levels of each attribute in a morphology matrix predefined by domain experts. Then, configurations of new technology are suggested in order of priority using CA, and the technological feasibility of each new configuration is subsequently investigated. The technological competitiveness of a company can be analyzed by a newly suggested index, “technology share,” which is analogous to the concept of market share in traditional CA. The proposed MA–CA hybrid process is illustrated with a case example of patent information from the thin film transistor-liquid crystal display (TFT-LCD) patent database. Index Terms—Conjoint analysis (CA), hybrid approach, morphology analysis (MA), patent information, technology forecasting.
I. INTRODUCTION ECHNOLOGY forecasting (TF) anticipates the direction and rate of technology change, and thus, facilitates the decision-making process in such managerial issues such as priority setting, resource allocation, and risk reduction for technology development. Therefore, TF can satisfy both public and private needs. The government requires TF to progress the public agendas in the face of increasing rates of technological change and under budgetary constraints [1]. Intensive economic competition among businesses means it is inevitable that TF is employed in prioritizing R&D projects, and creating strategic alliances such as licensing and joint ventures [2]. Although the ability of TF to deliver varies widely according to the level and scope of forecasting, the role of TF can be generally summarized as comprising four components. First, TF enables researchers to monitor the direction of technological growth and plan for technology development. Second, TF
T
Manuscript received September 1, 2005; revised October 1, 2006. Review of this manuscript was arranged by Department Editor A. Marucheck. B. Yoon is with the Department of Industrial and Systems Engineering, Dongguk University, Seoul 100-715, Korea (e-mail:
[email protected]). Y. Park is with the Department of Industrial Engineering, Seoul National University, Seoul 151-742, Korea (e-mail:
[email protected]). Digital Object Identifier 10.1109/TEM.2007.900796
explores new technology alternatives and the likely time needed to develop new technology. Third, researchers can identify the constraints of a technological, economic and competitive environment, and evaluate the potential of new technology development by recognizing the factors that affect opportunities and threats. Finally, TF tools can assist a broad spectrum of researchers to communicate with each other while collaborating on technology development. Forecasting the future of a technology is an intractable task beset with hazards such as the uncertainty and unreliability of data, and the complexity of real world feedback [3]. Numerous TF methods have been developed to reduce uncertainty and support the decision-making process. Although there are manifold forecasting methods, several surveys have reported that trend extrapolation and Delphi, a structured group communication process for developing consensus from an expert group, are the most widely adopted for practical usage [4]. While the two methods have been commonly used in most forecasting projects, they differ crucially in that trend extrapolation is a typical quantitative method, and on the contrary, Delphi is designed to solicit expert opinion qualitatively. The increased availability of technological databases and the introduction of innovative computational algorithms have facilitated the development of more powerful TF methods. Consequently, new forms of TF such as environmental scanning, roadmapping, bibliometric analysis and theory of inventive problem solving (TRIZ) have been suggested to meet the changing user needs [5], [6]. Recently, TF has benefited significantly from the use of computer models and simulations. The support of computerized algorithms is particularly important for TF based on bibliometric analysis or text mining. The salient problem areas and deficiencies in TF methods have been pointed out by many researchers, and can be grouped into four categories: data, model, process, and human related [7]. First, in terms of data limitations, the lack of adequate TF data history and insufficient exploitation of technological documents have been criticized. Most TF research depends on collective macro-data or the intuitive opinion of domain experts. While technological documents such as patent documents and R&D reports include ample information, the unstructured nature of the texts prevents academics and practitioners from gaining high-quality data from such sources. Second, in terms of TF model limitations, most models are very complicated to comprehend and operate, and often try to fit unruly data into a mathematical straight jacket. Moreover, the validity of assumptions in scenario development tends to become increasingly uncertain with time, while the affects of other technologies are
0018-9391/$25.00 © 2007 IEEE
YOON AND PARK: DEVELOPMENT OF NEW TECHNOLOGY FORECASTING ALGORITHM
frequently disregarded. Third, as far as process-related issues are concerned, real world feedback is usually too complicated to be accommodated, and TF projects usually resort to assessing likely immediate gains from incremental developments, rather than proposing radical developments for long-term planning. Many cases have also proved unsuccessful because the techniques used were inappropriate to the technology being forecast. Finally, in terms of human-related limitations, an evident limitation is the tendency of forecasters to force soft and pliable facts into preconceived patterns. There continues to be wide disagreement between forecasters, and the choice of experts in qualitative techniques also remains difficult. Traditional morphology analysis (MA) is a qualitative technique requiring expert knowledge and focusing on incremental forecasting in short-term planning, and thus, cannot avoid these limitations. Nevertheless, its potential in the systematic analysis of the current and future structure of the technology domain has been recognized. Many researchers have, therefore, regarded MA as a strong stimulus for the invention of new alternatives. The fundamental idea of MA is to decompose technology into descriptive attributes and levels in order to explain the characteristics of the technology, and then recombine these levels [8]. By exhaustively examining all possible combinations, MA ensures the investigation of all feasible forms of new technology development, and can also reveal unexpected and promising inventions which otherwise might have remained undiscovered. The advantage of the method lies in its speed and ease of application, as the process operation can be implemented and evaluated quickly without the need for excessive data. However, since the process of analysis is exclusively based on expert intuition, MA suffers from various drawbacks, including being nonquantitative, vague and static, and thus, offers no scientific or systematic way of defining attributes and levels [9]. Moreover, lacking a specific process to evaluate new alternatives, MA cannot prioritize technology opportunities, but simply generates them as a list. Finally, MA is normally carried out only for specific short-term planning purposes, and has not yet been applied to long-term forecasting.” The present paper proposes a new hybrid method that enhances the performance of conventional MA by using conjoint analysis (CA) and patent information. CA, a method of determining the ideal or most preferred configuration for a new product or service, is intrinsically similar to MA as both are decomposition methods that break down a system into subsystems with several attributes and decide the most valuable alternative. Generally, the selection of a promising technological design from various alternatives in traditional MA is dependent on the quality of expert opinion. CA can support the process of determining a new technology configuration as its method represents a systematic approach to discovering the combination of attributes that have the highest value. In this paper, patent information such as patent documents and citation information provides a basic data source for MA and CA. Patent documents are analyzed by text mining to extract keywords on the basis of their frequency of occurrence. The morphology of patents is identified by these keywords from a morphology matrix, predefined by domain experts, consisting of various attributes and
589
levels. Combining the valuable levels of each attribute identifies alternatives for new technology development from among the emerging technologies. Patent citation information is employed for presenting configurations of new technology in priority order of patent value. The list of configurations is subsequently analyzed in terms of its technological and strategic aspects, such as “technology share,” a new concept analogous to market share used in traditional CA. A contradiction matrix, which searches for impossible combinations of levels, also evaluates the technological feasibility of new opportunities. Consequently, by using a combination of CA and patent analysis, quantitative, dynamic and systematic features can be added to MA in TF. Specifically, CA can support the process of prioritizing alternatives for new technology development, and thereby, facilitate long-term planning. Therefore, this hybrid method can enhance traditional MA by overcoming the previously noted model and process-related limitations. Furthermore, patent data can play a critical role in defining the morphology of patents and providing CA with analytic information, while circumventing the limitations of lack of data. This systematic process can also overcome human-related limitations by automating the computational process, devising a quantitative index and utilizing reliable public information. This paper is organized as follows. In Section II, the general background of TF methods, MA, CA, and patent citation analysis is presented. Section III describes the research framework for the newly suggested TF process and methodology. Section IV presents a case example to demonstrate the analysis process of the MA–CA hybrid method, and assure its usability in a practical application. Section V concludes with implications and limitations of current research, and considers future research from both managerial and technical perspectives. Managerial issues in terms of implementing this methodology in practice are also discussed. II. BACKGROUND A. TF Methods The two main philosophical approaches to TF are exploratory forecasting and normative forecasting [10], [11]. The exploratory approach projects the present state of technology into the future by treating technological change as being subject to an internal, opportunity-oriented law of development. By contrast, the normative approach focuses on the creation of alternative technological paths to a desired, predefined end state. It is, thus, generally a goal-oriented approach, regarding technological change as responding to outside stimuli such as economic and social demands. The two approaches exemplify the classic divergence between the “push” of opportunities and the “pull” of objectives. Several studies have classified different TF methods into one or other category according to their characteristics [7], [12]. But as some methods can be both exploratory and normative, methods would be better classified as to how useful they are in practical real-world prediction. The typical exploratory forecasting methods are trend extrapolation, environment scanning, bibliometric analysis, and historical analogy. Trend extrapolation, which extends past trends into the future, is the most
590
IEEE TRANSACTIONS ON ENGINEERING MANAGEMENT, VOL. 54, NO. 3, AUGUST 2007
commonly used and easily understood. This method has the advantage that analytic techniques such as smoothing may be applied simply [13]. However, it is often criticized as being based on na¨ıve assumptions and being applicable only to the incremental forecasting of existing technologies. Environmental scanning provides early warning of influential change on the basis that technological change usually follows a standard sequence of steps [14]. The advantage of this method is its ability to predict important future developments without complex process, and to thereby, gain as much lead-time as possible. However, its rules and routines permit it to overlook the emergence of new and disruptive technologies. Bibliometric analysis is a new method with the potential to overcome this limitation. This approach to TF, which involves analyzing a large number of scientific documents, has recently been improved by mapping documents onto a two dimensional space to present their interrelations [15], [16]. By visualizing information from many diverse technology and management areas, bibliometric analysis can forecast both sustaining and disruptive innovations. It also has exceptional strength in being able to extract useful information from unwieldy databases. However, expert and experienced assessment is essential to test the observations and interpret the relationships generated by this approach. Finally, historical analogy works by a systematic comparison of the technology to be forecast with earlier, similar technologies [17]. Forecasting based on analogy is one of the simpler and more common ways to forecast the growth of a new technology. However, the accuracy of this method has been questioned because past industry history often blinds domain experts to potential external developments [18]. When an analogy is drawn due consideration must be given to the numerous dimensions, which can affect technological change [17]. Among normative TF methods, roadmapping and MA have been actively adopted in both practical and academic use.1 Roadmapping can be defined as a visual aid, which crystallizes the links between research programs, development programs, capability targets, and market requirements [19]. This method can help develop consensus among decision makers through its multidisciplinary and cross-functional approach. However, the main weakness of roadmapping is its dependency on the knowledge of the people who create the maps. Without expert input, a roadmap risks being simplistic and incomplete [8]. In addition, in the case of fundamental research, the identification of nodes may be particularly difficult because they will inevitably have to include discoveries not yet made. As already noted, many TF methods, including popular approaches such as Delphi, TRIZ and scenario, have been used for both exploratory and normative forecasting. Although it is very difficult to classify these methods into one of the two categories, they have generally been utilized for normative forecasting in practice [8]. Delphi aims at obtaining the most reliable consensus from a group of experts, and the primary reason for its sustained popularity is its outstanding performance in terms of accuracy and reliability [20]. Moreover, this method is often coupled with 1 The characteristics of morphology analysis, a core method for this paper, are expounded in depth in the next section.
other methods or concepts such as analytic hierarchy processing (AHP) and the Markov chain to further enhance its forecasting accuracy [21], [22]. Although Delphi can explore issues that need judgment objectively in the absence of an empirical database, it requires meticulous survey preparation and a long execution time for the whole cycle [19]. TRIZ is the systematic study of over 2 million of the world’s most successful patents [23]. The overriding advantage of TRIZ is its ability to guide the problem solver toward the most efficient solution for a problem. Nevertheless, this method is subject to limitations that data obtained at earlier steps of the algorithm are not smoothly and fully incorporated into later steps and that extreme levels of knowledge are essential for its successful application [24]. Finally, a scenario is a story that connects a description of a specific future to present realities in a series of casual links that illustrate decisions and consequences [19]. This method can provide an overall picture of the environment rather than the smaller segments of the environment, which each forecast can capture individually. When the situation involves a large number of factors and high degree of uncertainty about the future, the scenario method is superior to other methods such as statistical extrapolation. Moreover, it can stimulate strategic thought and improve the internal flexibility of response to environmental uncertainty. However, drawing up scenarios that are both credible and intelligible is a considerable task, and the validity of the incorporated assumptions can be called into question. Table I shows the strengths and weaknesses of each method. The main weaknesses of these TF methods can be summarized as follows. First, experts must be heavily involved in the analysis process, which increases cost and lengthens forecasting time. Second, most TF methods suffer from poor performance in forecasting emerging technology. Third, few methods have focused on the forecasting of radical change in technological innovation. Finally, although decision makers in technology development expect to be supported by TF methods, the results of forecasting often provide only unreliable numerical results or a massive pile of alternatives for technological opportunity. This paper aims to reduce the routine work required of experts in such situations by introducing a hybrid MA–CA method. This approach also establishes the configurations of new technology for both emerging and mature technologies. In addition, it is applicable to both radical and incremental innovation, and ultimately supports the decision-making process with a prioritysetting approach and a new “technology share” index. B. MA Technological innovation is achieved in the context of an advancing process comparable to biological evolution. The systematic examination of technology development can identify new mutations that offer potential performance improvements [25], [26]. A system can be decomposed into several subsystems, each of which may be shaped in a number of different ways. MA systematically categorizes the possible combinations of subsystems. The strength of this technique lies in its ability to yield structured models for complex problems, rather than offering solutions [27].
YOON AND PARK: DEVELOPMENT OF NEW TECHNOLOGY FORECASTING ALGORITHM
591
TABLE I SUMMARY OF STRENGTHS AND WEAKNESSES OF REPRESENTATIVE TF METHODS
The basic procedure of MA is as follows [9]. First, the fundamental functions of the subject are defined. In this step, the features of the subject are broken down into several attributes. The next step is to list all possible levels in which each attribute can manifest itself. Third, all combinations that can produce unique sets of levels are investigated. The number of combinations can be calculated by multiplying the number of levels associated with each attribute together. The fourth step is to attempt to find practical instances for each combination. The final step is to eliminate the infeasible combinations and list the remaining combinations in order of importance. Since the Swiss astronomer, Zwicky developed the jet and rocket propulsion systems by generating a general form of MA for astrophysical objects [28], the method has contributed conceptually to a broad spectrum of scientific disciplines, such as linguistics, zoology and geology, as well as engineering disciplines [29]. The Swedish defense research agency used MA to evaluate the country’s preparedness for accidents involving hazardous materials [30], and to simplify the modification of computer-aided design models by integrating MA into the design process [31]. A significant characteristic of MA, however, is its inability to operate in a stand-alone fashion: it must either be supported by, or be used as a facilitator in support of the forecasting process of other TF methods. In this context, MA is often applied to TF scenario analysis to assist in choosing profiles for development into scenarios, or in deciding which scenarios should be selected for further investigation [32]. This function has been improved by the development of a computeraided MA package [33]. C. CA CA is the most popular methodology in market research for measuring customers’ tradeoffs among multiattributed products or services [34], [35]. This method assumes that consumers evaluate the total value of a product/service by combining the
individual value of each of its attributes [36]. Thus, CA provides valuable information regarding the set of attributes that represents potential products or services for consumers, and many researchers and practitioners have used it to help identify new product opportunities, identify market segments, and decide on optimal pricing and advertising strategies [37]. In particular, CA permits companies to form “benefit segments,” and also to make decisions about tradeoffs among various features. Furthermore, this allows product designers to develop optimal product configurations to maximize sales and profits for a given competitive setting. A 1989 survey of American firms found approximately 400 commercial applications of CA being conducted annually, and the use of this technique has steadily increased [38]. Approximately 60% of CA studies are related to consumer goods, 20% to industrial goods, and the remaining 20% are performed for transportation or financial services [39]. The academic history of conjoint measurement dates from Luce and Tukey’s seminal paper, which suggested the theoretical grounding for measuring the joint effects of two or more variables simultaneously at the level of interval scales from rank-ordered data alone [40]. This original paper provided fundamental research, which made an important approach to consumer studies. Their analysis has received considerable attention since the early 1970s as a critical technique for estimating consumers’ preferences [41], [42]. Various versions of CA have been developed to improve its accuracy of estimation and ability to cope with large numbers of attributes [43]. Approaches such as the self-explicated approach, adaptive CA and the hierarchical Bayes estimation method have been proposed to minimize the information overload on respondents [44]–[46]. Green and Srinivasan have defined the different steps involved in CA including data collection, stimulus set construction, preference calculation and estimation, and then, identified alternative methods for each step allowing vector, ideal point, part-worth function, and mixed models to be selected as the preferred calculation model [43]. Intriguing recent CA studies
592
IEEE TRANSACTIONS ON ENGINEERING MANAGEMENT, VOL. 54, NO. 3, AUGUST 2007
have investigated optimal product and product line design [47]. The search mechanism of the genetic algorithm that attempts to mimic the biological processes of natural evolution has been coupled with this method in order to provide an optimal product profile [48]. CA has been compared with other new product design techniques such as quality function deployment (QFD) and AHP, and these methods can be considered as complementary rather than competing approaches [49], [50]. However, the use of CA for new idea generation suffers from several limitations when compared with other methods such as Delphi and roadmapping. First, when the subject is described by many attributes, the possible alternatives can be so numerous that respondents cannot realistically evaluate them. Second, real market responses cannot be taken into account because customer preference surveys must be conducted in a virtual situation. Finally, CA has the technical problem that survey reliability may be reduced if respondents feel bored while answering the questions. Nevertheless, CA has been actively employed in various studies due to its many outstanding advantages. First, this method allows for the design of experiments in which a large number of salient attributes can be combined to describe a hypothetical situation facilitating the examination of many different market situations [51]. Second, CA permits the use of a more realistic decision model for a population because it forces respondents to evaluate products according to a full “bundle” of product features. Third, CA allows attributes to be uncorrelated, which avoids the problem of multicollinearity often encountered in observational studies. Finally, this method makes no assumptions about the nature of the relationships between the attributes and the dependent variable, making it straightforward to explore unknown variables as potential predictors of the dependent variable [52]. Consequently, CA provides a simple way of determining the contribution of each attribute to the overall value of a product. D. Patent Citation Analysis Patent information has long been regarded as a useful source for technology management because it includes technical, commercial, and proprietary information of a specific technology. The three basic parts of the patent document (front page, main text, and claims) are analyzed in depth to monitor technological trends, develop new technology, and examine technological feasibility. Among the many patent analysis methodologies, patent citation analysis, which investigates the references included in patent documents, has contributed to the analysis of relationships among technologies [53]. The patent citation count, the number of times that a patent is cited by subsequent patents, indicates the patent’s relative importance [54]. Patent citation analysis is based on the idea that highly cited patents supply basic knowledge to subsequent patents. This methodology can produce technological indexes such as citations per patent, highly cited patents, nonpatent links, technical impact, current impact, and technology cycle times [54]. These indexes have been used as measures of the quality of technical assets [55] and the economic value of innovative outputs [56]. In addition, patent citation information has been actively analyzed in order
TABLE II OVERALL PROCESS FOR IDENTIFYING TECHNOLOGY OPPORTUNITY
to investigate linkages between science and technology [53] and international knowledge flows [57]. III. RESEARCH FRAMEWORK A. New Approach: MA–CA Hybrid Process In this paper, the newly suggested “MA–CA hybrid” method uses various methods such as MA, CA, and text mining to excavate new technology opportunities. As the involvement of many methods may lead to conceptual misunderstandings and imprecise use in practice, it is designed to be executed in six discrete steps, as clarified next. First, patent documents are collected from the databases of international patent organizations such as the United States Patent and Trademark Office (USPTO) and the European Patent Organization (EPO). Second, keywords are extracted from the documents by means of text mining, and each document is transformed into a vector by the frequency of the keywords’ occurrence. Third, the morphology of each patent is identified by matching keywords into the morphology matrix against categories that have been predefined by domain experts. Fourth, unoccupied technology configurations, i.e., those which have not yet been exploited, are derived by observing the morphology of existing patents. Fifth, the technological feasibility of these derived configurations is examined by analyzing contradictions between their technological elements. Finally, CA is used to calculate a “part-worth,” the contribution of an attribute (level) to the total utility, and thus, select the most promising alternative profiles. Subsequently, by considering the results of CA model, the “technology share,” an index indicating the ratio that a specific company occupies of the total technology capability of all companies, can be estimated for hypothetical new technologies. Table II outlines the overall process of this framework. B. Data Preprocessing: Text Mining As patent documents are inherently unstructured textual data, investigating all potentially interesting documents to define their morphology can be very challenging. Patent documents are, therefore, first converted into structured data using keyword vectors, which are extracted by text mining according to their frequency of occurrence and with reference to technology dictionaries. Words that are closely associated with a specific technology and appear frequently in patent documents can be adopted
YOON AND PARK: DEVELOPMENT OF NEW TECHNOLOGY FORECASTING ALGORITHM
593
TABLE III COMPARISON OF TRADITIONAL CA AND PROPOSED CA
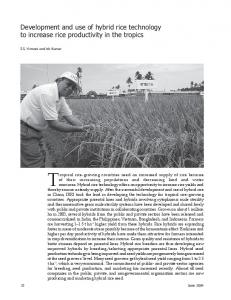
Fig. 1.
Example of keyword vector.
D. Evaluation of Alternatives: CA
Fig. 2.
Example of morphology matrix.
as keywords. The keyword vector is composed of a data field containing the frequency with which each keyword occurs in the patent document. Fig. 1 presents an example of such keyword vectors into which patent documents are transformed. In patent 1 document, the first keyword occurs six times, the second keyword two times, and so on. C. Technology Opportunity Analysis: MA All existing technology configurations can be determined by mapping existing patent keywords into their associated morphology. The morphology matrix of a patent is exemplified in Fig. 2. This matrix consists of four attributes—material, forming process, bonding process, and form—that can be decomposed into two or three levels (see Fig. 2). The keyword vector makes it possible to identify a patent’s morphological shape. Thus, if a patent has more keywords associated with “metal” than with “clay” and “plastic,” the level of the “material” attribute in this patent can be given as “metal.” The levels in the other attributes are also decided in the same way. “Unoccupied” configurations in the morphology matrix can then be listed by excluding the existing morphology from all possible alternatives. This process may have the disadvantage that new combinations of existing attributes cannot cover radical new technology development. As the definition of attributes and levels are critical in identifying new technology configurations, this limitation can be overcome by restructuring the matrix. The original matrix can be extended by adding attributes and levels recognized by keywords of similar or substitute technologies, which will contain previously unconsidered features, and will thus, extend the matrix’s ability to offer useful ideas for innovation. Such morphology matrix modifications obviously demand the experience of experts in the particular technology domain concerned. However, if properly handled, this process can lead to the discovery of previously unidentified potential technology “breakthroughs.”
The technology “vacuum” of unexploited technology opportunities needs prioritizing to facilitate R&D project selection according to budgetary constraints. CA is employed to suggest the configurations of new technology in order of priority and to estimate the technology share in competitive environments. Although CA is mainly used to identify promising new products and forecast market share by analyzing the alternatives according to customers’ preferences [36], it can also be applied in a similar manner to new technology development. First, the value of the patents whose morphology has been analyzed is calculated by evaluating the frequency with which they are cited in other patents. This value demonstrates how often a patent is used as a foundation for other inventions [58], and hence, plays the same role as customer’s preference in measuring the utility of attributes in general CA. Second, the “part-worth” of each attribute and level is calculated by applying techniques such as MONANOVA, LINMAP, and regression. The attribute and level of technology defined in the MA step are then adopted intact, and the importance of each attribute is evaluated using patent value as estimated in the previous step. Third, the most promising configuration of the targeted technology under investigation is determined by combining the most valuable levels in each attribute. In addition, for company level analysis, the share of technology a company retains is provided by comparing it with that of competing companies. The technology share is defined as the ratio of the company’s technology value to the total technology value possessed by all companies, and can be analyzed by summing the “utility” of patents in CA. Table III compares the traditional CA and the CA proposed in this paper.
IV. ILLUSTRATION OF THE MA–CA HYBRID APPROACH A. Data The data source of this research is thin film transistor-liquid crystal display (TFT-LCD) related patents for new generation display devices that utilize the electrooptic effect of using an electric field to alter liquid crystals’ molecular orientation. This technique has been broadly applied to information and visual equipment to produce flat, thin, light panel displays with low power consumption. For intensive analysis, the documents and citation information of 100 patents from 1991 to 2003 related to wide viewing angle (WVA) technology were collected from the USPTO database. Patent documents were preprocessed by text mining and converted to an MA-usable form by being labeled with extracted keywords. Patent citation information
594
IEEE TRANSACTIONS ON ENGINEERING MANAGEMENT, VOL. 54, NO. 3, AUGUST 2007
TABLE IV MORPHOLOGICAL STRUCTURE OF WIDE VIEWING ANGLE TECHNOLOGY
was analyzed in CA in order to estimate the patent value and calculate each level’s part-worth. B. Morphological Structure of TFT-LCD Technology The morphological structure of WVA technology in TFTLCD was constructed with the aid of domain experts, and the attributes and levels of the technology were arranged in the morphology matrix. Each attribute is broken down into several levels. Table IV tabulates the WVA technology morphology structure. This morphological structure articulates the configuration of existing technology. For instance, the feature of multidomain vertical alignment (MVA)—the representative technology of WVA devices—can be described by the combination of vertical alignment of liquid crystal molecules (AV ), backlight as light mode (LB ), multidomain (DM ), no compensation film (CN ), no protrusion surface (PN ), multiple rubbing process (RM ), and voltage charge for two planes (VT ).2 All configurations of 100 patents in this research can be depicted using the same method. However, time and cost issues make it impossible to investigate all patent documents thoroughly. The procedure of identifying the configuration of collected patents must be automated by matching keywords with predefined levels. For example, if a patent contains more keywords related with “parallel” alignment than those related with other levels in “alignment” attribute, that attribute of the patent can be described by the parallel level. A technology dictionary is utilized to support the procedure of mapping keywords into the morphology of technology. C. New Opportunities of TFT-LCD Technology The number of possible configurations is computed by multiplying the number of levels in each attribute, giving 432 distinguishable combinations (i.e., 3 × 2 × 2 × 3 × 3 × 2 × 2). By aggregating the morphology of each of the 100 patents, only 53 configurations were obtained from all possible combinations, indicating that 379 unoccupied configurations remain undeveloped. After a technology vacuum is identified, a project priority list must be suggested for budgeting an R&D project. As aforementioned, CA is employed in order to derive the most promising configuration from all unoccupied combinations. By calculat2 The acronym of the attribute and the level of the patent are presented in the parentheses.
ing the part-worths of levels with patent value, the utility of each level can be assessed. Combining levels with the highest utility can excavate the appropriate configuration of promising undeveloped technologies. 1) Calculation of the Value of Existing Configuration: The value of the 53 occupied configurations is measured on the basis of citation frequency. If several patents exhibit the same configuration, the average value of these patents is assigned to that configuration. However, with regard to calculating the value of patents, the critical problem of truncation must be considered. The number of citations received by each patent can be truncated because current information is inevitably limited to citations received so far [59]. It is not obvious whether a patent that was granted in 1990 and received ten citations by 2003 should be measured as more highly cited than a patent granted in 2000, which received five citations by 2003. To combat this problem, the citation-lag distribution of each technology class is estimated, and is used to adjust the total citation of each patent. Previous research has shown that a patent in the electronic technology class truncated at five years after the initial application and having received ten citations up to that point, will have gained approximately 27% of the “lifetime” citation total for an average electronic patent [59]. The total number of citations can be approximated as 37, by dividing the observed citation frequency by 0.27 (i.e., 10/0.27). Thus, the value of all patents can be adjusted by estimating the total lifetime citation based on the citation-lag distribution. 2) Estimation of Part-Worths: After adjusting the value of the patents, the part-worth of each level is calculated by analyzing the value of all 53 configurations. The part-worth is estimated with ordinary least squares (OLS) regression using SAS computer software. Utilities of individual levels are estimated from patent values, and the “utility index” can display the most valuable combination of levels. The “importance index” measures how much a particular attribute contributes to the patent value. This index is calculated by subtracting the utility of the least valuable level for an attribute from that of the most valuable level of the same attribute. Table V illustrates the utility of each level and the importance of each attribute in the WVA technology case. The levels where the utility is highest in each attribute can be extracted: vertical alignment, backlight mode, single-domain, no compensation film, stripe protrusion surface, multiple rubbing processing, and voltage charge in plane. The important attributes are determined by examining the range of utilities across all levels of each attribute, because the range represents the maximum impact that the attribute can contribute to the value of a technology. Here, the protrusion surface form, which has the highest importance value, is the most important attribute. 3) Excavation of Promising Technology: The overall utility of a configuration is the sum of the utility of each level selected in each attribute. In this case, the configuration that contains the highest utility can be easily identified in Table I as AV -LB -DS -CN -PS -RM -VI . However, a patent (U.S. Patent 5 969 782) retaining this configuration was already granted in 1999. Table VI lists the next most valuable alternatives, based on the patent value derived by analyzing the adjusted citation
YOON AND PARK: DEVELOPMENT OF NEW TECHNOLOGY FORECASTING ALGORITHM
TABLE V UTILITY OF LEVELS AND IMPORTANCE OF ATTRIBUTES
595
TABLE VI LIST OF HIGHLY VALUABLE ALTERNATIVES
TABLE VII EXAMPLE OF CONTRADICTION MATRIX
frequency. As citation frequency reflects technological value, the unexploited technology combination with the most promising future value can be selected. This allows new technology opportunities for R&D projects to be identified and prioritized. In general, high “utility” value levels of the attributes that have a high “importance” value are included in all promising configurations. As Table VI shows, all the highly valuable configurations contain the levels AV , CN , and PS , which belong to the “important” attributes, respectively. By comparison, the relatively lower importance value attributes (light mode, domain, rubbing, and voltage charge) have differing levels. 4) Investigation of Technological Feasibility: A morphological field may contain many mutually inconsistent or contradictory pairs of conditions, and such alternative combinations will clearly be technologically impossible to develop. In the case of cameras, for instance, an analogue camera would not be equipped with a memory card nor would a digital camera require film. Therefore, configurations with “analogue/memory card” or “digital/film” pairs must be removed from the set of alternatives. This process requires domain experts to establish a contradiction matrix to investigate all morphological field level “pairs,” and exclude inconsistent or impossible configurations from the list of alternatives to be considered. Table VII presents an example of the contradiction matrix in the case of WVA patents.3 In Table VII, a contradiction relationship of levels is indicated by the symbol “X.” This relationship can be obviously identified by investigating such technological feasibility that tilted alignment (AT ) is incompatible with reflective light mode (LR ) because it is impossible for a tilted alignment structure to reflect a light. Therefore, in Table VI, the third and the fourth configuration must be removed because the RS –VI and RM –VT pairs are contradictory. This process can save effort and time in the 3 All attributes and levels are represented by their acronyms, and when a pair of levels in the same attribute does not need to be investigated, they are highlighted.
analysis of technology opportunities by dramatically reducing the number of alternatives to be considered. 5) Simulation of Technology Share: When the competitiveness of a company is evaluated, the analysis of its technological capability is a critical factor. This paper advances the concept of “technology share” to estimate the proportion of the overall value of a particular technology area occupied by a specific company. To exemplify the procedure for calculating technology share, the most recent five WVA technology patents of companies A and B are collected.4 The technology share of the two companies is measured by summing the utility value of the patents they hold, as shown in Table VIII. The total utility of recent patents that company A possesses is greater than that of company B. Assuming that they are the only two companies in this technology space, their technology shares are 64.7% and 35.3%, respectively. However, if company B develops the two highly valuable technologies presented in Table VII, the sum of its technology utility will increase to 76.78, improving its technology share to 52.9%. In this way, the technology share of companies that compete in a specific market can be simulated.
4 Companies
“A” and “B” are real companies in an electronic industry.
596
IEEE TRANSACTIONS ON ENGINEERING MANAGEMENT, VOL. 54, NO. 3, AUGUST 2007
TABLE VIII EXAMPLE OF TECHNOLOGY SHARE
TABLE IX LIST OF FREQUENT CONFIGURATIONS
TABLE X CHANGE OF LEVELS IN A HOLD-OUT SAMPLE
TABLE XI UTILITY OF LEVELS IN A HOLD-OUT SAMPLE
D. Validation The applicability of the suggested methodology needs to be validated by means of a “hold out” sample. Using the same WVA technology data, we first divide it into two data sets according to time period: 1994–1998 and 1999–2003. After promising technologies are excavated by the first data set, we examine whether they have been exploited in the second period data set. In addition, since a chronological change in technological configuration can enhance the understanding for technological change, the core level changes in each attribute are observed. Analyzing a hold out sample can identify changes in the morphology of specific technologies. By identifying the configurations of patents from their documents, 21 configurations are extracted from the 30 patents in the first data set, and 47 configurations from the 63 patents in the second data set. In terms of the most frequent configurations, six patents in the first data set have the same configuration (AV -LB -DS -CN -PS -RS -VI ). However, in the second data set, the frequency of this configuration reduces, while those of the AV -LB -DS -CT -PS -RS -VI , and AT LB -DS -CN -PS -RS -VI configurations increase, and thus, all three configurations have three patents (see Table VIII). Table X compares the most highly used levels of each attribute in the two data sets. Although, both have the same most highly used level in each attribute, the change of proportions of the levels is apparent. In the second data set, “parallel” alignment is less utilized, while “tilted” alignment is used more frequently up to 11%. Similarly, in the case of compensation film, the use of “one” (18%) and “two” (7%) compensation films is conspicuously increased in the second data set. These results can help researchers analyze the historical change of technology configuration, and forecast the direction of technological evolution.
The usefulness of this approach can be underpinned by dynamic analysis of the change in frequently occurring configurations and levels. As an additional analysis, Table XI shows the utility of the first data set levels calculated in the same way as was used in Table V to analyze each level’s utility in all 100 data. First, the citation frequency of 30 patents in the first data set is reexamined to infer the total lifetime citations and the value of each configuration. The utility of each level is measured on the basis of this value, and then, promising configurations for new technology development are extracted. The invention of these technologies is then observed by searching the second data set for patents that take the extracted configurations. Table XII presents the list of promising configurations that are derived from the first data set. Of these configurations, the first and the fifth were invented during the second data period.5 This shows valuable but undeveloped configurations in one period being realized in the next. The applicability of the suggested approach to the task of forecast promising technology can, thus, be validated. 5 In 1999, A -L -D -C -P -R -V ; U.S. Patent 5 969 782 and in 2003, V B S N S M I AP -LB -DS -CN -PS -RM -VI ; U.S. Patent 6 621 476, respectively.
YOON AND PARK: DEVELOPMENT OF NEW TECHNOLOGY FORECASTING ALGORITHM
TABLE XII LIST OF HIGHLY VALUABLE ALTERNATIVES FOR VALIDATION
V. CONCLUSION A. Implications and Limitations This paper proposes the MA–CA hybrid approach for the screening and evaluation of a number of alternatives to help identify new technology development opportunities. The proposed method can reveal promising new technology territory by analyzing patent information such as patent documents and patent citation. The core advantage of this approach is the systematic TF process, and the analysis of quantitative patent data. Furthermore, a concrete morphology of possible alternatives and a priority for launching R&D activity are presented. The simulation of technology share, a new index in this approach, can compare the technological capability of companies in a specific industry. This approach may be considered as a similar methodology to TRIZ in terms of utilizing the patent database related with technology management. However, while the main objective of TRIZ is problem solving, the proposed method is primarily focused on excavating promising new technology developments. The idea and process of MA are straightforward to understand and apply. TRIZ also suffers from the limitation that existing principles and laws can restrict the flow of creative ideas. By comparison, MA has the strength that a morphology matrix can be defined flexibly, allowing optimal configurations to be derived in a systemic and quantitative way. As this research is only at the explorative study stage, the new method it proposes for tackling the intractable issue of forecasting is subject to several limitations. First, defining a procedure for the construction of patent morphology clearly, is challenging. Second, although the proposed approach can provide a profile of promising technology, it does not yet evaluate the market feasibility. Third, this method does not incorporate managerial and technical judgment. Therefore, expert opinion in clarification of patents can significantly improve the accuracy and reliability of forecasting. Fourth, this MA–CA hybrid method cannot consider any emerging technology in a different area that may disrupt the business to which TF is applied. Thus, the competitive environment cannot be fully reflected when the priority of alternatives is assessed. A further complication here is the time lag inherent in the 2- to 3-year patent examination process. While a new technology configuration can be identified using this approach, it may have already been developed in the interim. However, this paper is confined to developing a supporting tool for identifying the opportunity of new technology development. The overriding purpose of MA is to provide a list of alternatives ranked according to their future value. Managers
597
or technicians must take into account the time lag issue while deciding which technology should be developed. Finally, this hybrid approach may tend to be biased toward existing profiles, since it uses existing technologies and their patent citation information in the CA procedure. With regard to these limitations, future research may include the following themes. First, a systematic approach needs to be suggested to define the morphology matrix of the technology to be investigated. For instance, analytic tools, such as the technology tree and the patent map, could be useful in matrix construction, as they are able to portray the characteristics of a technology. Second, specific technology dictionaries must be developed to match keywords extracted by text mining with the relevant technology morphology. Third, a way needs to be found of including commercial feasibility in the analysis of new technology opportunities. Finally, the role of the domain expert in applying the proposed method needs clear detailed definition. B. Managerial Issues This paper explores a new TF algorithm utilizing MA, CA, and patent information. In general, newly suggested methods need to be carefully deployed in “real-world” situations, as the theoretical methodology has not yet been proved in practice. Moreover, as this MA–CA hybrid method integrates different independent methods, there may be many managerial issues in its practical implementation. First, when applying this method, it is important to understand that the objective of a TF tool is not to produce an optimal solution separately per se, but rather to enhance the process of idea generation. Many users of expert systems believe that they can present totally reliable final solutions on which they can base their decisions. But no TF method can stand alone; the involvement of experts in relevant domains remains essential for certain elements, such as defining morphological structures and contradiction matrices. The second issue concerns identifying the type of technology in which this method can best operate. The TF method must be selected with consideration for both the technology characteristics and the forecasting objective. Since MA is the core element of this MA–CA hybrid approach, it is most appropriate for technologies where a morphology matrix can be defined clearly. Where levels and attributes in the morphology matrix of a certain technology can be identified as being both mutually exclusive and collectively exhaustive, TF reliability will be dramatically improved. In addition, the proposed MA–CA hybrid method is suitable for analyzing technology areas where companies apply their inventions for patent rights competitively. Intellectual policy varies according to industry characteristics. Most chemical industry companies, for instance, tend to fear that technical information will be disclosed by patenting, as new technology in this industry is related to process innovation at large. Generally, this method will show better results in industries where companies actively apply for patent protection in order to deter competitors from introducing technologically similar inventions. Similarly, it is expected that the proposed method would work well in industries where many substitutes
598
IEEE TRANSACTIONS ON ENGINEERING MANAGEMENT, VOL. 54, NO. 3, AUGUST 2007
have the potential to compete with the existing products or technologies, and strong competition exists between existing rivals. The richness of technological information from substitutive and similar technologies helps advance the MA execution because it can extend the morphology matrix. Consideration of such sectoral differences is necessary when selecting suitable technology areas. The third issue is associated with the selection of a database. The suggested approach is based on patent documents and patent citation information. Therefore, abundant information in terms of the number of patents considered and the citation relations among the patents is required for successful analysis. Since the USPTO and EPO patent databases include a myriad of applied patents and citation relations, considerable amount of analysis are already available from the existing valuation and forecast studies. The USPTO patent database has been the principal data source used in the development of the proposed MA–CA hybrid method because it attracts inventors and innovators from all over the world. While many USPTO citations come directly from inventors and are only subsequently filtered by patent examiners, EPO patent examiners try to minimize the number of citations in drafting their reports [60]. Therefore, USPTO citation information more accurately reflects real citation relations, making it more suitable for this method. Its database also has the added strength that the technical performance of text-mining tools is better in English than in any other language [61]. The fourth, practical issue is the order of the analysis process. As indicated, the method is designed to be executed in a sequential process, but the process order can be modified to include feedback chains between sequential steps. In particular, the predefined morphology matrix can be supplemented with the results of the contradictory matrix analysis. The identification of contradictory pairs allows already-defined morphology matrix levels to be added to or deleted in the light of expert opinion. In fact, it may be possible, and even advisable in some circumstances, to implement process elements in parallel rather than in sequence. For instance, the morphology matrix could be defined simultaneously with the patent value calculation procedure. Such a parallel process would reduce the total time taken, and could stimulate active feedback among the analytic steps. The fifth issue concerns surrounding environmental effects. This paper has tried to deal with the issue of technological competition by coming up with the concept of technology share. However, the technological environment can be influenced by various exogenous factors such as government policy, international regulations, and so on. In addition, all inventions have to be investigated to determine whether they infringe on existing patent claims before they can acquire appropriability. From an economic point of view, a lack of financial sources can also be a critical constraint on technological investment. Therefore, the macroeconomic situation must also be evaluated before R&D projects to develop promising technology can realistically be launched. In order to find potential alternatives and follow through to the development process, all factors in the technological and economic environment must be considered in detail.
The final issue is the use of outputs that are derived by the proposed method. Since this MA–CA hybrid approach can facilitate the evaluation of technological opportunity, it is useful in prioritizing R&D projects. This method also has an advantage in elucidating a specific technology’s overall situation, including the configurations of existing patents and competitive relations among companies. This can lead to the successful implementation of technological strategies, allowing various methods of acquiring relevant technology (such as licensing, in-house R&D, and so on) to be explored, and company competitiveness to be improved. Such strategic selection can be supported by analyzing potential partners’ technological profiles and the technology share that can be generated by theproposed method. REFERENCES [1] D. Zhu and A. L. Porter, “Automated extraction and visualization of information for technological intelligence and forecasting,” Technol. Forecast. Soc. Change, vol. 69, pp. 495–506, 2002. [2] D. Barker and J. H. D. Smith, “Technology foresight using roadmaps,” Long Range Plann., vol. 28, no. 2, pp. 21–28, 1995. [3] R. Ayers, Technological Forecasting and Long-Range Planning. New York: McGraw-Hill, 1969. [4] J. P. Martino, “Technology forecasting—An overview,” Manage. Sci., vol. 26, no. 1, pp. 28–33, 1980. [5] V. Coates, M. Farooque, R. Klavans, K. Lapid, H. A. Linstone, C. Pistorius, and A. L. Porter, “On the future of technological forecasting,” Technol. Forecast. Soc. Change, vol. 67, pp. 1–17, 2001. [6] D. L. Mann, “Better technology forecasting using systemic innovation methods,” Technol. Forecast. Soc. Change, vol. 70, pp. 779–795, 2003. [7] S. Mishra, S. G. Deshmukh, and P. Vrat, “Matching of technological forecasting technique to a technology,” Technol. Forecast. Soc. Change, vol. 69, pp. 1–27, 2002. [8] J. C. Glenn and T. J. Gordon, Futures Research Methodology. Washington, DC: American Council for UNU, 2003. [9] J. G. Wissema, “Morphological analysis: Its application to a company TF investigation,” Futures, vol. 8, no. 2, pp. 146–153, 1976. [10] M. Bengisu and R. Nekhili, “Forecasting emerging technologies with the aid of science and technology databases,” Technol. Forecast. Soc. Change, vol. 73, no. 7, pp. 835–844, Sep. 2006. [11] B. Twiss, Forecasting for Technical Decision. London: Peregrinus, 1992. [12] Technology Futures Analysis Methods Working Group, “Technology futures analysis: Toward integration of the field and new methods,” Technol. Forecast. Soc. Change, vol. 71, pp. 287–303, 2004. [13] H. Eto, “The suitability of technology forecasting/foresight methods for decision systems and strategy: A Japanese view,” Technol. Forecast. Soc. Change, vol. 70, pp. 231–249, 2003. [14] J. P. Martino, “A review of selected recent advances in technological forecasting,” Technol. Forecast. Soc. Change, vol. 70, pp. 719–733, 2003. [15] R. N. Kostoff, “The handbook of research impact assessment,” 7th ed. Off. Naval Res. Arlington, VA, DTIC Rep. ADA 296021, 1997. [16] H. Small, “Update on science mapping: Creating large document space,” Scientometrics, vol. 28, no. 2, pp. 275–293, 1997. [17] J. P. Martino, Technological Forecasting for Decision Making. New York: Elsevier, 1983. [18] S. Schnaars, Megamistakes: Forecasting and the Myth of Rapid Technological Change. New York: Free Press, 1989. [19] R. N. Kostoff and R. R. Schaller, “Science and technology roadmaps,” IEEE Trans. Eng. Manag., vol. 48, no. 2, pp. 132–143, May 2001. [20] F. Woundenberg, “An evaluation of Delphi,” Technol. Forecast. Soc. Change, vol. 40, pp. 131–150, 1991. [21] Y. C. Yun, G. H. Jeong, and S. H. Kim, “A Delphi technology forecasting approach using a semi-Markov concept,” Technol. Forecast. Soc. Change, vol. 40, pp. 273–287, 1991. [22] C. N. Madu, C. H. Kuei, and A. N. Madu, “Setting priorities for IT industry in Taiwan—A Delphi study,” Long Range Plann., vol. 24, pp. 105–118, 1991. [23] D. L. Mann, “Better technology forecasting using systemic innovation methods,” Technol. Forecast. Soc. Change, vol. 70, pp. 779–795, 2003. [24] V. Sushkov, “Technosocial competition,” TRIZ J., pp. 1–14, Feb. 1997.
YOON AND PARK: DEVELOPMENT OF NEW TECHNOLOGY FORECASTING ALGORITHM
[25] H. Majer, “Technology measurement: The functional approach,” Technol. Forecast. Soc. Change, vol. 27, pp. 335–351, 2007. [26] J. H. Leinhard, “Some ideas about growth and quality in technology,” Technol. Forecast. Soc. Change, vol. 27, pp. 265–282, 1985. [27] M. Pidd, Tools for Thinking—Modeling in Management Science. London: Wiley, 1996. [28] F. Zwicky, Discovery, Invention, Research—Through the Morphological Approach. Toronto, ON: Macmillan, 1969. [29] D. Cuesta-Frau, M. Aboy, J. McNames, and B. Goldstein, “Morphology analysis of intracranial pressure using pattern matching techniques,” in Proc. 25th Annu. Int. Conf. IEEE EMBS, Cancun, Mexico, Sep. 2003, vol. 3, pp. 17–21. [30] T. Ritchey, Using morphological analysis to evaluate preparedness for accidents involving hazardous materials. Presented at 4th Int. Conf. Local Authorities, 2002, [Online]. Available: www.swemorph.com/pdf/ chem2.pdf. [31] M. Belaziz, A. Bouras, and J. M. Brun, “Morphological analysis for product design,” Comput.-Aided Des., vol. 32, pp. 377–388, 2000. [32] R. Rhyne, “Field anomaly relaxation: The arts of usage,” Futures, vol. 27, no. 6, pp. 657–675, 1995. [33] T. Eriksson, “Scenario development using computer aided morphological analysis,” [Online]. Available: www.swemorph.com/pdf/cornwallis3. pdf. [34] P. E. Green, A. M. Krieger, and Y. L. Wind, “Thirty years of conjoint analysis: Reflections and prospects,” Interfaces, vol. 31, no. 3, pp. S56–S73, 2001. [35] V. Srinivasan and A. D. Shocker, “Estimating the weights for multiple attributes in a composite criterion using pair-wise judgments,” Psychometirika, vol. 38, pp. 479–493, 1973. [36] J. F. Hair, Jr., R. E. Anderson, R. L. Tatham, and W. C. Black, Multivariate Data Analysis, 5th ed. Upper Saddle River, NJ: Prentice-Hall, 1998. [37] P. E. Green and A. M. Krieger, “An application of a product positioning model to pharmaceutical products,” Marketing Sci., vol. 11, pp. 117–132, 1992. [38] D. R. Wittink, R. Dick, and P. Cattin, “Commercial use of conjoint analysis: An update,” J. Marketing, vol. 53, pp. 91–96, 1989. [39] P. Cattin and D. R. Wittink, “Commercial use of conjoint analysis: A survey,” J. Marketing, vol. 46, no. 3, pp. 44–53, 1982. [40] R. D. Luce and J. Tukey, “Conjoint analysis: A new form of fundamental measurement,” J. Math. Psychol., vol. 1, pp. 1–36, 1964. [41] P. E. Green and V. R. Rao, “Conjoint measurement for quantifying judgmental data,” J. Marketing Res., vol. 8, pp. 355–363, 1971. [42] R. M. Johnson, “Trade-off analysis of consumer values,” J. Marketing Res., vol. 11, pp. 121–127, 1974. [43] P. E. Green and V. Srinivasan, “Conjoint analysis in marketing: New developments with implications for research and practice,” J. Marketing, vol. 54, pp. 3–19, 1990. [44] P. E. Green, S. M. Goldberg, and M. Montemayor, “A hybrid utility estimation model for conjoint analysis,” J. Marketing, vol. 45, pp. 33–41, 1981. [45] R. M. Johnson, “Adaptive conjoint analysis,” in Proc. Sawtooth Softw. Conf. Percept. Mapp., Conjoint Anal. Comput. Interviewing, 1987, pp. 253–265. [46] P. J. Lenk, W. S. DeSarbo, P. E. Green, and M. R. Young, “Hierarchical Bayes conjoint analysis: Recovery of part-worth heterogeneity from reduced experimental designs,” Marketing Sci., vol. 15, no. 2, pp. 173–191, 1996. [47] P. E. Green, J. D. Carroll, and S. M. Goldberg, “A general approach to product design optimization via conjoint analysis,” J. Marketing, vol. 45, pp. 17–37, 1981. [48] P. V. Balakrishnan and V. S. Jacob, “Genetic algorithms for product design,” Manage. Sci., vol. 42, no. 8, pp. 1105–1117, 1996. [49] M. E. Pullman, W. L. Moore, and D. G. Wardell, “A comparison of quality function deployment and conjoint analysis in new product design,” J. Prod. Innov. Manage., vol. 19, no. 5, pp. 354–364, Sep. 2002.
599
[50] A. Scholl, L. Manthey, R. Helm, and M. Steiner, “Solving multi attribute design problems with analytic hierarchy process and conjoint analysis: An empirical comparison,” Eur. J. Oper. Res., vol. 164, no. 3, pp. 760–777, 2005. [51] W. Haider and G. Ewing, “A model of tourist choices of hypothetical Caribbean destinations,” Leisure Sci., vol. 12, no. 1, pp. 33–47, 1990. [52] A. Bajaj, “Technology factors influencing senior information systems managers’ decisions to adopt new computing architectures”, Heinz School, Carnegie Mellon Univ., Pittsburgh, PA, 1998. [53] M. Mayer, “Does science push technology? Patents citing scientific literature,” Res. Policy, vol. 29, pp. 409–434, 2002. [54] B. Yoon and Y. Park, “A text-mining-based patent network: Analytic tool for high-technology trend,” J. High Technol. Manage. Res., vol. 15, pp. 37–50, 2004. [55] M. Hirschey and V. Richardson, “Valuation effects of patent quality: A comparison for Japanese and US firms,” Pacific-Basin Finance J., vol. 9, pp. 65–82, 2001. [56] B. Holl, A. Jaffe, and M. Trajtenberg, Market Value and Patent Citations: A First Look. Cambridge, MA: NBER, 2000. [57] A. Jaffe and M. Trajtenberg, “International knowledge flows: Evidence from patent citations,” Econ. Innov. New Technol., vol. 8, pp. 105–136, 1999. [58] M. Karki, “Patent citation analysis: A policy analysis tool,” World Patent Inf., vol. 19, no. 4, pp. 269–272, 1997. [59] A. B. Jaffe and M. Trajtenberg, Patents, Citations, and Innovations. Cambridge, MA: MIT Press, 2002. [60] J. Michel and B. Bettels, “Patent citation analysis: A closer look at the basic input data from patent search reports,” Scientometrics, vol. 51, pp. 185–201, 2001. [61] V. Keselj, F. Peng, N. Cercone, and C. Thomas, “N-gram-based author profiles for authorship attribution,” in Proc. Conf. Pacific Assoc. Comput. Linguistics, Nova Scotia, Canada, Aug. 2003, pp. 255–264.
Byungun Yoon received the B.S., M.S., and Ph.D. degrees in technology forecasting from Seoul National University, Seoul, Korea, in 1994, 2000, and 2005, respectively. Currently, he is an Assistant Professor of Industrial and Systems Engineering, Dongguk University, Seoul, Korea. Earlier, he was a Visiting Scholar in the Centre for Technology Management (CTM), University of Cambridge, Cambridge, U.K., a Senior Researcher at Kangnung National University, Kangnung, Korea, and a Senior Consultant with LG, Korea. His research interests include patent analysis, new technology development methodology, and visualization algorithms, enhancing technology road mapping, and product designing with data mining techniques. He has authored many articles published in several journals.
Yongtae Park received the M.S. and Ph.D. degrees in operations management from the University of Wisconsin, Madison, in 1987 and 1991, respectively. He is currently a Professor of industrial engineering at Seoul National University, Seoul, Korea, where he also served as the Director of Graduate Program of Technology Management. His research interests include knowledge network analysis, knowledge management system, and new service creation. He has authored many articles published in several journals.