other custom software is available for measuring speed of visual processing and ... CASR Road Safety Research Report | Development of peripheral vision tests ...
Development of peripheral vision tests for driver assessment NR Burns, SM Kremer, MRJ Baldock
CASR REPORT SERIES CASR019 November 2005
Report documentation REPORT NO.
DATE
PAGES
ISBN
ISSN
CASR019
November 2005
41
1 920947 18 3
1449-2237
TITLE Development of peripheral vision tests for driver assessment
AUTHORS NR Burns, SM Kremer, MRJ Baldock
PERFORMING ORGANISATIONS Department of Psychology The University of Adelaide South Australia 5005 AUSTRALIA
Centre for Automotive Safety Research The University of Adelaide South Australia 5005 AUSTRALIA
SPONSORED BY Department for Transport, Energy and Infrastructure Post Office Box 1 Walkerville, SA, 5081 AUSTRALIA
AVAILABLE FROM Centre for Automotive Safety Research http://casr.adelaide.edu.au/reports
ABSTRACT In the interests of identifying older drivers at higher risk of crashing, with a view to restricting their driving, fitness to drive tests require development and validation. One particular test that makes claim for inclusion in any battery of fitness to drive tests is the Useful Field of View test (UFOV)1. UFOV subtests appear to depend heavily on speed of visual processing, and on indexing crowding in peripheral vision. However, UFOV is a proprietary instrument and other custom software is available for measuring speed of visual processing and crowding in peripheral vision. Sixty participants aged over 60 completed UFOV. They also completed inspection time (IT), a measure of speed of visual processing, and crowding across the visual field (CAVF), a measure indexing effects of strength of crowding in peripheral vision. Thus, the current study compared performance on UFOV, inspection time (IT) and crowding across the visual field (CAVF). The main outcomes here were that the IT and CAVF measures had high test-retest reliability over a period of about one week and did not exhibit statistically significant practice effects. By way of contrast, although UFOV measures were also highly reliable, two of three UFOV measures, Divided Attention and Selective Attention, showed practice effects; the third measure, Processing Speed, showed severe range restriction in the current sample of healthy older adults. Correlations between CAVF, IT and UFOV Selective Attention were very high. These outcomes suggests that IT and CAVF together may well prove appropriate and useful as part of an assessment of fitness to drive. This suggestion needs to be validated by research investigating whether these tests predict crash risk in the same way that UFOV does.
KEYWORDS Visual field, Fitness to drive, Aged driver © The University of Adelaide 2005 The views expressed in this report are those of the authors and do not necessarily represent those of the University of Adelaide or the sponsoring organisation
1
UFOVis a registered trademark of Visual Awareness, Inc., Chicago, IL
Summary The rationale for the current study has the following elements. Older drivers are overrepresented in at-fault crashes. These crashes display a unique profile that is consistent with the involvement of deficits in performance at perceptual, motor, and higher cognitive levels, with particular emphasis on speed of information processing deficits. Therefore, in the interests of identifying older drivers at higher risk of crashing, with a view to restricting their driving, fitness to drive tests require development and validation. One particular test that makes claim for inclusion in any battery of fitness to drive tests is the Useful Field of View test (UFOV)2. UFOV subtests appear to depend heavily on speed of visual processing, this is particularly so for scores on the recently developed PC version of UFOV used here, and on indexing crowding in peripheral vision. However, UFOV is a proprietary instrument and the literature on UFOV does not directly address the processes involved in UFOV performance. Researchers at the Department of Psychology, University of Adelaide have studied extensively speed of visual processing and crowding in peripheral vision. Custom software is available to measure performance in these domains. A sample of 60 participants, 33 males (mean age 67.3, SD = 6.5 years) and 27 females (mean age 62.4, SD = 3.9 years), completed UFOV. They also completed inspection time (IT), a measure of speed of visual processing, and crowding across the visual field (CAVF), a measure indexing effects of strength of crowding in peripheral vision. All of these measures were completed twice, once at each of two sessions held about one week apart. Visual acuity and contrast sensitivity were also measured. Thus, the current study compared performance on UFOV, inspection time (IT) and crowding across the visual field (CAVF). The expectation was that IT would share substantial variance with all UFOV subtests but particularly with Subtest 1, Processing Speed. It was also expected that CAVF would share variance with Subtest 3, Selective Attention to the extent of the reliability of both measures. The main outcomes here were that the IT and CAVF measures had high test-retest reliability over a period of about one week and did not exhibit statistically significant practice effects. By way of contrast, although UFOV measures were also highly reliable, two of three UFOV measures, Divided Attention and Selective Attention, showed practice effects; the third measure, Processing Speed, showed severe range restriction in the current sample of healthy older adults. Correlations between CAVF, IT and UFOV Selective Attention were very high, especially when corrected for unreliability of these measures. These outcomes suggests that IT and CAVF together may well prove appropriate and useful as part of an assessment of fitness to drive. This suggestion needs to be validated by a research program that investigates whether these tests predict crash risk in the same way that UFOV does.
2
UFOVis a registered trademark of Visual Awareness, Inc., Chicago, IL
CASR Road Safety Research Report | Development of peripheral vision tests for driver assessment
iii
Contents 1
2
3
iv
Introduction............................................................................................................................. 1 1.1
Older drivers are over-represented in at-fault crashes .............................................. 1
1.2
Unique crash profile of older drivers ........................................................................... 2
1.3
Peripheral vision and the useful field of view.............................................................. 2
1.4
The Useful Field of View (UFOV) task........................................................................... 3 1.4.1 The UFOV and risk of crashing ....................................................................... 4 1.4.2 UFOV as a fitness to drive test........................................................................ 5 1.4.3 The UFOV as a measure of cognitive decline................................................. 6 1.4.4 The UFOV and cognitive abilities tests ........................................................... 6 1.4.5 Decrements in performance on UFOV – what does UFOV measure?......................................................................................................... 7
1.5
UFOV, inspection time and crowding across the visual field ...................................... 7 1.5.1 Speed of visual processing............................................................................. 8 1.5.2 Inspection time................................................................................................ 8 1.5.3 Crowding across the visual field .................................................................. 10 1.5.4 The crowding across the visual field task .................................................... 15
1.6
A study on UFOV, IT and CAVF ................................................................................... 16
Method .................................................................................................................................. 17 2.1
Participants ................................................................................................................ 17
2.2
Apparatus and material.............................................................................................. 17 2.2.1 Vision testing................................................................................................. 17 2.2.2 Useful Field of View (UFOV) .......................................................................... 17 2.2.3 Inspection time (IT) ....................................................................................... 18 2.2.4 Crowding Across the Visual Field (CAVF)..................................................... 18
2.3
Procedure................................................................................................................... 19
Results................................................................................................................................... 20 3.1
UFOV, IT and CAVF measures .................................................................................... 20
3.2
Descriptive statistics.................................................................................................. 21
3.3
Correlations of UFOV with IT and CAVF ..................................................................... 21
3.4
Correlations of UFOV with IT and CAVF: the role of visual acuity and chronological age....................................................................................................... 22
3.5
UFOV risk category..................................................................................................... 23
3.6
Distribution of UFOV measures .................................................................................. 23
3.7
Comparison of performance across session 1 and session 2 ................................... 24
CASR Road Safety Research Report | Development of peripheral vision tests for driver assessment
4
Discussion............................................................................................................................. 25 4.1
Comment on CAVF...................................................................................................... 25
4.2
Comment on IT............................................................................................................ 26
4.3
Comment on UFOV...................................................................................................... 26
4.4
UFOV subtest 1 (processing speed) and subtest 2 (divided attention)...................... 26
4.5
UFOV selective attention, IT and CAVF ...................................................................... 26
4.6
Chronological age and visual acuity .......................................................................... 27
4.7
Practice effects .......................................................................................................... 27
4.8
Conclusion and comment........................................................................................... 27
Acknowledgements ...................................................................................................................... 29 References .................................................................................................................................... 30
CASR Road Safety Research Report | Development of peripheral vision tests for driver assessment
v
Index of Tables Table 1.1 Comparison of crowding and pattern masking (source: Pelli et al., 2004).................... 13 Table 3.1 Descriptive statistics and test-retest correlations for useful field of view (UFOV), inspection time (IT) and crowding across the visual field (CAVF), N = 60 .............. 21 Table 3.2 Correlations for UFOV, IT and CAVF variables from session 1, N= 60........................... 21 Table 3.3 Comparison of performance across session 1 and session 2 for all measures............................................................................................................................... 24
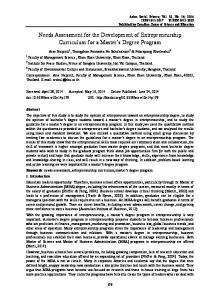
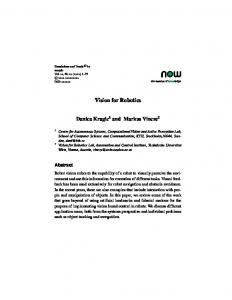
Index of Figures Figure 1.1 Warning cue (left), two alternative IT target figures (centre), and lightning mask (right) for the inspection time (IT) task .......................................................................... 9 Figure 1.2 Labelled screen shot of the interface used for crowding across the visual field (CAVF) showing target and flanking stimuli and the eight possible targets................. 15 Figure 3.1 Proportion of trials correct at each target location for unflanked and flanked conditions. L = left of central fixation, R = right of central fixation, Pe = peripheral location, Pa = parafoveal location, U = unflanked, C = flanked. CU = central unflanked condition, CC = central flanked condition. Error bars are standard error of mean ......................................................................................................... 20 Figure 3.2 Scatterplot showing relationship between UFOV processing speed and inspection time (IT)................................................................................................................ 24
vi
CASR Road Safety Research Report | Development of peripheral vision tests for driver assessment
1
Introduction The elevated crash risk for older drivers may reflect a small increase in risk for all older drivers, or a large increase in risk for a few (or some combination). It seems likely that there is a large increase in risk for a small subset of older drivers. Assuming that this is so, it would be beneficial to be able to determine which older drivers were at an elevated risk. Some reviews on the literature on elderly drivers and fitness to drive argue that a test battery to establish fitness to drive should include a test of peripheral vision. No such test is currently included in most jurisdictions. There are a number of tests that could conceivably be used to determine which older drivers are at the greatest risk. One such test that is currently the focus of much research attention is the commercially available Useful Field of View test (UFOV). It has been claimed that performance on UFOV is the best single predictor of crash risk for elderly drivers. What follows is a review of research on UFOV. This is then followed by a discussion on two of the subtests from UFOV, Subtest 1 Processing Speed and Subtest 3 Selective Attention, in the context of two well-studied phenomena of visual perception ‘inspection time’ (IT), a pattern backward masking task which measures speed of visual processing; and ‘crowding,’ whereby an easily recognised target in peripheral vision is rendered unrecognisable by the presence of flanking stimuli. Next, a study is reported in which performance on UFOV is examined for relationships with IT and a measure of decrement in visual performance due to crowding, strength of crowding. The aim was to explore relationships of UFOV to these well-studied phenomena with a long-term view to developing fitness to drive tests incorporating software packages developed in the Psychology Department, University of Adelaide.
1.1
Older drivers are over-represented in at-fault crashes It is well documented that older drivers are over-represented in at-fault road crashes (Holland, 2001; Wylie, 1996). When distance travelled is taken into account then older people contribute to a disproportionate number of both pedestrian and driver crashes and to cited traffic violations (Bilban & Zlender, 1998; Evans, 1991; Hakamies-Blomqvist, 1993; Tasca, 1998). This trend needs to be carefully considered in the context of an ageing population, more widespread licensure in older adults, and the increasing probability of older drivers surviving crashes (Payne & Hahn, 1992). Current licensing legislation in Australia already addresses some of these issues. In South Australia, all drivers are required to take a vision test and obtain a medical certificate yearly beyond the age of 70 years (AUSTROADS, 1998). All states but Victoria mandate that by the age of 75 years, a vision test must be taken in order to retain a current drivers licence. Notwithstanding, it is important to note that the majority of older drivers are crash-free. As the legislation reflects, to restrict an individual’s driving rights based only on chronological age is inappropriate and discriminatory (Ball and Owsley, 2003; Goode et al., 1998). Moreover, the ability to drive a motor vehicle is a central aspect of independent living for many seniors. Driving an automobile affords numerous opportunities for enhanced social networking and improved quality of life, particularly in suburban communities (McPherson, Michael, Ostrow, & Shafron, 1988). Without the licence to drive, seniors may no longer be able to hold gainful employment, participate actively in community volunteer activities, manage a household, engage in various recreational pursuits, or establish and maintain social and interpersonal relationships (Klavora & Heslegrave, 2002). Therefore, the only appropriate means of restricting licences is on the basis of deficits in abilities known to increase the risk of crashing, such as poor visual acuity. To date, research has focused on crash risks associated with older drivers and the analysis of older drivers’ crash-involvement patterns (Evans, 1991; Hakamies-Blomqvist, 1993, 1994; Lundberg, Hakamies-Blomqvist, Almkvist, & Johansson, 1998). Evaluation of skills and
CASR Road Safety Research Report | Development of peripheral vision tests for driver assessment
1
abilities needed for safe driving is important because older adults often have characteristics that may increase their crash risk. Therefore, a major area of crash research is aimed at characterising sensory, cognitive, and motor capabilities that might be good predictors of driving ability and crash risk.
1.2
Unique crash profile of older drivers Older drivers have been identified as having a unique profile of road crashes. They are more likely to be involved in crashes and traffic citations involving failure to heed signs, yield right of way, or turn safely (Keskinen, Ota, & Katila, 1998; Morgan & King, 1995; Tasca, 1992). In Australia, as in Europe and America, crash patterns reveal an over-representation of older drivers involved in crashes at intersections (Hakamies-Blomqvist, 2003; Rotter and McKnight, 2002; Insurance Institute for Highway Safety, 2001). Research into the relationship between age and driving has found that older drivers are less able to detect a change in the direction of travel of other vehicles (Sekuler & Ball, 1986), make poorer estimation of the speed of other vehicles (Scialfa, Guzy, Leibowitz, Garvey, & Tyrrell, 1991; Hills and Johnson, cited in Hills, 1980), and are less sensitive to detecting movement in other vehicles (Tran, Silverman, Zimmerman, & Feldon, 1998), particularly when the movement is angular (Henderson and Burg, 1974), or the speed of movement changes. Older drivers have a higher percentage of crashes attributable to perceptual errors (Storie, 1977). Finnish road-crash data, for example, indicate that attention errors involving perception were the most important causal factor behind fatal crashes involving older drivers. A large percentage of these drivers were not aware of the potential risks before the crash (Hakamies-Blomqvist, 1994). These crash patterns suggest that older drivers have problems with complex perceptual and cognitive functions involved in driving.
1.3
Peripheral vision and the useful field of view During the process of normal ageing there is substantial neural loss and a gradual decline in dynamic vision, including peripheral vision (Tran et al., 1998; Willis & Anderson, 2000; Wist, Schrauf, & Ehrenstein, 2000). Wojciechowski, Trick, and Steinman (1995) found substantial age-related deterioration in motion sensitivity in the peripheral visual fields and Panek, Barrett, and Sterns (1977) reported a decrease in the extent of the total visual field from 170 deg in young adults to 140 deg by the age of 50 years. This reduction in extent of peripheral vision is important because people with poor peripheral vision are believed to have twice the crash rate of those with normal peripheral vision (Morgan & King, 1995); additionally, poor peripheral vision is associated with problematic driver performance (Wood & Troutbeck, 1995). Ball, Beard, Roenker and Miller (1988) examined peripheral vision changes as a function of age. They examined peripheral vision in the context of a so-called useful field of view which they defined as the visual area from which information can be acquired within one fixation of the eye. They examined the effects of age on performance on a peripheral localisation task in 24 young (aged 22-23 years), middle-aged (aged 40-49 years), or older (aged 60-75 years) adults. Their findings indicated that regression models which best captured the effects of eccentricity, centre task demand, and practice on peripheral localisation performance were different for the different age groups. For example, age was only a statistically significant predictor of performance in the models for the middle-aged and older groups; similarly, effect of distractors was only statistically significant for the older group. Nonetheless, all three regression models successfully predicted the extent of the useful field of vision when distractors were placed within the visual field. Ball et al.’s (1988) findings also provided confirmation of research reported only a year earlier. Scialfa, Kline and Lyman (1987) used a visual search task to study target detection in older adults. They presented people with unflanked targets, targets flanked on each side by one noise element (non-target letter), or targets embedded in a horizontal row of 19 noise elements. An Age x Noise Level x Eccentricity interaction showed that differences between
2
CASR Road Safety Research Report | Development of peripheral vision tests for driver assessment
young and older participants were largest for peripheral targets presented in noise. In fact, analyses of response latency data showed that the performance of older adults on the lownoise condition was most similar to that of younger adults in the high-noise condition. In both this study and that of Ball et al., the researchers concluded that the differences in peripheral function were due to the fact that older adults take smaller perceptual samples from the visual scene and scan these samples more slowly than do younger adults. Burton (1997) confirmed that older individuals need more time to scan the visual scene and therefore need longer to perceive targets presented in peripheral vision. Participants searched for a target presented among different numbers of distractor items. When participants were given as much time as they needed to find the target, search times were independent of the number of distractor items and search time increased with distance from the fixation point, for all ages. However, older participants’ searches required more time at all target eccentricities. In another experiment, search accuracy was assessed when the targets were only presented at brief exposure durations. Localization errors were greater and increased with target eccentricity to a greater extent for the older adults, suggesting that they did not have enough time to process and encode the location of the target. Results from this study imply that the processes underlying visual search in older adults are functioning at a slower rate; this slowing may affect performance on complex and timecritical tasks. When older adults are forced to search for targets in a time-limited task, they make more errors and these errors tend to increase with eccentricity to a greater extent than for young adults. This outcome is consistent with the notion of a restricted useful field of view in older adults. Thus, the size of an individual’s useful field of view can be manipulated by varying stimulus duration and both stimulus duration and stimulus eccentricity interact with age in a predictable way. Other research suggests that as cognitive load is increased the functional range of peripheral vision (i.e., the extent of peripheral vision from which information is processed) becomes restricted (Ikeda & Takeuchi, 1975). In three separate experiments on a total of 77 participants, Williams (1989) found that the useful field of view is very sensitive to foveal load. As a primary task in foveal vision became more difficult, the extraction of information in peripheral vision worsened. Moreover, performance became increasingly poor as the eccentricity of the peripheral image increased. Critically, the functional extent of peripheral vision under complex, real-world conditions, such as detecting stimuli in cluttered backgrounds, is not equivalent to the maximum extent of peripheral vision that can be measured with clinical peripheral vision tests (Owsley, Ball & Keeton, 1995). Standard clinical peripheral vision tests measure the useful field of view under the most basic conditions. The observer simply localises a peripheral stimulus presented on a uniform field. Task difficulty is increased by embedding the peripheral target within distractors, or by limiting the observer’s exposure to the targets; these manipulations can decrease the useful field of view considerably (Ikeda & Takeuchi, 1975; Sekuler & Ball, 1986; Williams, 1982). However, standard clinical measures are only weakly correlated with vehicle crashes (see Henderson & Burg, 1974; Hills & Burg, 1977; Shinar, 1977) and so a great deal of effort has been directed to developing new techniques for evaluating age-related deterioration of peripheral vision. One of these tests is the focus of this report and is discussed next.
1.4
The Useful Field of View (UFOV) task Following their initial study in 1988 and in light of other research such as that described above, Karlene Ball and her colleagues developed a new test of peripheral vision that incorporated complex visual task demands: the Useful Field of View task (UFOV). The UFOV measures the extent of the visual field within which targets can capture attention during a brief period (Goode et al., 1998). The three subtests of UFOV measure an individual’s speed of processing under increasingly complex visual task demands. To date, the majority of research on UFOV has been conducted using the so-called standard version of the UFOV. However, UFOV has evolved from the standard version to a briefer version which can be administered on a personal desktop computer (PC version, see Edwards, Vance et al., 2005)
CASR Road Safety Research Report | Development of peripheral vision tests for driver assessment
3
using either a touch screen or mouse response option. The subtests of the standard version of UFOV are as follows (fuller descriptions of the PC version of UFOV are provided later, see 2.2.2, below):3
Processing Speed In the Processing Speed subtest, threshold exposure duration for central vision is measured by requiring observers to identify stimuli (either a car or a truck) that are briefly presented in the centre of a computer display.
Divided Attention The Divided Attention subtest requires the observer to identify the stimulus in central vision and the location of a peripheral stimulus which appears randomly at either 10, 20, or 30 degrees eccentricity along one of eight radial spokes, after they are simultaneously presented.
Selective Attention The Selective Attention subtest is identical with the Divided Attention subtest, except the peripheral stimuli are embedded within distractors (small triangles). The duration of the displays for all subtests is varied between 17 ms and 250 ms. A 75% correct threshold (in ms) is derived by a double staircase method. These threshold scores are then translated into a scaled score between 1 and 30 (reflecting the percentage reduction in a maximum 35 degree radius field). These subtest scores are added together to create an overall UFOV score. Higher composite UFOV scores indicate greater impairment, with a score of 90 indicating that the individual cannot identify central or peripheral targets regardless of the amount of clutter in the display and even given the longest stimulus duration. Composite scores of 40 or more represent a substantial functional deficit.
1.4.1
The UFOV and risk of crashing Much of the research on UFOV has been concerned with confirming that decreases in the useful field of view (operationalised as increased UFOV composite score) are especially pronounced in older observers (Sekuler & Ball, 1986) and, unlike standard peripheral vision and visual acuity tests, are predictive of automobile crashes (Ball, Owsley, Sloane, Roenker, & Bruni, 1993; Owsley et al., 1998). Ball et al. (1993) conducted a large study on older drivers. They assessed 294 people aged 60 to 90 years on a set of commonly used neuropsychological and other cognitive tests, including widely used measures of mental status - the Mattis Organic Mental Syndrome Screening Examination (MOMSSE); attention - Trail Making Test (Part A and Part B); and visual memory - Wechsler Memory Scale-Visual Reproduction Subtest (WMS-VR), and the Rey-Osterrieth Complex Figure Test (Rey-O Copy and Rey-O Immediate). Crash data covering the previous three years were obtained from the Alabama Department of Public Safety. They found that only two variables, UFOV and mental status, were associated with a history of crashes (see also Ball & Rebok, 1994). Since then, Ball and her colleagues have examined the predictive validity of the UFOV by examining correlations with a variety of driving ability measures and by comparing UFOV with other variables that may predict highrisk of crashing. In a follow-up study, Owsley, McGwin and Ball (1998) examined crash data covering the five years after the initial assessment (i.e., 1993-1998). Among the visual processing variables
3
UFOV is Copyright© Visual Awareness, Inc. 1991, 1996 and 2002. We are therefore limited to providing descriptions of UFOV subtests to the extent that they have been described in the public domain, that is, in peerreviewed literature.
4
CASR Road Safety Research Report | Development of peripheral vision tests for driver assessment
identified as potentially important determinants of crash risk, higher UFOV score was the only one associated with crash history. Older drivers with a UFOV score of 40 or higher (i.e., a 40 percent or greater reduction in the useful field of view, as defined above) were 2.1 times more likely to have incurred a crash during the follow-up period compared with those with a UFOV score less than 40. Note that 56.9 percent of the sample had a UFOV score of 40 or higher. A statistically significant linear trend was observed between crash risk and UFOV score when this was entered in the model as a continuous variable. For every 10 points increase in UFOV score, older drivers had a 16 percent increase in crash risk. A subset of the data collected in 1993 was also used in order to identify the best set of predictor variables for at-fault crashes over the previous five years (Goode et al., 1998). Logistic regression was used to model the data. The first model was designed to evaluate the predictive ability of the traditional neuropsychological and cognitive tests (see above) and was statistically significant, χ2(6, N = 239) = 20.02, p