Proc. EUROSIM 2007 (B. Zupančič, R. Karba, S. Blažič)
9-13 Sept. 2007, Ljubljana, Slovenia
DEVELOPMENT OF SIMULATION-BASED ENVIRONMENT FOR MULTI-ECHELON CYCLIC PLANNING AND OPTIMISATION Galina Merkuryeva and Liana Napalkova Department of Modelling and Simulation Riga Technical University 1 Kalku Street LV-1658, Riga, Latvia
[email protected] (Liana Napalkova) Abstract This paper focuses on the development of simulation-based environment for multi-echelon cyclic planning and optimisation in the product maturity phase. It is based on integration of analytical and simulation techniques. Analytical techniques are used to obtain initial planning decisions under conditions of stochastic demand and lead time, whereas simulation techniques extend these conditions to backlogging and capacity constraints. Simulation is used to analyse and improve cyclical decisions received from the analytical model. The proposed environment includes four components, such as database, process, optimisation and procedural one. Database component defines a supply chain network and its input parameters. Procedural component generates cyclic schedules using analytical calculus. Process component performs automatic generation of a supply chain simulation model and simulates cyclic schedules in multi-echelon environment while controlling inventory levels and estimating the performance measures. Optimisation component defines optimal cyclic schedule for each of the supply chain stages in order to minimize the sum of inventory holding, setup and ordering costs while satisfying customer service requirements defined by a target customer service level. The paper provides examples of different network type simulation models generated for multi-echelon cyclic planning and optimisation. The present research is funded by the ECLIPS Specific Targeted Research Project of the European Commission "Extended Collaborative Integrated Life Cycle Supply Chain Planning System". Keywords: Multi-echelon cyclic planning, supply chain simulation, automatic programming. Presenting Author’s biography Liana Napalkova holds an MSc degree in Computer Science from Riga Technical University (2006). Currently, she is a PhD student and a research assistant at the Department of Modelling and Simulation, Riga Technical University.
ISBN 978-3-901608-32-2
1
Copyright © 2007 EUROSIM / SLOSIM
Proc. EUROSIM 2007 (B. Zupančič, R. Karba, S. Blažič)
1
stock points are controlled by periodic review policy (POR), and reorder intervals (or replenishment cycles) are defined according to the integer-ratio policy. Order-up-to levels are fixed in the planning period. Safety stocks are used to protect against stock-outs due to demand and lead times variation. Initial stocks are considered to be equal to order-up-to levels. Processing lead times are assumed to be normally distributed. Capacity constraints are introduced to limit the transformation activities specified by processes. Total costs are defined by a sum of fixed setup costs, linear inventory holding costs and ordering costs.
Introduction
For years, researchers and practitioners have primarily investigated the various processes within manufacturing supply chains individually. This approach is also called a single echelon approach, where a stage or facility in the supply chain is managed as such. For example, in [1] Campbell and Mabert deal with the planning of production on a single machine. Recently, however, there has been increasing attention placed on the performance, design, and analysis of the supply chain as a whole. Almost every product is produced in a chain of successive processes (either in different companies or different departments within the same company). A multi-echelon environment considers multiple processes and multiple stock points. Supply chain management is not just managing every echelon in isolation; it is really about the challenge to manage all the echelons in a holistic way. The multi-echelon approach can give an answer to the always increasing pressure on improving performance and a more holistic view of the supply chain.
The following notations are introduced: I: number of stock points in supply chain network, J: number of processes in supply chain network, K: number of end-customers, T: number of periods in the planning horizon, Predi: the set of indices of stock points immediately preceding the stock point i, Succi: the set of indices of stock points immediately following the stock point i, IsContStocki: 1 – if stock decreases continuously; 0 – otherwise, dk,i: average demand of end-customer k for stock point i, dk,i: standard deviation of demand of end-customer k for stock point i, dm,i: average demand received in stock point i for stock point m, dm,i: standard deviation of demand received in stock point i for stock point m, Dk,i,t: demand of end-customer k for stock point i at time period t (generated from normal distribution), Lj: average lead time of process j, Lj: standard deviation of lead time of process j, DDLCyk,i: average demand of end-customer k to stock point i during lead time and replenishment cycle, DDLCyk,i: standard deviation of demand of endcustomer k to stock point i during lead time and replenishment cycle, Cyi: replenishment cycle of stock point i, Si: order-up-to level of stock point i, SSi: safety stock of stock point i, Hi,t: on hand stock at the end of period t at stock point i, Qi,t: replenishment order of stock point i per period t, QSi,m,t: quantity of products provided by stock point i to stock point m at time period t, QCi,k,t: quantity of products provided by stock point i to end-customer k at time period t, QPj,t: production quantity of process j at time period t, BPj,t: 1 – if process j is switched on at time period t; 0 – if process j is switched off at time period t, CAPj: maximal capacity of process j, CSLi: customer service level of stock point i, Csi: setup cost at stock point i, Chi: unit inventory holding cost at stock point i, Coi: unit ordering cost at stock point i.
In comparison to complex policies, which are preferable from theoretical point of view, cyclic planning in multi-echelon environment has more practical benefits, because it provides easy control and reduced administrative costs. The main idea of cyclic planning is to use cyclic schedules at each echelon and synchronize them with one another [2]. This paper is divided into 8 sections. Section 2 describes the problem. A conceptual view on the supply chain model is provided in Section 3. Section 4 represents a simulation-based environment for simulating and optimising multi-echelon cyclic schedules. This environment is used to perform experiments in Sections 5 and 6. Section 7 concludes the paper and suggests further investigations.
2
The Problem Description
2.1 Assumptions and notations Consider an acyclic directed graph representing the production and distribution system. It is formed by two different types of nodes, such as stock points and processes [3]. The stock points correspond to any place to store the output products of the process. The processes denote transformation activities with a set of input products and a set of output products, such as assembly, transportation and packaging operations [4]. The performed research is based on the following assumptions about the system’s structure and the type of control policies. End-customers’ demand is normally distributed and occurs at a stationary, continuous rate. The stock points directly connected to end-customers must provide product output in order to satisfy the demand. Shortages are backlogged and only full deliveries to customers are allowed. The
ISBN 978-3-901608-32-2
9-13 Sept. 2007, Ljubljana, Slovenia
2
Copyright © 2007 EUROSIM / SLOSIM
Proc. EUROSIM 2007 (B. Zupančič, R. Karba, S. Blažič) 2.2 The MILP problem formulation
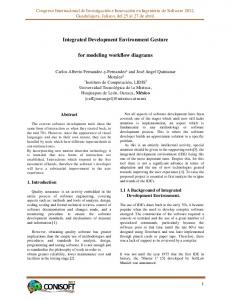
9-13 Sept. 2007, Ljubljana, Slovenia At the higher abstraction level, the supply chain is constructed by basic sub-networks, such as linear, convergent and divergent (see Figure 1).
The objective is to minimize the sum of inventory holding, setup and ordering costs while satisfying customer service requirements defined by a target customer service level.
1
2
3
The mixed integer linear programming (MILP) formulation of the problem is as follows:
Minimize
Co Q Ch Ch Cs BP i
- stock point
t
i ,t
IsContStock i 1
i
t T
i
H i,t t
i
IsContStock i 1 j
j
Replenishment and delivery logic [5] built in subnetworks is described below. 3.1 The linear sub-network
j ,t
t
i, t H i , (t 1)
QS
m pred i
m , i , ( t L j ,t )
In the linear sub-network (1), a stage has one predecessor and one successor (except the last echelon). Replenishment order is placed to the immediately preceding stage. If the on hand stock is insufficient to fulfil this order, then the backorder is created. Orders and backorders are delivered to the immediately succeeding stage.
H i ,t
QC
(2)
j , t QPj , t BPj , t CAPj
(3)
QS
msucci
i , m, t
i,k ,t
k succi
k , t Dk , i ,t
QC
i, k ,t
3.2 The convergent sub-network In the convergent sub-network (2), a stage has one successor and many predecessors. Replenishment procedure is changed so that order is placed to the number of immediately preceding stages. If at least one of them has insufficient on hand stock, then the backorder is created, and the transformation operation associated to the process is delayed. Delivery procedure is similar to the linear sub-network.
(4)
k succi
i, t H i ,t 0
(5)
i, Cyi *
(6)
j , t BPj , t 0,1
(7)
3.3 The divergent sub-network In the divergent sub-network (3), a stage has many successors and one predecessor. Replenishment procedure corresponds to the linear sub-network. Delivery procedure is changed so that orders are delivered to succeeding stages sequentially according to their ID numbers. In other words, the demand of a stage with the smallest ID number is fulfilled first.
The first and fourth terms of the objective function (1) represent ordering and setup costs, respectively; the second term is used to calculate inventory holding costs at the stock point immediately preceding the end-customers, and the third one calculates holding costs at other stock points; (2) describes inventory balance constraints; (3) represents production capacity constraints, (4) ensures that the end-customer demand is equal to the sum of product quantities provided by stock points immediately preceding the end-customer, (5) ensures that on hand stocks will be nonnegative, (6) states that replenishment cycles must be chosen from a set of integer numbers, (7) states that processing indicator must be equal to 0 or 1.
3
- stage
Fig. 1 Basic sub-networks of the supply chain
( H i ,t H i , t 1 ) / 2 (1)
subject to:
- process
4
4.1 Architecture Simulation-based environment to define optimal cyclic schedules for multi-echelon environment is introduced in [2] taking into account stochastic nature of the supply chain system and nonlinear relationships between its nodes (see Figure 2).
The supply chain model
The environment for cyclic planning and optimisation includes these four components:
The supply chain is represented by atomic elements, such as stock points and processes defined in Section 2. Stock points are graphically represented by triangles, and processes by rectangles. The pair of a process and stock point connected with directed arc is called a stage.
ISBN 978-3-901608-32-2
Simulation-based environment
3
Database component, Procedural component, Process component, Optimisation component.
Copyright © 2007 EUROSIM / SLOSIM
Proc. EUROSIM 2007 (B. Zupančič, R. Karba, S. Blažič)
9-13 Sept. 2007, Ljubljana, Slovenia
Fig. 2 Architecture of simulation-based environment 4.2 Database component
"Network_matrix" w orksheet
Database component consists [2] of a network and dataset subcomponents. The network subcomponent describes a structure of the supply chain. The dataset subcomponent includes basic data about inventory control policies, costs, capacities and end-customer demand.
"Endc ustomer_ demand" w orksheet
Database component is built in the Excel format; it includes the following six worksheets (Figure 3):
"Costs_data" worksheet
Database component "Stoc kpoint_data" w orksheet
1) ‘Network_matrix’ worksheet defines a supply chain structure by its matrix representation. Rows and columns correspond to stock points, but cells to connecting them process numbers.
"Proces s_data" w orksheet
Fig. 3 Structure of database component
2) ‘Network_data’ worksheet is automatically generated from ‘Network_matrix’ and is used to efficiently read matrix data from VBA code.
4.3 Procedural component Procedural component is built to generate cyclic schedules using analytical calculus [2].
3) ‘Stockpoint_data’ worksheet defines graphical positions of stock points in the model layout, initial inventory levels, replenishment cycles, order-up-to levels and safety stocks, which are obtained from the procedural component.
An analytical model assumes that end-customer demand is normally distributed, lead times are constant, process capacities are infinite and backlogging is not allowed.
4) ‘Process_data’ worksheet contains graphical positions of processes in the model layout, as well as average processing lead time and its standard deviation, and capacity constraints. 5) ‘Costs_data’ worksheet specifies holding, setup and ordering costs.
The following formulas are used to estimate replenishment control parameters that refer to the stock points immediately preceding end-customers:
2
inventory
Cyi
6) ‘Endcustomer_demand’ worksheet determines average end-customers demand per period and its standard deviation.
ISBN 978-3-901608-32-2
"Network_data" w orksheet
ksucci
d k ,i
ksucci
Csi Chi (8) d k ,i
DDLCy k , i d k ,i (Cyi L ji )
4
(9)
Copyright © 2007 EUROSIM / SLOSIM
Proc. EUROSIM 2007 (B. Zupančič, R. Karba, S. Blažič)
DDLCy k ,i d k ,i (Cyi L ji ) SSi NORMSINV (CSLi )
k succi
Si
ksucci
DDLCy k ,i
SSi
entities, locations of stock points and processes, path networks used to establish links between stock and process points; creating arrays, variables, functions and procedures; definition of entities arrival schedule, sequence of processes and their operational logic.
(10)
2 DDLCy k ,i
(11)
4.4.2
(12)
If a stock point is not immediately connected to endcustomer(-s), then the following updates are made to formulas (9) and (10) [6]: (13)
DDLCy m ,i d k ,i (Cyi L j )
(14)
The logic of simulation model
The general algorithm of a single stage in the model is represented in Figure 5. It is similar for all stages in supply chain. The only difference is that in stages not directly connected to end-customers the demand event is substituted by orders from succeeding stages.
In formulas (8) and (11), aggregate demand is introduced. It allows multiple end-customers to be connected to the same stock point.
DDLCy m, i d k ,i (Cyi L j )
9-13 Sept. 2007, Ljubljana, Slovenia
When several events occur at a stage at the same period, they are processed in the following sequence: receiving orders and backorders from preceding stages; fulfilling open backorders from succeeding stages; fulfilling of orders from succeeding stages; and then sending replenishment orders to preceding stages.
ji
4.5 Optimisation component
ji
Optimisation component aims [2] to define an optimal cyclic schedule for each of the supply chain stages during a maturity phase of the product life cycle in order to minimize the sum of inventory holding, setup and ordering costs while satisfying customer service requirements defined by a target customer service level.
In this case, replenishment orders from the current stage are used as the demand in immediately preceding stages. 4.4 Process component Process component performs [2] two different tasks: 1) automatic generation of a supply chain simulation model, and 2) simulation runs, i.e. simulation of cyclic schedules in multi-echelon environment while controlling inventory levels and estimating the performance measures.
A metaheuristic algorithm is used to search for optimal solutions. Initial solutions are received from procedural component. Further, solutions are obtained from simulation runs. The metaheuristic algorithm improves current solutions and sends them back to the simulation model until the optimal solution is found. A feasible set of replenishment cycles is constrained by integer-ratio policy.
4.4.1 Automatic generation of a supply chain simulation model Automatic generation of a supply chain simulation model is supported by ProModel’s ActiveX Automation capability that allows one to automatically generate simulation models from external applications by using VBA programming language [7].
5
Examples
This section illustrates testing of the simulation models automatically generated and some results of analyzing assumptions impact on optimisation results. 5.1 Test environment 3-echelon supply chain is simulated. Input dataset stored in database component is shown in Table 1. Tab. 1 Input dataset Stages
1
2
3
4
Inventory holding cost, CU
0.09
0.02
0.06
Setup cost, CU
400
300
200
Ordering cost, CU
5.00
9.15
3.15
Average lead time, periods
2
2
1
90
90
90
Inputs
Fig. 4 ActiveX-based VBA program Here, the ActiveX-based VBA program developed in MS Excel (see Figure 4) consists of the subroutines that provide an ProModel operational control: it allows accessing the model information, e.g. loading a blank simulation model; defining a title of the model, path to a graphical library, animation speed, simulation length and number of replications; creating
ISBN 978-3-901608-32-2
Customer service level, % Average demand per period, units Standard deviation of demand per period, units
5
2500 500
Copyright © 2007 EUROSIM / SLOSIM
Proc. EUROSIM 2007 (B. Zupančič, R. Karba, S. Blažič)
+
Are order arrivals s cheduled in this period?
End-c ustomer dem and generation
Start
9-13 Sept. 2007, Ljubljana, Slovenia
W ait incoming orders
-
+
Are there unfulfilled backorders
+
Is on hand s tock sufficient to fulfill open backorders?
-
Fulfill bac korders
-
+
Is on hand stock s ufficient to fulfill the demand?
Reorder dec is ion?
Fulfill the demand
Save new bac korders
+ -
Calc ulate inventory pos ition
Send replenishment order
Calc ulate s etup & ordering c os ts
Calc ulate inventory holding c osts
End
Fig. 5 General algorithm of a single stage in multi-echelon supply chain model (4) sent orders, (5) received orders, (6) on order quantity and (7) inventory position.
Initial values of control variables (see Table 2) are estimated in the procedural component from analytical formulas (8) – (15). The number of periods in the planning horizon is 34. Tab. 2 Initial values of control variables Stages Variables Replenishment cycle, periods Order-up-to level), units
1
2
3
4
2
4
2
19195
19195
8610
5.2 Model 1 The first simulation model has been automatically generated in the process component executing the ActiveX-based VBA program (see Figure 6) for the following assumptions:
Fig. 6 Automatic generation of supply chain simulation model 5.3 Model 2 The second simulation model has been generated for these assumptions:
Demand is normally distributed, Lead times are constant, Backlogging is not allowed, Capacities are infinite.
In order to verify the generated simulation model, a special chart-based template has been used (Figure 7). Template table includes the following columns: (1) demand, (2) on-hand inventory, (3) total backorders,
ISBN 978-3-901608-32-2
Demand is normally distributed, Lead times are normally distributed, Backlogging is not allowed, Capacities are infinite.
Normal distributions of lead times are given in Table 3.
6
Copyright © 2007 EUROSIM / SLOSIM
Proc. EUROSIM 2007 (B. Zupančič, R. Karba, S. Blažič)
9-13 Sept. 2007, Ljubljana, Slovenia poor solutions fade away and good solutions continually evolve in their search for the optimum. The following optimisation procedure is applied. At the first step, the objective function is defined that it minimizes total costs and does not allows stock-outs (see Figure 8). In order to ensure that the objective function does not unintentionally favour any particular statistic, these values are weighted. For example, in the first model the maximum value of total costs at the initial simulation run is equal to 1511199, but the maximum number of stock-outs is equal to 0. In order to balance both statistics, a weight of 1511100 has been applied to the number of stock-outs.
Fig. 7 Example of simulation model tracing Tab. 3 Lead time average values and standard deviations Stages Variables Average lead time, periods Standard deviation of lead time, periods
1
2
3
4
2
2
1
1
1
0.2
5.4 Model 3 The following assumptions are taken into accounts in the third simulation model:
Demand is normally distributed, Lead times are normally distributed, Backlogging is allowed, Capacities are infinite. Backlogging in full is allowed.
Fig. 8 Objective function definition At the second step, a search space is defined (Figure 9). Lower and upper bounds of control variables are estimated in the procedural component (Table 6), which correspond to 90 % and to 97 % of CSL level. Replenishment cycles are varied between 1 and 12 time periods.
5.5 Model 4 The fourth simulation model is based on these assumptions:
Demand is normally distributed, Lead times are normally distributed, Backlogging is allowed, Capacities are finite.
Maximal capacities of processes are shown in Table 4. Tab. 4 Capacity constraints Stages
1
2
3
4
10000
20000
8000
Variable Maximal capacity, units
Fig. 9 Lower and upper bounds of order-up-to levels
5.6 Optimisation using SimRunner
At the third step, the required number of replications is estimated. In our case, a single replication for all four models is suggested.
As optimisation component, ProModel SimRunner [8] is used that applies an Evolutionary Algorithm. It manipulates a population of solutions in the way that
ISBN 978-3-901608-32-2
7
Copyright © 2007 EUROSIM / SLOSIM
Proc. EUROSIM 2007 (B. Zupančič, R. Karba, S. Blažič)
9-13 Sept. 2007, Ljubljana, Slovenia after 602 experiments. As a result, the following values of objective function statistics have been found: maximum total costs are 1373454 and number of stock-outs is 0.
At the last step, the optimisation search is conducted. Optimisation profile is set to Moderate. In this case the average population size of possible ones is analysed. Convergence percentage, which controls how close are the best and the average is set to 0.01.
6
The results
The optimal solution sets related to four simulation models are summarised in Table 5. In Model 1 an analytical solution ensures that orders are fulfilled during the planning horizon. SimRunner improves the initial solution so that total costs are decreased by 9.13 %. In Model 2, an analytical solution results in lost sales due to the variability of lead times, while simulation-based optimal solution cut costs up by 9.80 %, and stock-outs don’t occur during the planning horizon. In Model 3, an initial solution leads to lost sales in the last echelon while shortages in deliveries are backlogged. In optimal solution, total costs are decreased by 13.08 %. Finally, in Model 4 replenishment orders are limited by capacity constraints. It leads to additional lost sales while implementing an analytical solution. SimRunner improves the initial solution so that total costs are reduced by 6.85 % and orders are fulfilled during the planning horizon.
Fig. 10 Optimisation experiments Results of optimisation experiments for Model 1 are shown in Figure 10. The search has been completed
Tab. 5 Comparison between impacts of different assumptions on the optimisation results
7
The SimRunner solution Replenishment cycles
Order-up-to levels
Model 1
{7, 6, 1}
{19557, 19302, 8610}
1511200
1373454
Number of stock-outs (before optimisation) 0
Model 2 Model 3 Model 4
{1, 7, 2}
{19839, 19571, 8974} {19195, 19366, 8887} {19195, 19293, 8658}
1471258
1327010
1
0
1513846
1315833
1
0
1499090
1396465
1
0
Model
{5, 7, 2} {5, 4, 2}
Total costs (before optimisation)
Total costs (after optimisation)
Conclusions
8
The paper represents the developed simulation-based environment for multi-echelon cyclic planning and optimisation. The impact of different assumptions, such as normally distributed lead times, backlogging and finite capacities, on the optimisation results has been investigated.
Acknowledgement
The presented research is funded by the ECLIPS Specific Targeted Research Project of the European Commission "Extended Collaborative Integrated Life Cycle Supply Chain Planning System". It has been also partly supported by the European Social Fund within the National Programme "Support for the carrying out doctoral study programmes and postdoctoral researches" project "Support for the development of doctoral studies at Riga Technical University".
How to optimally synchronise replenishment cycles? The integer-ratio policy, applied in this research, doesn’t synchronize cycles. Other policies, such as power-of-two, nested and inverted nested, will be studied in the future. The research will be focused on development of heuristic synchronisation algorithms.
ISBN 978-3-901608-32-2
Number of stock-outs (after optimisation) 0
The authors would like to thank Roel De Haes from Möbius Ltd. for a conceptual model of the database component.
8
Copyright © 2007 EUROSIM / SLOSIM
Proc. EUROSIM 2007 (B. Zupančič, R. Karba, S. Blažič)
9
9-13 Sept. 2007, Ljubljana, Slovenia
References
[1] G. M. Campbell and V. A. Mabert. Cyclical Schedules for Capacitated Lot Sizing with Dynamic Demands. In: Management Science, vol. 37, no. 4, pp. 409 – 427, 1991.
[5] D. Simchi-Levi, Y. Zao. Safety Stock Positioning in Supply Chains with Stochastic Lead Times. In: Manufacturing and Service Operations Management, vol. 7, no. 4, pp. 295-318, 2005.
[2] Y. Merkuryev, G. Merkuryeva, B. Desmet, and E. Jacquet-Lagrèze. Integrating Analytical and Simulation Techniques in Multi-Echelon Cyclic Planning. In: Proceedings of the First Asia International Conference on Modelling and Simulation (AMS 2007), Phuket, Thailand, 2007.
[6] D. Simchi-Levi, P. Kaminsky, and E. SimchiLevi. Designing & Managing the Supply Chain: Concepts, strategies and case studies. McGrawHill Companies, Inc., New York, USA. 2003. [7] ProModel. ProModel ActiveX User Guide. ProModel Corporation, Orem, Utah, USA, 2007.
[3] S. Smits. Tactical design of productiondistribution networks: safety stocks, shipment consolidation and production planning. Technische Universiteit Eindhoven. 2003.
[8] ProModel. SimRunner User Guide. ProModel Corporation, Orem, Utah, USA, 2002.
[4] A. Peyraud, C. Verlhac, V. de Vulpillières, and S. Timmermans. Report on the optimization model for cyclical network planning. Möbius Ltd., Eurodecision. 2006.
ISBN 978-3-901608-32-2
9
Copyright © 2007 EUROSIM / SLOSIM