Vol. 13(4), pp. 581-592, 22 January, 2014 DOI: 10.5897/AJB2013.13301 ISSN 1684-5315 ©2014 Academic Journals http://www.academicjournals.org/AJB
African Journal of Biotechnology
Full Length Research Paper
Development of specific primers for the detection of HVA1 from barley in transgenic durum wheat by polymerase chain reaction (PCR) technology Marouane Melloul1,2, Driss Iraqi3, Sripada M Udupa3,4, My Abdelaziz El Alaoui1,2, Sanaa Amine Alaoui2, Mohammed Ibriz1 and Elmostafa Elfahime2* 1
Genetic and biometry Lab, Faculty of Sciences, University Ibn Tofail, BP, 133, 14000, Kenitra - Morocco. Functional genomic platform - Technical Unit (UATRS) - National Center for Scientific and Technological Research (CNRST), Angle Allal Fassi / Avenue des FAR, Hay Riad ,B.P. 8027, 10102 - Rabat - Morocco. 3 National Institute of Agronomical research, Rabat-Morocco. Avenue de la Victoire B.P. 415 - Rabat - Morocco. 4 ICARDA-INRA Collaborative Research Project, International Center for Agricultural research in the Dry Areas (ICARDA), Rabat, Morocco.
2
Accepted 20 January, 2014
Genetic transformation is a widely employed tool in both basic research and commercial plant breeding programs. Its application requires that transgenes be stably integrated and expressed in the plant genome. When transgenic plants are developed, it is essential to determine which plants contain the transgene. Detection methods are usually based on amplification of the target transgene. This paper describes a development of detection method based on conventional and real time polymerase chain reaction (PCR) for simultaneous detection of barley HVA1 transgene and its transcript in transformed durum wheat. Since there exist a high homology between the barley HVA1 gene and the wheat gene, development of a specific sets of primers is needed for PCR-based characterizations, and the study of the transgene. Based on the alignment of the two genes sequences obtained from public databases, several primers were designed to detect and distinguish between the transformed and non-transformed plants. Real time PCR has been employed because of its inherent sensitivity and quantitative nature. It has been possible to design the following primers pairs F2/MMR, F2/R10 and F14/R10 as highly specific and suitable for the detection of HVA1 DNA by conventional and real-time PCR. Nonetheless, the primers used were allowed to reach high efficiencies and did not show any cross-reactivity with DNAs extracted from various plants. The sensitivity achieved was 6.4 pg. The primer pair F2/R10 was considered as highly specific for the detection of both DNA and mRNA of the HVA1 by real-time PCR. The assays proved to be accurate, specific, sensitive and sufficiently reproducible for further application in high-throughput molecular characterization of transgenic lines. Key words: HVA1, durum wheat, transgenic plant, real time polymerase chain reaction (PCR), drought.
INTRODUCTION Abiotic stresses, such as drought, salinity, extreme temperatures, chemical toxicity and oxidative stress are serious threats to agriculture and result in the deterio-
ration of the environment (Boyer, 1982). Abiotic stress leads to a series of morphological, physiological, biochemical and molecular changes that adversely affect
582
Afr. J. Biotechnol.
plant growth and productivity (Wang et al., 2001). Among the abiotic stresses, the availability of water is the most important factor that limits the productive potential of higher plants (Rodriguez et al., 2006). Drought is one of the most severe environmental stresses that affect almost all plant function (Yamaguchi Shinozaki et al., 2002) and is also considered as the primary limitation to wheat production worldwide (Mardeh et al., 2006). Durum wheat (Triticum durum L.) is the most important cereal crop in the Mediterranean basin. In Morocco, durum wheat is grown over an area ranging from 1 to 1.2 million hectares annually, and ranks the third after bread wheat and barley, with respect to production (MAPM, 2011). The country’s wheat productivity has been affected by various biotic and abiotic stresses (Karrou, 2003). To increase yields or reduce yield losses under such adverse conditions, it is necessary to improve tolerance to environmental stress (Shinozaki and Yamaguchi-Shinozaki, 2007). Developing a line of drought tolerant crops would alleviate the economical strain of losing crop yield due to insufficient water availability. Traditional breeding for increasing drought tolerance is difficult because of limited genetic diversity and the complex biochemical response plants have to drought stress (Bacsó et al., 2008). It is important, therefore, to look for alternative strategies to develop stress tolerant crops. They will provide an attractive and complementary option for improving a plant’s performance under stress conditions. Genetic engineering has undoubtedly opened a new avenue to overcome crop losses due to various abiotic stresses prevalent in the agricultural ecosystems (Bajaj et al., 1999). It provides novel opportunities for the transfer of agronomically useful genes in an elite cultivar without disturbing its genetic background (Rohila et al., 2002). A number of stress related genes have been isolated which can potentially improve the stress tolerance in plants (Bajaj et al., 1999). Late embryogenesis abundant (LEA) proteins are among the best known of water stressinduced proteins. These proteins accumulate during the late stage of seed formation and in vegetative tissues under drought, heat, cold and salt stress conditions or with abscisic acid (ABA) application (Sivamani et al., 2000). A LEA gene HVA1 (which encodes a group 3 LEA protein) from barley was engineered in rice (Chandra et al., 2004; Rohila et al., 2002; Xu et al., 1996), the transformed lines produced showed enhanced tolerance to drought stress. It has been introduced also into wheat (Debasis and Paramjit, 2003; Sivamani et al., 2000), and the transgenic plants showed improved biomass productivity and water-use efficiency under water-deficit conditions. HVA1 has been used successfully to confer stable tolerance to osmotic stress in oat (Maqbool et al.,
2002; Oraby et al., 2005) and mulberry (Lal et al., 2008). To produce transgenic plants, selection systems are used that lead to the selective growth of transformed cells. In many plant transformation systems, the availability of selectable markers is essential to recover transgenic plants. Genes conferring resistance to selective chemical agents, such as antibiotics and herbicides, are used routinely (Darbani et al., 2007). They have been found to be particularly effective for selection and provide a means for rapidly identifying transformed cells, tissues, and regenerated shoots (Goodwin et al., 2005). In many cases it has been regarded as unnecessary to carry out molecular analysis using vector DNA other than the gene of interest and the selectable marker (Smith et al., 2001). To confirm definitively the presence of a transgene, a sample with a positive signal in screening should be further analyzed using a construct-specific or eventspecific method (Griffiths et al., 2002). Expression of a transferred gene can be initially silenced or inactivated over time or generations by either transcriptional gene silencing (TGS) or post-transcriptional gene silencing (PTGS) triggered by diverse host defense responses (Matzke et al., 2000). Success at developing improved cultivars through genetic engineering depends on stable and predictable expression of the inserted gene. Thus it is widely considered necessary to confirm the expression of the transgenes before proceeding to downstream functional characterization. Polymerase chain reaction (PCR) is one of the most sensitive techniques for detecting the integrated gene in the transgenic plant genome (Wong and Medrano, 2005). Especially, real time PCR has been regarded as the most powerful tool for the detection and quantification of GMO despite its high expense (Tripathi, 2005). Real-time quantitative reverse transcription polymerase chain reaction (qRT-PCR) is a rapid, sensitive, and reliable method for the detection of messenger RNAs (mRNAs) (Bustin et al., 2005). The objective of the study was to design specific primers sequences of barley HVA1 gene in transgenic wheat for conventional PCR and real time PCR analysis. Designing highly specific primers to amplify the transgene will help either in the detection of the gene of interest (HVA1) in transformed plants and, in the measurement of its mRNA abundance and changes. The barley HVA1 and the wheat genes are highly similar at both nucleotide level and predicted amino acid level (Curry et al., 1991), this sequence homology between the two genes makes the detection of the HVA1 gene and mRNA in wheat very difficult by PCR or real time PCR. To our knowledge, this is the first report describing the development of specific primers able to detect DNA and mRNA of HVA1 in transgenic durum wheat by conventional PCR and
*Corresponding author. E-mail:
[email protected]. Tél: (212) 5 37 71 29 83 / 29 83. Fax: (212) 5 37 71 32 05. Abbreviation: LEA, Late embryogenesis abundant; ABA, abscisic acid; TGS, transcriptional gene silencing; PTGS, posttranscriptional gene silencing; PCR, polymerase chain reaction; CTAB, cethyltrimethyl ammoniac bromide; CT, cycle threshold.
Melloul et al.
quantitative real time PCR, respectively. MATERIALS AND METHODS Leaves from untransformed, transformed durum wheat line 1804, developed at National Institute of Agronomical Research, Laboratory of Biotechnology (Rabat -Morocco), kindly provided, were used in this study. For the specificity assessment, we used three durum wheat varieties, three bread wheat varieties, two maize, rice and oat. DNA extraction DNA was extracted from transformed, untransformed and other plants from frozen leaves. The cethyltrimethyl ammoniac bromide (CTAB) protocol was used for DNA extraction as described by Murray and Thompson (1980). The concentration of genomic DNA was determined by Nanodrop 8000 spectrophotometer (Thermo Scientific). Genomic DNA was measured by absorption at 260 nm, while DNA purity was evaluated using the ratio at 260/280 nm. RNA isolation and cDNA synthesis Total RNA was extracted from leaves by the Spectrum Plant Total Kit (Sigma Aldrich, St louis, US) in accordance with the manufacturer’s instructions. To avoid possible DNA contamination, a digestion by Ambion Turbo DNase (life technologies, US) was carried out on the RNA samples. RNA concentrations were measured at 260 nm by Nanodrop 8000. The quality and purity of the preparations were determined by measuring the OD260: OD280 nm absorption ratio (1.8-2.0), and the integrity of the preparations was ascertained by denaturated agarose gel electrophoresis (2%). DNase-treated RNA samples were reversetranscribed using The SuperScript III reverse transcriptase (Invitrogen, Carlsbad, CA) and oligo (dT)20 (Invitrogen) on 1 µg total RNA following the manufacturer’s recommendations (final volume of 20 µl). The cDNAs were then stored at -20°C until used in real-time PCR amplification. Primers design As HVA1 barley gene show high sequence similarity with the endogenous gene in wheat, the primers were designed manually using an alignment performed by ClustalW programm of software Geneious (Drummond et al., 2011), of the HVA1 sequence in the plasmid PBY520 with its homologous in durum wheat on the basis of sequences present in the GenBank database (AJ613581, AJ716526, BE428267, BE428883) (Figure 1). Different primers sets were designed to target the HVA1 gene, two forward primers and five reverse primers. The plasmid PBY520 contained the linked selectable marker/herbicide resistance bar (phosphinothricin acetyl transferase) gene (driven by cauliflower mosaic virus 35S promoter and the nopaline synthase nos terminator). 35S and NOS primers were used, for the screening of the transformed plants (Pietsch et al., 1997). To verify the amplification of extracted DNAs, a pair of primers CDC(a).F/CDC(a).R targeting the cell division control gene was used (Gimenez et al., 2011). The primers were synthetized using Polyplex machine (Gene machine, USA) at functional genomic platform - UATRS-CNRST. Table 1 lists all the primers used in this study. PCR conditions Reactions were performed on genomic DNA (100 ng) extracted
583
from transformed lines, on plasmid as positive control and on nontransformed lines as negative control for each designed primer. PCR’s were performed with 1 U platinium Taq DNA polymerase (Invitrogen), 1x PCR Buffer, 2.5 mM MgCl2, 0.2 mM dNTP mix, and 400 nM of each primer in a 25 µl reaction volume under the following conditions: preheating at 96°C for 3 min, then 35 cycles of denaturation at 96°C for 30s, annealing at 50-60°C for 30 s and extension at 72°C for 60 s, followed by final extension of 10 min employing a veriti PCR thermal cycler (Applied Biosystems, USA). The following primers combinations were used: F2/R1, F2/R4, F2/R5, F2/MMR, F2/R10 and F14/R10. The amplified fragments were electrophoresed on 2% agarose gels and detected using ethidium bromide along with molecular weight markers. Different primers pairs have been tested for the HVA1 gene amplification by qualitative PCR and those giving a specific product were also tested by the more sensitive real time PCR to confirm their specificity. Real time PCR: SYBR green detection DNA Reactions for real-time PCR using SYBR green detection consisted of 12.5 µl of SYBR green JumpStart Taq Ready Mix (Sigma-Aldrich, US), 400 nM forward and reverse primers, 100 ng of DNA template in 25 µl reaction volume. The PCR conditions were as follow, first denaturation at 94°C for 2 min, 45 cycles of denaturation at 94°C for 15 s, annealing and extension at 60°C for 60 s followed by a melting curve analysis with a temperature gradient of 0.1°C/s from 70 to 95°C. Sensitivity, efficiency and reproducibility Genomic DNA was serially diluted five-fold and conducted in triplicates to establish the standard curves. The extracted DNA was serially diluted to a final concentration of 20, 4, 0.8, 0.16, 0.032, 0.0064 and 0.00128 ng/µl. The amount of DNA per reaction is 20, 4, 0.8, 0.16, 0.032, 0.0064 and 0.00128 ng. Cycle threshold (CT), that is, the number of PCR cycles necessary to reach the threshold fluorescence level, was automatically determined by the Rotor gene software (Corbett Research, Sydney, Australia) based on the second derivative maximum method. Individual measurements for replicate real-time PCR reactions were plotted separately to obtain correlation coefficient (R²) that reflect the variation of the data set. The PCR efficiency was calculated using the slope of the standard curve as follows: PCR efficiency = 10-1/slope whereby an efficiency of 1 corresponded to 100% PCR efficiency, when all target molecules double in one PCR cycle and an efficiency of 0 indicates no amplification (Cankar et al., 2006). Each dilution was tested, using real-time PCR amplification, as previously described. RNA First strand cDNA was used as template for real time PCR amplifications with gene specific primers (confirmed specific by conventional PCR and real time PCR). KAPA SYBR fast qPCR Kit (Kapa Biosystems, cape town, SA) was used for the detection of HVA1 transcript. The PCR consisted of 10 µl SYBR green fast Ready Mix, 300 nM forward and reverse primers, 200 ng of cDNA and made up to 20 µl with water. The PCR’s mixtures was denatured at 95°C for 3 min, followed by 45 cycles of denaturation at 95°C for 10 s, annealing at 60°C for 30s and extension at 72°C for 1 s. The amplification period was followed by a melting curve analysis as mentioned above to exclude amplification of unspecific products. The real time PCRs for DNA and RNA were carried out on a RotorGene 6000 (Corbett Research, Sydney, Australia). The
584
Afr. J. Biotechnol.
Figure 1. Sequence alignment of barley HVA1 cDNA with its homologous in durum wheat on the basis of 4 sequences present in the GenBank database (AJ613581, AJ716526, BE428267, and BE428883). Positions of the primers are indicated by arrows.
Table 1. Primer sequences and length of PCR amplification products.
Primer CDC(a)_F CDC(a)_R 35S_F 35S_R Nos_F Nos_R F2 F14 R1 R4 R5 R10 MMR
Target CDC 35S NOS HVA1
Orientation Sense Antisense Sense Antisense Sense Antisense Sense Sense Antisense Antisense Antisense Antisense Antisense
Sequence (5’-3’) CAGCTGCTGACTGAGATGGA ATGTCTGGCCTGTTGGTAGC GCTCCTACAAATGCCATCA GATAGTGGGATTGTGCGTCA GAATCCTGTTGCCGGTCTTG TTATCCTAGTTTGCGCGCTA AGCTAGATCGTGAGACGAAGATG AGGAGAAGACCGGGCAGA GCTTGGTGGCCTCGGTGGTC CTTGGTGGCCTCGGCCGTC TCATCTGCCCGGTCTTC CCTGCGCCGTCTCGTACGTCTTGG CTCCTTGGCCGCCTG
Product length (bp) 77
Reference Gimenez et al. 2011
195
Pietsch et al. 1997
189
Pietsch et al. 1997 This work This work This work This work This work This work This work
Melloul et al.
585
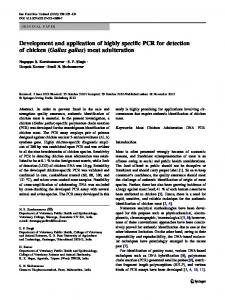
Figure 2. 2% Agarose gel electrophoresis of cell division control (CDC) PCR products amplified from wheat genomic DNA. M, 100 bp DNA ladder; lane 1, negative control; lanes 2, 3, and 4, non- transformed wheat; lanes 5 to 10, transformed wheat.
SYBR green PCR product was analyzed on 2% agarose gel with ethidium staining.
Sequencing analysis The products that were positive after conventional PCR analysis of DNA and real time PCR for RNA were subjected to sequencing, after purification using USB ExoSAP-IT reagent (Affymetrix). The sequences of each strand were determined by means of automated fluorescence sequencing on an ABI PRISM 3130xl sequencer (Applied Biosystems, USA) using BigDye Terminator v3.1 cycle sequencing Kit (Applied Biosystems) with the same primers used in PCR amplification. Sequence alignments were performed using the software MEGA 5.0 (Tamura et al., 2011).
RESULT Qualitative polymerase chain reaction (PCR) Amplification of DNA is generally influenced by the presence of PCR inhibitors, the extent of DNA damage and the length of the extracted DNA fragment. The endogenous gene CDC was used to confirm the presence of amplifiable wheat DNA, using the plant-specific primer pair CDC(a)_F/CDC(a)_R. Fragments of the expected target size (77 bp) were amplified in all tested samples, untransformed and transformed (Figure 2). Screening based on the 35S-PCR and Nos-PCR systems was performed using primer pairs previously described by Pietsch (Pietsch et al., 1997). The desirable PCR products of 195 bp fragment of CaMV 35S promoter and 180 bp fragments of NOS terminator (Figure 3) were amplified only in transgenic plants, while no such products were detected in non-genetically modified plants. After assessing the initial quality of the DNA extracted from the samples, and their screening using the
selectable markers, we proceed to the detection of HVA1 with the aim of obtaining specific amplicons, using the following primers pair F2/MMR (300bp), F2/R1 (147bp), F2/R4 (212 bp), F2/R5 (100 bp), F2/R10 (290 bp) and F14/R10 (212 bp). Except the primer pair F2/R1 (presence of two bands), clear and intense bands, with the expected size for all the primers pair were obtained in all transformed plants, including the positive control (Figure 4); however primers pair F2/R1, F2/R4 and F2/R5 failed to yield a specific assay for HVA1. A weak 147 bp band corresponding to primers pair F2/R1 was observed in the 3 untransformed samples. A smear was observed in the non-transformed samples using the primer pair F2/R4. The primer pair F2/R5 was unable to differentiate the transgenic from non-transgenic plant, a weak intensity band with expected amplifications products were present in non-transformed plants. These primers could not distinguish between transgenic and non-transgenic wheat, whereas the primers pair F2/MMR, F2/R10 and F14/R10 were successful to yield appropriately sized fragments in only transgenic wheat. No amplification of non-transgenic wheat was observed. These primers pairs were specific to transgenic wheat, and no amplification was found in non-genetically modified wheat. They were chosen to perform real time PCR to check their specificity. Real time PCR The specificity and sensitivity a of primer pairs F2/MMR, F2/R10 and F14/R10 has been tested with real time PCR using SYBR green detection. This intercalating molecule fluoresces upon binding to dsDNA, allowing the detection of any products accumulated during amplification, including non-specific reaction products, such as primer-
586
Afr. J. Biotechnol.
Figure 3. Detection of GMO target DNA (CaMV35S and NOS fragments) by 2% agarose gel electrophoresis. M: 100 bp DNA markers; 1: Negative control; 2, 3, and 4: non-transformed wheat; 5 to 10: transformed wheat; 11: Positive control (Plasmid PBY520).
dimers. The real time PCR is specific and sensitive enough to distinguish between transformed and nontransformed plants. The evaluation of the dissociation curves makes it however possible to identify specific amplicons from other products, by assessing their own melting temperatures. In order to assess the specificity of the selected primer pairs, amplifications have been carried out using DNAs extracted from various plants. The results indicate that no amplification was observed from the untransformed plants and from any of the species tested other than the target (Data not shown). With the primer pair F2/MMR, the melting curve analysis (Figure 5A) showed one product corresponding to transformed plants and positive control. No amplification was observed in non-transformed plants, whereas a signal was observed in nongenetically modified plants when using the primer pair F14/R10 with lower size (Figure 5E), this amplification
was also observed in qualitative PCR. With primers pairs F2/R10 fluorescent signals were detected only for transformed samples; no amplification was detected for non-transformed samples and the NTC (no template control). The dissociation analysis (Figure 5C) showed that the PCR reactions only produced one specific product; the curves were shaped and clear with no trace of nonspecific products or of primer dimers. These indicated that the primers F2/R10 were highly specific for the detection of HVA1. The potentiality of the real time PCR system to detect HVA1 has been demonstrated. The SYBR green product of the three primers pair was analyzed on 2% electrophoresis gel, a clear bands corresponding to the expected size were detected in all transformed plants and the positive control, whereas no amplification products were detected in non-transformed plants (Figure 5B, 5D, and 5F). To assess the sensitivity of these real-time PCR
Melloul et al.
587
Figure 4. PCR amplification of the HVA1 DNA after gene transfer into wheat using qualitative PCR. M, 100 bp marker; 1, negative control; 2 to 4, non-transformed wheat; 5 to 10, transformed wheat; 11, positive control (Plasmid PBY520). Forward primer F2 is combined with different reverse primers as follow: (A) F2/MMR; (B) F2/R1; (C) F2/R4; (D) F2/R5; (E) F2/R10. (F) Corresponds to primers combination F14/R10.
assays,standard curves were generated with genomic DNA using the primer pairs F2/MMR, F2/R10 and F14/R10 (Data not shown). The fluorescent signal could be detected when the amount of the DNA template was lowered to 6.4 pg. A very efficient amplification was obtained as indicated by the slope of the linear regression analysis (-3) with a good correlation coefficient (0.99) in all standard curves (Table 2). To further demonstrate the reproducibility of the quantitative system, we ran the real time PCR in triplicate with six dilutions of durum wheat genomic DNA using the 3 primers pair (F2/MMR, F2/R10 and F14/R14). The coefficients of variation (CV%) values
and the stan-dard deviation (SD) values for the 3 primers pair are indicated in Table 3. These data showed that the CV values and the SD values derived from these tests were relatively small and that this quantitative PCR detection system worked stably and reliably. For the detection of HVA1 transcript we used the primer pair F2/R10 in all tested samples. Robust amplification of the HVA1 mRNA was observed in transgenic samples (Figure 6). The post-amplification melting curve (Figure 6A) showed a sole, symmetric and sharp curve, indicating that only one product was accumulated. The real time PCR product was analyzed on electrophoresis
588
Afr. J. Biotechnol.
Figure 5. Melting curves analysis, showing the specific amplification of the target gene HVA1, and confirmation by agarose gel electrophoresis analysis. (A, B): Primers F2/MMR; (C, D): primers F2/R10; (E, F) primers F14/R10. NTC (no template control), transformed, non-transformed wheat and positive control are shown by arrows on the amplification plots. Lane M: DNA marker 100 bp; lane 1: water control; lanes 2 to 4: non-transformed wheat; lanes 5 to 10: transformed wheat; lane 11: positive control (Plasmid PBY520).
gel 2%, (Figure 6B); the reliability of the specific primers was confirmed by the unique fragment with expected size (290 bp). In controls with cDNAs from non-transformed plants, or with samples not treated with reverse transcriptase, no amplification products were detected. This result indicates that genomic DNA was completely removed from the RNA samples used for cDNA synthesis, thus, the HVA1 gene is transcribed in transgenic samples. The
primer pair F2/R10 was con-sidered highly specific for the detection of HVA1 mRNA.
Sequencing The identity of the PCR product has been checked by nucleic acid sequencing to confirm the specific amplifica-
Melloul et al.
589
Table 2. Real time PCR amplification efficiencies of HVA1 using genomic DNA obtained with three pairs of primers.
Primer pair F2/MMR F2/R10 F14/R10
Slope (gDNA) -3.114 -3.120 -3.218
Interception (gDNA) 29.91 26.65 30.64
Correlation coefficients (gDNA) 0.9986 0.9980 0.9941
PCR efficiencies (gDNA) 109 109 105
Table 3. Reproducibility of the Ct measurements by real-time PCR for six levels of concentration of genomic DNA form transformed durum wheat using the 3 pair of primers (F2/MMR, F2/R10 and F14/R14).
Starting concentration (ng/µl)
Ct Value
Average
SDa
CVb
34.36 33.43 30.39 28.08 25.7 23.75
35.11 33.21 30.37 28.03 25.69 23.78
1.08 0.69 0.08 0.04 0.04 0.04
3.076 2.077 0.263 0.142 0.155 0.168
31.59 26.7 24.88 22.84 20.16 18.31
29.05 27.53 24.71 22.82 20.09 18.42
29.88 27.43 24.77 22.75 20.12 18.32
1.48 0.68 0.1 0.13 0.04 0.09
4.953 2.479 0.403 0.571 0.198 0.491
31.34 29 27.34 25.09 22.7 20.76
32.05 29.37 27.71 25.03 22.51 20.74
31.82 29.6 27.59 25.11 22.65 20.75
0.42 0.74 0.21 0.09 0.12 0.01
1.319 2.5 0.761 0.358 0.529 0.048
1
2
3
Primer pair F2/MMR 0.0064 0.032 0.16 0.8 4 20
36.34 33.76 30.28 28 25.64 23.77
34.62 32.44 30.43 28 25.72 23.83
Primer pair F2/R10 0.0064 0.032 0.16 0.8 4 20
29 28.04 24.71 22.6 20.13 18.24
Primer pair F14/R10 0.0064 0.032 0.16 0.8 4 20
32.08 30.42 27.71 25.21 22.74 20.76
a
b
Standard deviation. Coefficient of variation.
tion of the expected region on the templates. The conventional PCR products amplified with the primers pair F2/MMR, F2/R10 and F14/R10 and the RT-real time PCR product amplified with the primers F2/R10 were sequenced. Using MEGA software, we aligned the sequences with the Reference sequence (Plasmid PBY520), the alignment showed a complete homology with the sequence on which they were designed (data not shown). The alignment analysis indicated that the isolated fragment came from the transgenic construct.
DISCUSSION Genetic engineering makes it feasible to transform drought resistance genes into plants; however a series of experiments are needed to confirm whether the genes
are successfully transformed and the target genes are expressed. The detection of transgenic plants in most crop species requires the use of selectable marker genes and selective agent. Selectable marker genes are introduced into plant genome to express a protein generally with an enzymatic activity, which allows distinguishing transformed from non-transformed cells, however, the detection of the transgene of interest and the study of mRNA transcribed from the introduced DNA provides far more information than a screening method. A transgene incorporated into the plant genome is integrated randomly and in unpredictable copy numbers, often in the form of repeats, which can influence its expression. The integration site also has a profound effect on the expression of the transgene, which is affected by intrinsic and extrinsic factors that can trigger methylation and reduce the stability of the expression
590
Afr. J. Biotechnol.
Figure 6. Real time RT-PCR to detect HVA1 mRNA transcript. (A) Post-amplification melting curves of total HVA1 RNA extraction from transgenic wheat obtained by real-time PCR using primer pair F2/R10 and (B) confirmation of amplification by electrophoretic analysis of the real-time PCR products. Arrows show specific amplification at 92 °C. NTC: no template control; Lane M: DNA marker 100 bp; lane 1: water control; lanes 2 to 4: non-transformed wheat; lanes 5 to 10: transformed wheat.
(Kooter et al., 1999). Silencing of introduced genes is routinely observed in polyploid plant species such as wheat. Such transgene silencing has been observed in transgenic wheat plants generated by microprojectile bombardment (Alvarez et al., 2000). There have been many reports about loss of transgene expression in subsequent generations (Brandle et al., 1995) and under certain environmental conditions (Meyer et al., 1992). Thus initial laboratory testing supplemented by extensive analyses of gene expression of the transgene are important. In some cases, the detection and the study of gene expression of a transgene is difficult due to sequence homology between the transgene and the endogenous genes. Because the wheat genome contains homologues of the barley HVA1 gene (Curry et al., 1991), the detection method of HVA1 transgene in the previous works, was only based on southern blot analysis using a probe that target a promoter (Sivamani et al., 2000), or a marker gene probe (Debasis and Paramjit, 2003). The aim of this work has been to develop PCR primers to detect the introduced DNA from a durum wheat line transformed to express a barley gene (HVA1). This work was designed to investigate also the ability to detect the mRNA of the transgene in transformed plant samples by real time PCR. The polymerase chain reaction is a highly specific and sensitive method for the detection of small amounts of target DNA. In the past few years, several PCR methods have been developed to detect GMOs for screening purposes including the detection of specific genes of interest (Zimmermann et al., 1998). Primers for PCR were designed to avoid the amplification of genomic DNA with 90% identity in sequence to the corresponding cDNA sequence of the transgene. Information available was used to set up a PCR based detection system. We used several primer combinations in this study to detect the HVA1 transgene. Primer pairs F2/R1, F2/R4 and F2/R5 were not able to distinguish the transgene from the
endogenous gene, whereas primer pairs F2/MMR, F2/R10 and F14/R10 were successful to amplify a 300, 290 and 212 bp fragments respectively from transgenic DNA, and no fragment was amplified from non-transgenic samples. The primers were specific to amplify the expected band sizes from DNA template. Identification of assay conditions that yield a single HVA1 transgene fragment without any amplification of non-transformed samples yields the potential of adaptation of our assay to real time quantification. Real-time quantitative PCR is considered to be an easy-to-use, accurate, specific, quantitative method. We amplify the HVA1 gene by the primers pair F2/MMR, F2/R10 and F14/R10. The specificity of the primers was confirmed by the absence of any fluorescence signal with the untransformed plants, and did not show any cross-reactivity with DNAs extracted from various plants. Analysis of the dissociation curves in real time PCR showed a specific amplification of target gene for all the primers. The assessment of the primers sensitivity, efficiency and reproducibility of the tests was determined by generating a standard curves. The analysis showed an acceptable efficiency. Each assay was 100% specific, reproducible and consistently detected DNA concentrations ≤7 pg. Among the three primers, the primer pair F2/R10 clearly was the highly specific primers as no fluorescence corresponding to non-transformed samples or primer dimers was detected. This specificity is basically attributable to specific primer pair designed to amplify the HVA1 gene. We have concluded that the primer pair F2/R10 can reliably be defined highly specific for amplification of HVA1 transgene in wheat. Since the HVA1 transgene is under the control of the Actin promoter, the transgene is expected to be constitutively expressed. We tested the primer pair F2/R10, for the amplification of HVA1 mRNA in transgenic samples by real time PCR. Real-time RTPCR is, at present, the most sensitive method for the
Melloul et al.
detection of low abundance mRNAs (Bustin, 2000). A major challenge was to detect HVA1 transcript. After several experiments, we successfully amplified the mRNA of HVA1 in transgenic samples, no fluorescence was observed in any of non-transgenic plants, the electrophoresis gel of the real time PCR product showed a clear bands corresponding to the expected size. The sequencing of PCR and real time RT-PCR products confirmed that the sequences corresponded to the target gene. We described here an assay based on PCR and real time PCR assays for specific and sensitive detection of HVA1 in transgenic durum wheat. The methods are reproducible since all experiments were repeated at least twice. We demonstrate in this study that HVA1 transgene can be specifically amplified even in a complex genetic background containing homologous gene, facilitating the identification and study of transformed plants. Development of specific primers capable of distinguishing the transgene transcript from other homologous transcript is essential for the study of transgene transcriptional regulation. The successful detection of HVA1 transcript will allow for the assessment of transgene transcription throughout plant development.
ACKNOWLEDGEMENTS This work was supported by Moroccan Ministry of High Education and research via the National Center for Scientific and Technological Research (CNRST). We would like also to thank the ICGEB, Italy for generous funding. The authors would like to thank Naima lahlouhi for technical assistance. REFERENCES Alvarez ML, Guelman S, Halford NG, Lustig S, Reggiardo MI, Ryabushkina N, Shewry P, Stein J, Vallejos RH (2000). Silencing of HMW glutenins in transgenic wheat expressing extra HMW subunits. Theor. Appl. Genet. 100(2):319-327. Bacsó R, Janda T, Galiba G, Papp I (2008). Restricted transpiration may not result in improved drought tolerance in a competitive environment for water. Plant Sci. 174(2):200-204. Bajaj S, Targolli J, Liu L-F, Ho T-H, Wu R (1999). Transgenic approaches to increase dehydration-stress tolerance in plants. Mol. Breed. 5(6):493-503. Boyer JS (1982). Plant productivity and environment. Science (New York, N.Y.). 218(4571):443-448. Brandle JE, Mchugh SG, James L, Labbe H, Miki BL (1995). Instability of transgene expression in-field grown tobacco carrying the csrl-l gene for sulfonylurea herbicide resistance. Bio-Technology 13(9):994-998. Bustin SA (2000). Absolute quantification of mRNA using real-time reverse transcription polymerase chain reaction assays. J. Mol. Endocrinol. 25(2):169-193. Bustin SA, Benes V, Nolan T, Pfaffl MW (2005). Quantitative real-time RT-PCR--a perspective. J. Mol. Endocrinol. 34(3):597-601. Cankar K, Stebih D, Dreo T, Zel J, Gruden K (2006). Critical points of DNA quantification by real-time PCR-effects of DNA extraction method and sample matrix on quantification of genetically modified organisms. BMC Biotechnol. 6:37. Chandra Babu R, Zhang J, Blum A, David Ho TH, Wu R, Nguyen HT
591
(2004). HVA1, a LEA gene from barley confers dehydration tolerance in transgenic rice (Oryza sativa L.) via cell membrane protection. Plant Sci. 166(4):855-862. Curry J, Morris CF, Walkersimmons MK (1991). Sequence-Analysis of a Cdna-Encoding a Group-3 Lea Messenger-Rna Inducible by Aba or Dehydration Stress in Wheat. Plant Mol. Biol. 16(6):1073-1076. Darbani B, Eimanifar A, Stewart CN Jr., Camargo WN (2007). Methods to produce marker-free transgenic plants. Biotechnol. J. 2(1):83-90. Debasis P, Paramjit K (2003). Genetic transformation of Indian bread (T. aestivum) and pasta (T. durum) wheat by particle bombardment of mature embryo-derived calli. BMC Plant Biol. 3(1):5-5. Drummond AJ, Ashton B, Buxton S, Cheung M, Cooper A, Duran C, Field M, Heled J, Kearse M, Markowitz S, Moir R, Stones-Havas S, Sturrock S, Thierer TAW (2011). Geneious v5.4, Available from http://www.geneious.com/. Gimenez MJ, Piston F, Atienza SG (2011). Identification of suitable reference genes for normalization of qPCR data in comparative transcriptomics analyses in the Triticeae. Planta 233(1):163-173. Goodwin JL, Pastori GM, Davey MR, Jones HD (2005). Selectable markers:antibiotic and herbicide resistance. Methods Mol. Boil. (Clifton, N.J.). 286:191-202. Griffiths K, Partis L, Croan D, Wang MN, Emslie DKR (2002). Review of technologies for detecting Genetically modified materials in commodities and food. Department of Agriculture, Fisheries and Forestry - Australia. 1-126. Karrou M (2003). Conduite du blé au Maroc (behavior of wheat in Morocco). National Institute of Agricultural Research (INRA Editions), Rabat, Maroc. 57. Kooter JM, Matzke MA, Meyer P (1999). Listening to the silent genes:transgene silencing, gene regulation and pathogen control. Trends Plant Sci. 4(9):340-347. Lal S, Gulyani V, Khurana P (2008). Overexpression of HVA1 gene from barley generates tolerance to salinity and water stress in transgenic mulberry (Morus indica). Transgenic Res. 17(4):651-663. MAPM (2011). Situation de l'Agriculture Marocaine (Agriculture situation in Morocco), Ministry of Agriculture and Fisheries, Rabat, Morocco. 204. Maqbool B, Zhong H, El-Maghraby Y, Ahmad A, Chai B, Wang W, Sabzikar R, Sticklen B (2002). Competence of oat ( Avena sativa L.) shoot apical meristems for integrative transformation, inherited expression, and osmotic tolerance of transgenic lines containing hva1. TAG. Theoretical and applied genetics. Theoretische und angewandte Genetik 105(2-3):201-208. Mardeh ASS, Ahmadi A, Poustini K, Mohammadi V (2006). Evaluation of drought resistance indices under various environmental conditions. Field Crop Res. 98(2-3):222-229. Matzke MA, Mette MF, Matzke AJ (2000). Transgene silencing by the host genome defense: implications for the evolution of epigenetic control mechanisms in plants and vertebrates. Plant Mol. Biol. 43(23):401-415. Meyer P, Linn F, Heidmann I, Meyer H, Niedenhof I, Saedler H (1992). Endogenous and Environmental-Factors Influence 35s Promoter Methylation of a Maize A1 Gene Construct in Transgenic Petunia and Its Color Phenotype. Mol. Gen. Genet. 231(3):345-352. Murray MG, Thompson WF (1980). Rapid isolation of high molecular weight plant DNA. Nucleic Acids Res. 8(19):4321-4325. Oraby HF, Ransom CB, Kravchenko AN, Sticklen MB (2005). Barley Gene Confers Salt Tolerance in R3 Transgenic Oat. Crop Sci. 45(6):2218. Pietsch K, Wailblinger HU, Brodmann P, Wurz A (1997). Screeningverfahren zur Identifizierung gentechnisch veränderter pflanzlicher Lebensmittel. 93:2. Rodriguez M, Canales E, Borroto CJ, Carmona E, Lopez J, Pujol M, Borras-Hidalgo O (2006). Identification of genes induced upon waterdeficit stress in a drought-tolerant rice cultivar. J. Plant Physiol. 163(5):577-584. Rohila JS, Jain RK, Wu R (2002). Genetic improvement of Basmati rice for salt and drought tolerance by regulated expression of a barley Hva1 cDNA. Plant Sci. 163(3):525-532. Shinozaki K, Yamaguchi-Shinozaki K (2007). Gene networks involved in drought stress response and tolerance. J. Exp. Bot. 58(2):221-227.
592
Afr. J. Biotechnol.
Sivamani E, Bahieldin A, Wraith JM, Al-Niemi T, Dyer WE, Ho TD, Qu R (2000). Improved biomass productivity and water use efficiency under water deficit conditions in transgenic wheat constitutively expressing the barley HVA1 gene. Plant Sci. 155(1):1-9. Smith N, Kilpatrick JB, Whitelam GC (2001). Superfluous Transgene Integration in Plants. Crit. Rev. Plant Sci. 20(3):215-249. Tamura K, Peterson D, Peterson N, Stecher G, Nei M, Kumar S (2011). MEGA5: Molecular evolutionary genetics analysis using maximum likelihood, evolutionary distance, and maximum parsimony methods. Mol. Biol. Evol. 28(10):2731-2739. Tripathi L (2005). Techniques for detecting genetically modified crops and products. Afr. J. Biotechnol. 4(13):1472-1479. Wang WX, Vinocur B, Shoseyov O, Altman (2001). Biotechnology of plant osmotic stress tolerance: physiological and molecular considerations. Acta Hortic. 560:285-292. Wong ML, Medrano JF (2005). Real-time PCR for mRNA quantitation. BioTechniques 39(1):75-85.
Xu D, Duan X, Wang B, Hong B, Ho T, Wu R (1996). Expression of a Late Embryogenesis Abundant Protein Gene, HVA1, from Barley Confers Tolerance to Water Deficit and Salt Stress in Transgenic Rice. Plant Physiol. 110(1):249-257. Yamaguchi Shinozaki K, Kasuga M, Liu Q, Nakashima K, Sakuma Y, Abe H (2002). Biological mechanisms of drought stress response. JIRCAS Working Rep. 23(1341-710X):1-8. Zimmermann A, Hemmer W, Liniger M, uuml, thy J, Pauli U (1998). A Sensitive Detection Method For Genetically Modified MaisGardTM Corn Using a Nested PCR-system. Lebensmittel-Wissenschaft undTechnologie 31(7/8):664-667.