Thus, we made the assumption that more commits leads to more influence, in ..... normal after many years. This also happens frequently in the entertainment.
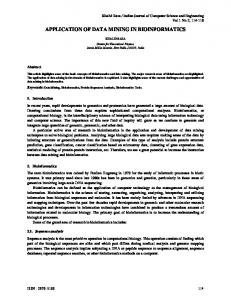
DevRank: Mining Influential Developers In Github Zhifang Liao1 Haozhi Jin1 Yifan Li1 Benhong Zhao1 Jinsong Wu2 Liu Shengzong3 (1) Department of Software Engineering,Central South University,China (2) Department of Electrical Engineering, Universidad de Chile,Santiago (3) Hunan University of Finance and Economics,China
Abstract—As the social coding is becoming increasingly popular, understanding the influence of developers can benefit various applications, such as advertisement for new projects and innovations. However, most existing works have focused only on ranking influential nodes in non-weighted and homogeneous networks, which are not able to transfer proper importance scores to the real important node. To rank developers in Github, we define developer’s influence on the capacity of attracting attention which can be measured by the number of followers obtained in the future. We further defined a new method, DevRank, which ranks the developers by influence propagation through heterogeneous network constructed according to user behaviors, including “commit” and “follow”. Our experiment compares the performance between DevRank and some other link analysis algorithms, the results have shown that DevRank can improve the ranking accuracy. Keywords: Github; Influence propagation; Link analysis algorithms; DevRank
Ⅰ.
Introduction
Influence is a complicated force that affects the behaviors of people. It is well recognized that mining influential people are the keys of promotion. With the effect of “word of mouth”, influential people can help to speed the promotion. As the emergence of social coding platforms, more and more developers construct their projects on the online platforms. Github[1] is the Facebook of social coding [9] and a popular online code hosting service built on top of Git, a decentralized version control system (DVCS)[10], which supports pull-based development paradigm[11]. As the biggest social coding platform, there are more than 1.7 million developers and 3 million projects on it, and it can be considered as a large-scale community[2]. Mining influential developers in Github can help to spread new information and innovation, it is also conducive to increase the efficiency of social coding. On traditional social networks like Facebook and Twitter , Internet sensations always have many “fans” on social website, and these sensations are easier to influence others due to their significant numbers of “fans”, who are prone to attract new “fans”. Similarly, influential developers and projects are also more attractive than others. In Github, developers can “follow” other developers and “star” some projects if they are interested in them. Thus, we define the influence of developers/projects as the ability to attract new “follow”/“star” in the future. PageRank[3] and HITS[4] are frequently-used when measuring the influence or importance of nodes in social
network. While both of the approaches work well in ranking the most influential nodes via analyzing the structures in social networks. Both of the approaches measure the importance of nodes by average propagation according to the direct structure with non-weight links, which cannot transfer proper importance to the real important node[5], these methods are also vulnerable to cheating links due to a single kind of edges. To solve this problem, we propose a new approach DeveloperRank (DevRank) which can be applied to a heterogeneous network that has different kinds of edges according to the most common events in Github, “follow” and “commit”. DevRank classifies the target heterogeneous network into a homogeneous network(using “follow” information) and a bipartite network(using “commit” information), and computes influence scores using an unbalanced propagation strategy between nodes during iterations. The remainder of this paper is structured as follows. In Section 2, we review the related work. Section 3 describes our proposed model for ranking developers in Github. Then, we present the experiment result and evaluations in Section4. Finally in section 5, we conclude the future research direction. Ⅱ.
Related Work
Mining influential people in a social network is a meaningful work during long term exploration. There are a number of traditional methods to measure the authority of nodes, including degree, closeness, betweenness[4]. Eigenvector centrality based approaches, which measure nodes’ authority by the maximum eigenvalue of the adjacency matrix of network such as PageRank, HITS, Katz and their derivative methods, show better performance than traditional methods, and they are widely used for ranking influential nodes in social networks. E. Katz[2] called the influential persons as “opinion leaders”, and C. Wang[3] found that opinion leaders have higher PageRank scores than others. Zhengqiu Yang[4] conducted a study in the graph structure, social attributes and random walk model, proposed an approach called SocialRank to measure the influence of individual. Zeng Wei[5] has studied social network influence maximization problem and the existing algorithms, proposed a measure called HGA algorithm, which combines with a heuristic candidate seeding algorithm based on hidden influence and an activation model based on floating influence, and the HGA scores is an effective indicator of social influence of nodes in a social network. Hassan Sayyadi[6] constructed a author-paper heterogeneous network, and classified it into
a citation network and an authorship network, then he proposed a measure to rank the nodes by FutureRank scores, which is calculated with three parts, including the hub scores when calculating the importance of citation network with HITS approach, the PageRank scores when calculating the importance of authorship network with PageRank approach, and the time scores, which is also an effective indicator to predict citation in the future. Yi Li[7] proposed a measure called CommRank, which aims at calculating the social influence of communities, and he also proposed an approximation algorithm based on CommRank to solve a influence maximization problem. Thung[8] constructed the developers network and projects network, and applied PageRank algorithm to calculate the importance of nodes in the networks which measure the influence of developers or projects, he also analyzed how strong the relationship is between the developers and the projects. All the methods show an improved performance over traditional approaches. Ⅲ.
DevRank Model
Most existing works using only “follow” to measure developers’ influence, such as [8][9]. As we mentioned before, single kind of non-weghted edges can not transfer proper importance to the real important nodes. Based on this situation, we present a model, DevRank, that using not only “follow” but also “commit” to measure the developers’ influence. In this section, first some statistics results are presented to explain why “commit” information is used to calculate the developers’ influence. Then we introduce the structure of Github network constructed by both “follow” and “commit”, and finally present DevRank based on Github network. A. Follower-Commit relationship and Star-Commit relationship Github is a platform with transparency environments for open source-style development, and allows any developers to clone any public repositories and commit changes at will. User can “follow” other users whom they are interested in, and “star” or “watch” the projects which they want to join in, they can construct their projects on the online platform, and “commit” their codes to other projects online[12]. First, we have picked about 9680 developers and 1396 projects started before 2012 to explore the relationship between three kinds of behaviors. Figure 1(a) shows the distribution of followers and commits, x denotes the number of developers’ commits, y is the number of developers’ followers. And Figure 1(b) shows the distribution of stars and commits, x is the number of projects’ commits, y is the number of projects’ stars. The follower-commit relation is shown as that developers’ followers increase with developer’s commits. Similarly, the star-commit relation is that projects’ stars increase with the projects’ commits received. Thus, we made the assumption that more commits leads to more influence, in other words, more commits a developer refers to a project, more influence scores propagate from the developer to the project.
(a)
(b) Figure 1: (a) shows the Distribution of followers and Commits (b) shows the Distribution of stars and Commits
To illustrate the assumption, we further conduct a research to confirm our assumption, we choose the same data set as before, and we count the average number of commits of developers and projects before 2012. We also count the average number of followers that developers obtained and the average number of stars that projects obtained during 2013. As shown in Figure 2, the red bars denote the number of followers newly obtained, and the yellow bars denote the number of stars newly obtained, and horizontal axis shows the commits range of developers or projects. For instance, developers whose commits range in (600,700] before 2012, obtained 80.43 followers during 2013 per person, projects whose commits range in (700,800] ,obtained 86.12 stars during 2013 per project. This diagram shows that, the number of new followers and new stars increases along with the increase of commits, which confirms the assumption that “commit” affects developers’ influence scores and projects’ influence scores positively, so nodes with more commits should gain more influence scores during iteration.
Figure 2: Average number of followers newly obtained based on the average number of commits of a developer(red bar),and average number of stars newly obtained based on the average number of commits of a project(yellow bar)
B.
Decomposition of Github Network As commit plays an important role in developers’ influence, we extend the network by the data of “follow” and “commit” behaviors together. The target is to predict the number of future followers of the developers and the number of future stars of the projects in order to
have a better ranking model. An abstract graph model is constructed as Figure 3.The network has two types of nodes, developers and projects. In addition, there are two types of edges, follow edges which are between developers, and commit edges which are between developers and projects, and they are both directed. The follow edges are non-weighted and the commit edges are weighted as the number of commits. To analyze the nodes’ influence by different behaviors, we partition the Github network into two networks to use two different kinds of behaviors in the same model which can be used to transfer influence through different networks. The first only contains the developer nodes and “follow” edges, so we can utilize PageRank to transfer influence scores between developers. The second network contains developers and projects, and they are connected by “commit” edges. The second network is a bipartite network which can mapped onto a HITS-type network. Thus, influence scores can be passed between developers and projects by HITS. Figure 4 shows the mapping.
First, we introduce the asymmetric propagation strategy of passing influence. For example, as we can see from Figure 3, which Jack has committed m times to JavaScript and k times to Ruby, so authority scores Jack transfer to JavaScript should be m*Inf(Jack)/(m+k) during each iteration, where Inf(Jack) denotes the authority scores of Jack. Similarly, JavaScript has received m commits from Jack and n commits from Mike, so the authority scores JavaScript transfers to Jack should be m*Inf(JavaScript)/(m+n) during each iteration, Inf(JavaScript) denotes the authority scores of JavaScript. We use propagation matrices to represent the propagation process in iterations:
M
DP i, j
M iC, j n c i , j D
n
c
T
M
PD i, j
M iC, j n c j , i
i, j
i 1
P
n
c
(5)
i, j
j 1
where MDP represent the propagation matrix from developers to projects, and MPD denotes the propagation matrix from projects to developers, nci,j denotes the number of commits di commits to pj. We use vectors to store ranking scores, where RP stores scores of projects and RD stores scores of developers. To solve the initialization problem and speed the iteration, we define the initial developer scores as the PageRank scores in the follow-network, the process is described as follow:
Figure 3: An example of the Github network
Figure 4: Network Decomposition: a follow-network and a commit-network
We define the two networks with adjacency matrices as follow: 1 if d i follows d j ; M iF, j (3) 0 otherwise ; where D is the set of developers, MF is the |D| × |D| follow matrix. For a node do not follow others, we consider it an unhealthy node, and we set MFi,j = 1 for all j, which is always an approach to treat dangling nodes in PageRank.
In addition, we define the commit matrix as follow: 1 if d i commits to p j M iC, j 0 otherwise
( 4)
where P is the set of projects, MC is the |D| × |P| commit matrix. C.
Proposed Algorithm: DevRank Since two networks share nodes, we cannot compute rankings for each of the networks individually with different models. Instead, we present DevRank with asymmetric propagation strategy, which operates on both network, passing influence scores back and forth between the networks. Thus, the ranking algorithm is an iterative algorithm which runs one step of PageRank in follow-network, one step of HITS with asymmetric propagation strategy in commit-network. It then repeats the above steps until convergence.
1. R0D = (Inf(d1), Inf(d2),...Inf(dn)) = (1/n,1/n,...,1/n) 2. While err > threshold: 3. RnD = MF × Rn-1D; 4. RnD = Normalize( RnD) = RnD/sum(RnD); 5. err = ∑|Infn(di)-Infn-1(di)| 6. R0D = RnD 7. Return R0D where MF is the adjacent matrix of follow network. We have taken two common behaviors, “follow” and “commit”, into consideration via defining the propagation matrix, Thus DevRank is an iterative algorithm which repeat steps as follow: RnP M DP RnD1 RnD M PD RnP1 M F RnD-1
(6) 1- - (7 ) nd
where RP stores influence scores of projects and RD stores influence scores of developers. MDP represents the propagation matrix from developers to projects, and MPD is the matrix from projects to developers. MDP is not the matrix transpose of MPD because of the asymmetric propagation between developers and projects, nd represents the number of developers. n represents the iteration times. Projects’ influence scores and developers’ scores are updated mutually. The scores of developers and projects update after each iteration, and we normalize two vectors in order to limit the scores’ distribution. We set a threshold for iterative process, and the whole process is described as follows:
1. While err > threshold: 2. RnP =MDP×Rn-1D; 3. RnD =α×MF×Rn-1D+β×MPD×Rn-1P +(1-α-β)/nd; 4. err = ∑|Infn(di)-Infn-1(di)| + ∑|Infn(pi)-Infn-1(pi)| 5. Return RD,RP where RD denotes the vector that stores the developers’ authority scores. RP denotes the vector that stores the projects’ authority scores. The initial value of RD is (1/nd,1/nd,...,1/nd) and similarly the initial value of RP is (1/np,1/np,...,1/np), which ensures influence scores are all between 0 and 1. The property will hold after iteration too, since the computation performs an authority propagation and sum of the weights, α+β+(1-α-β), is equal to one. The time complexity is O(k*(2ndnp +2nd2 + np2), where nd denotes the number of developers, np denotes the number of projects, and k is the iteration times. Ⅳ.
Evaluation
In this section, we describe our data set and evaluate our proposed DevRank method with other traditional methods, and evaluate according to several performance criteria. A.
Data set We have evaluated DevRank on a real MySql dataset of Github, which were downloaded from GHTorrent, a scalable, queriable, offline mirror of data offered through Github Rest API. The data set contains records of 499000 developers’ behavior and 5602 projects’ information, where we consider projects with the same name or forked from the same repository as the same project. The set includes 505522 records of “follow”, 689000 records of “commit”, 12841 records of “star”, 60000 records of “comment on commit” and so on, which are based on the events that occurred on Github from 2006 to 2014. B.
Evaluation Setup For evaluation, we split the data set into two sets: the first set, contains 1047550 records of “follow”, 115473 records of “commit” and 89402 records of “star” before 2012, including 1047550 developers and 1320 projects. These developers have at least one record of “follow”, “commit” and “star”, and these projects are committed by these developers before 2012 in our data set. The second set is evaluation data set, including records of these developers and projects in the first set from 2012 to 2013. There were few records crossing the two sets, for instance, A is a developer who registered before 2012, while he followed someone registered after 2012, or committed to some projects established after 2012. These records have been removed in our evaluation. As we mentioned in Section Ⅲ , influential developers should obtain more followers in the future. Similarly, influential projects should obtain more stars in the future. Thus, we apply the first set in our experiment to compute influence scores of developers and projects, and use the second set to evaluate the result. C.
Ranking: Evaluation and Approaches For evaluating the ranking, we use two approaches: 1) precision curve, and 2) the Pearson’s ranking correlation between the rankings provided by DevRank
and PageRank computed on the test data. We compare DevRank with PageRank, HITS, and different version of DevRank: DevRank: Our proposed model with all available information(“follow” and “commit”), it is an link analysis algorithm which updates influence scores in the both commit-network and follow-network. 1 RnD M F RnD1 M PD RnP1 nd
RnP M DP RnD1 PageRank: It is a traditional link analysis algorithm, which could be considered as DevRank in follow network and non-weighted commit-network, and we set α=0.85, and random jump with probability of 0.15, n denotes the number of developers. We use PageRank to compute the nodes’ scores in the follow -network(α=0.85,β=0). 1- R nD M F * R nP 1 n
R
P n
M
C
R
d
D n 1
HITS: It is a traditional method with two types of nodes, hub-node and authority-node. The developers are set as hub-node, and projects are set as authority-node. Different with DevRank, HITS updates influence scores in non-weighted commit-network and does not use “follow” information(α=0.85,β=0). T 1- R nD M C * R nP 1 nd R nP M
C
* R nD 1
DevRank in Follow-Network(DF): A variant of DevRank, which update developers’ influence in follow-network and update projects’ influence in commit-network(β=0). RnD M F RnD1
1- nd
RnP M PD RnD1
DevRank in Commit-Network (DC): A variant of our DevRank which update both developers’ influence and projects’ influence in commit-network (α=0). 1- RnD M PD RnP1 nd
P n
R M
DP
D n 1
R
These methods are evaluated on the following two aspects: Influential developers ranking: As we defined developers’ influence as the capacity of attracting new followers, several approaches are used to compute developers’ ranking scores on the first data set, and the results are evaluated with the precision of prediction on the second data set. Influential developers according to the rankings should obtain more followers than other developers in the future. Thus, the precision is defined as follow: Pr ecision
Rankingtop k Followerstop k k
Influential projects ranking: Similar to the case of the influential developers ranking, influential projects according to the rankings should obtain more stars than other projects in the future. Pr ecision
Ranking
top k
S tar s top k
k
D.
Effect of Parameters on Precision Then we investigate the sensitivity of the performance of DevRank to different settings for the parameters which weights the “commit”(α), “follow”(β), and the evaluation is based on Top-50 influential developers prediction. Figure 5 shows the precision of DevRank for different values of α and β. The horizontal-axis shows the value of αand the vertical axis shows the value of β. Since α + β is always less than 1, the top right triangle of the map is empty. The darker the color in the heatmap, the higher the precision. Figure 5 shows the possible configurations of DevRank. For example, the precision shown on each edge of the heatmap triangle show a single part of DevRank. Values on the horizontal axis obtained for β = 0, so it means the horizontal edge shows all possible configurations of DevRank in follow-network(DF), while the vertical edge shows all possible configurations of DevRank in commit-network (DC) obtained for α=0, and the hypotenuse edge shows the precision of DevRank which α + β is equals to 1.
Figure 5 : The precision of DevRank for different settings of the two weighting parameters,α (horizontal axis) and β (vertical axis). In any point of the figure , α+β