Diagnosing Distributed Systems with Self-Propelled Instrumentation Alexander V. Mirgorodskiy1 and Barton P. Miller2 1
2
VMware, Inc.
[email protected] Computer Sciences Dept, University of Wisconsin
[email protected]
Abstract. We present a three-part approach for diagnosing bugs and performance problems in production distributed environments. First, we introduce a novel execution monitoring technique that dynamically injects a fragment of code, the agent, into an application process on demand. The agent inserts instrumentation ahead of the control flow within the process and propagates into other processes, following communication events, crossing host boundaries, and collecting a distributed function-level trace of the execution. Second, we present an algorithm that separates the trace into user-meaningful activities called flows. This step simplifies manual examination and enables automated analysis of the trace. Finally, we describe our automated root cause analysis technique that compares the flows to help the analyst locate an anomalous flow and identify a function in that flow that is a likely cause of the anomaly. We demonstrate the effectiveness of our techniques by diagnosing two complex problems in the Condor distributed scheduling system. Keywords: distributed debugging, performance analysis, dynamic instrumentation, trace analysis, anomaly detection
1
Introduction
Quickly finding the cause of software bugs and performance problems in production environments is a crucial capability. Despite its importance, the task of problem diagnosis is still poorly automated, requiring substantial time and effort of highly-skilled analysts. We believe that such diagnosis can be substantially simplified with automated techniques that work on unmodified systems and use limited application-specific knowledge. In this paper, we present our diagnostic framework, demonstrate that it is able to work on complex distributed systems, and describe real-world problems that it enabled us to diagnose in the Condor distributed cluster management software [28, 41]. The ability to collect and analyze traces from unmodified and unfamiliar systems is crucial in production environments, where the following three challenges significantly complicate problem investigation. First, many problems in production environments are difficult to reproduce on another system. Such problems require analysis in the field and demand collaboration between the customer and the developers. Second, modern systems are built of interacting black box components that often come from different vendors and provide limited support
for execution monitoring. Finally, if a system does support detailed execution monitoring, the volume of collected data can be exceptionally high and often impossible to analyze by hand. Our diagnostic approach uses a previous observation that problems often correspond to infrequent execution paths or paths that have properties deviating from common behavior [5, 10, 17, 20, 27]. By finding where the execution diverged from the norm, we may be able to determine the problem location. Our approach monitors system execution at a fine granularity, discovering and instrumenting communicating processes on-the-fly, and collecting function-level traces in distributed environments. Our trace analysis algorithm automatically compares traces to each other to identify unusual activities and point the analyst to a possible root cause of the problem. While there are several projects that collect event traces or profiles and analyze them automatically to simplify problem diagnosis [5, 10, 11, 15, 16, 20, 27, 30, 44], the following features of our approach make it suitable for on-demand diagnosis in production environments: Dynamic binary instrumentation across processes and hosts. We use self-propelled instrumentation to collect detailed function-level control flow traces from unmodified and unfamiliar systems [34]. The corner stone of selfpropelled instrumentation is an autonomous fragment of code called the agent that is injected into the system on a user-provided external event. After injection, the agent starts monitoring system execution by inserting trace statements into the system’s code ahead of the flow of control. With this technology, tracing can be rapidly enabled on demand so that the users experience no overhead if the system operates normally and no tracing is necessary. This paper extends self-propelled instrumentation to propagate from one process to another on inter-process communication. It allows us to discover communicating components and obtain distributed control flows. For example, we can start tracing a Web browser and propagate into the Web server and other components of an e-commerce system to obtain the complete control flow trace from the request to the reply. Identification of concurrent flows with limited system knowledge. In a system that processes more than one request at a time, the collected trace may contain events of concurrent requests arbitrarily interleaved. The presence of unlabeled events from multiple unrelated activities may be confusing for manual trace examination. Furthermore, events that belong to unrelated requests may occur in a different order in different runs. This behavior complicates automated analysis: a normal trace being examined may appear substantially different from previous ones and thus marked as an anomaly. To overcome these limitations, we decompose the trace into a collection of per-request traces that we call flows. Each flow is user-meaningful and more deterministic than the original trace. Our flow-construction approach uses application-independent rules where possible but can incorporate application-specific knowledge into analysis. As a result, our framework is likely to be easier to apply to a new system than previous application-specific techniques [5, 10, 24, 26]. Yet, unlike the applicationindependent techniques of DPM [32] and Whodunit [9], the user can improve
the accuracy of flow construction by providing additional knowledge into analysis. Unlike the technique of Aguilera et al. [3], our approach is not probabilistic and can construct accurate flows even for infrequent requests. Root cause analysis with limited user effort. Similar to dynamic program dicing [11, 30], Triage [43], and Pinpoint [10], we focus our analysis on differences in coverage between successful and failed flows. We look for functions that have been executed only in the successful or only in the failed flows. Such functions are correlated with the occurrence of the problem and often point to its root cause. In our experiments however, the number of differences in call path coverage perfectly correlated with failures proved to be large and most such differences corresponded to normal variations between flows. The key feature of our analysis is its ability to further reduce the number of differences to be examined manually yet attempt to retain the cause of the problem. The following sections discuss our approach in detail and show its effectiveness, finding the causes of two non-trivial bugs in the Condor distributed batch scheduling system [28, 41].
2
Propagation and Tracing
We locate bugs and performance problems by comparing control-flow traces for normal and anomalous activities in a system, e.g., comparing per-request traces in an e-commerce environment. Here, we describe our trace collection approach that we call self-propelled instrumentation. The corner stone of self-propelled instrumentation is an autonomous agent that is injected in the system upon a user-provided external event (e.g., a keypress) and propagates through the code carried by the flow of execution. Propagation is the process of inserting monitoring statements ahead of the flow of execution within a process and across boundaries between communicating processes. The key feature of this approach is its ability to work on unmodified distributed systems and start collecting traces on demand without a system restart. When the user decides to stop tracing, the agent can be deactivated. Within a process, we use the spTracer framework [34, 35] to intercept the execution of an application at function call instructions, though finer-grained branch-level instrumentation also can be implemented. The agent takes control at a call site in the application’s code, generates a trace record, instruments the next point of interest, and returns control to the application. This paper extends the self-propelled instrumentation technology to propagate across process and host boundaries on inter-process communication events. We follow the flow of control within a process where the start event happened, and carry the tracing over into another process when the two processes communicate. Each process generates an in-memory control-flow trace. When the user-specified deactivation event happens, we stop trace collection, assemble all per-host traces at a central location, and arrange observed events in a systemwide Parallel Dynamic Program Dependence Graph (PDG) [13]. The PDG is a DAG where nodes represent observed events and edges represent happenedbefore dependences between the events [25]. To construct the PDG, we need to observe events in different processes and establish the correspondence between matching send events in one process and
recv events in another. Our framework collects the necessary data dynamically, using five steps to propagate from one component to another: intercept a send event, identify the name of the destination process, inject the agent into the destination process (possibly, on a remote host), detect the receipt at the destination process, and follow the execution of the destination process. We begin by describing these steps for the foundational case of communication via TCP sockets and generalize it to other types of communication later. 2.1
Propagation over a TCP Socket
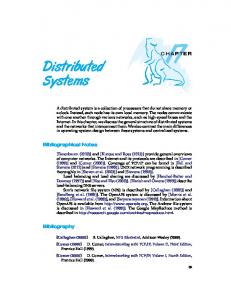
To enable the agent to propagate across host boundaries, we run daemon processes, called spDaemons, on all hosts in the system. These daemons can be started at system boot time, or they can be started by the agent on-demand, if nodes in the system support remote operations such as SSH (Secure Shell). Figure 1 shows how the agent in process P propagates into process Q. First, the agent library, agent.so, instruments the send and write routines in P . When reached, this instrumentation determines whether the accessed file descriptor corresponds to a TCP socket, and in that case, intercepts control of the process before it sends the message. Host A
Host B
spDaemon a.out send(msg)
Process P
spDaemon:
agent.so
agent.so
getpeer(ipB,portQ) inject(ipB,portQ) send(mark) send(msg) jmp back
find process by port, inject agent
socket msg
mark
Process Q
if (got mark) start propagation recv(msg) jmp back
a.out recv(msg)
Fig. 1: Propagation of the agent from process P on host A to process Q on host B when P attempts to send a message to Q over a TCP socket. Second, the instrumentation determines the name of the peer process, a tuple hhostid, pidi, where hostid is the IP address of the host and pid is the process identifier on that host. The remote hostid for a given socket can be found with the standard getpeername function. Since there is no standard mechanism for finding the remote pid, we use a two-step process to determine it. We use getpeername to find the remote port portid and send it to our spDaemon on the remote host. That daemon uses a technique similar to that of the netstat utility to map portid to pid : map port number to the inode number identifying the socket and scan the /proc tree to locate processes that opened a socket with that inode. Third, spDaemon injects a copy of the agent into the identified process using the Hijack mechanism [45]. This mechanism causes the process to load our shared library at run time. Fourth, the sender’s agent uses the TCP OOB (Out-of-band) mechanism to mark the first byte of the message and lets the application proceed with the send operation. At injection time, the receiver’s agent also instruments the entry points for recv and read library calls to identify the moment when the message arrives. When this instrumentation is executed, it checks whether the file descriptor corresponds to the original socket and whether the OOB mark has arrived. If so, the current recv event corresponds to the send event that triggered
cross-process propagation. Our agent instruments all functions on the stack, from main to the recv and starts the propagation procedure on the receiver side. Subsequent send and recv operations on this socket are matched using bytecounting: counting the number of bytes sent and received by each endpoint. A socket can be shared by multiple processes on a host, e.g., multiple HTTP daemons often share the same listening socket to accept multiple concurrent connections. To address this scenario, we keep byte counts in shared memory and each agent updates them atomically. Note that our technique does not send the code of the agent across the boundaries: each host uses a locally-installed copy of the agent and does not need to run untrusted downloaded code. This property can enable secure deployment of self-propelled instrumentation across administrative domains. To support such deployments, spDaemons could implement security policies specifying remote users who can request propagation through processes on this host and users who can download the resulting trace. This paper does not study this aspect further. 2.2
Other Communication Mechanisms
Similar to TCP sockets, our prototype propagates across UNIX pipes and UDP sockets. The primary difference between our support for these communication mechanisms lies in techniques for matching send and recv events. This task is non-trivial in presence of in-flight messages or for mechanisms that do not preserve the order of messages. In both cases, the first recv event observed after the injection may not correspond to the send event that triggered the injection. As mentioned above, we address this problem for TCP sockets by using the OOB mechanism and subsequent byte-counting. The OOB mechanism is supported only for TCP sockets. For local order-preserving communication mechanisms such as pipes and UNIX-domain sockets we can use a different technique for dealing with in-flight messages. After injection, the agent in the receiving process uses the FIONREAD ioctl interface [40] to determine the size of the backlog (the number of bytes queued in the channel). After this number of bytes have been received, the agent can start tracing the process. Further send and recv operations on this channel are matched using byte-counting. To match send and recv operations on UDP sockets, we use a datagrammarking technique similar to the approaches of Causeway [8] and SDI [37]. On each send operation, we put a sequentially-numbered mark on the datagram encoding it as a TS (timestamp) IP option and record the mark value in the local trace. On each recv operation, we extract the mark from the datagram and append it to the local trace. At the analysis time, send and recv operations with equal mark values can be matched together. The limitation of this technique is that routers and firewalls in some environments may remove IP options from forwarded packets, drop packets with options, or process them slower than normal packets. Determining how common such environments are and developing alternative solutions remain subjects for future work. Shared memory communication creates other challenges, and for these situations, we plan to use the technique from Whodunit [9].
3
Reconstruction of Distributed Control Flows
Bugs and performance problems in complex systems are often manifested by deviations of control flow from the common path. To identify such deviations and determine the root cause of a problem, we collect control-flow traces and analyze them manually or automatically. In distributed environments however, collected traces may contain events that correspond to different concurrent activities such as HTTP requests, possibly of multiple users. Events that correspond to one request are not explicitly labeled in the trace and can appear interleaved with events from other requests. Such interleaving of unrelated activities complicates manual trace analysis. It also increases trace variability and thus presents challenges for automated analysis. Events from different activities may appear in a different order in different runs. As a result, a normal trace may appear substantially different from previous ones and can be marked as an anomaly. click1
send URL
connect b
e
show page
receive page b
Legend
e
browser 1
web server
request start/stop events
e select
b
select accept e b
e select
accept
receive URL
select b
send page
e
select
non−blocking event b beginning of a blocking event
b
receive send URL page
e end of a blocking event same−flow events
e
b
browser 2 click2
connect
send URL
e b receive page
removed edge show page
Fig. 2: Flows in a Web server executing requests from two Web browsers To overcome these problems, we decompose the execution of an application into units that correspond to different semantic activities, referred to as flows. Flows are easier to analyze manually and automatically than the original trace. They contain logically-related events and there is little trace variability within a flow. For example, a Web server process can execute requests from two users in an interleaved order, as shown in Figure 2. Flows are shown as disjoint shaded areas in that figure. Unlike previous techniques for flow construction [3, 5, 9, 10, 24, 26, 32], our approach uses general rules to construct flows but can incorporate application-specific knowledge into analysis when the rules are insufficient. 3.1
Flow-Construction Algorithm
Our prototype traces function calls, returns, and communication events. This section describes our flow-construction algorithm in its general form since it also applies to a wider class of events. We define an event as an execution instance of an instruction in a process. Such an event can be represented by a tuple hlocation, seq id i, where location identifies the process and the instruction address within that process, while seq id is a sequence number, i.e., the number of executions of this instruction in the history preceding this event. This definition includes message-passing send and recv events since they typically correspond to execution of system call trap instructions. In our representation, flows are sets of events, where x ∈ Φ denotes that event x belongs to flow Φ. We formulate the task of constructing flows as a graph problem. First, we represent a system-wide control-flow trace as a PDG. This PDG is constructed from a set of start events S provided by the user
(e.g., request-arrival events). Then, we apply several graph transformations to the PDG, removing and adding edges to the graph to partition it into disjoint subgraphs. Each subgraph represents one flow. To transform the graph, we apply two application-independent rules to each pair of connected events u and v in the PDG. Both rules determine whether the pair of events must belong to the same flow. If these events do not satisfy either rule, we remove the edge u → v from the PDG. In the second step, we traverse the transformed PDG to find events reachable from events in the start set S. Events reachable from an event si ∈ S compose flow Φi . The first rule is the communication-pair rule that dictates that the pair of matching communication events belongs to the same flow: if s and r are matching send and recv events, then Φ(s) = Φ(r). This rule implies that inter-process edges in the PDG must not be removed. The second rule is the message-switch rule that dictates that a process can switch from one flow to another only on receiving a message. A pair of adjacent events xi−1 and xi in a process belong to the same flow unless the second event is a recv (a node with more than one immediate predecessor): if deg + (xi ) = 1 then Φ(xi ) = Φ(xi−1 ). Here, deg + (x) is the in-degree of x, the number of immediate predecessors of x in the PDG. To illustrate our algorithm, consider Figure 2. Both requests are serviced by the same server process in the interleaved order. By locating all nodes in the PDG with the in-degree of two and removing intra-process edges incidental to such nodes, we obtain a transformed PDG where all edges satisfy our rules. Inter-process edges satisfy the communication-pair rule and the remaining intraprocess edges satisfy the message-switch rule. Next, we traverse the transformed PDG beginning from the start events and construct two disjoint components that accurately represent the two user requests. Our representation of flows is most similar to dependence trees of Magpie [5]. However, Magpie does not use such trees to separate events from different requests. Instead, it relies on application-specific rules provided by the user and builds a tree later to represent each already-separated request. In contrast, the graph representation is central to our algorithm: we construct requests by separating the PDG into disjoint subgraphs. 3.2
Custom Directives
Our application-independent algorithm may attribute some events to the wrong flow. Consider a single-process server that receives requests from clients, enqueues them, services them later, and replies to the clients. In Figure 3, the process receives a request from client2, enqueues it, dequeues an earlier request from client1, and handles it. While Figure 3 shows the correct assignment of events to requests, this assignment could not be generated without knowing the relationship between enQ and deQ operations. The enQ2 and following deQ1 events belong to different requests, but our message-switch rule would attribute them to the same flow since they are not separated by a recv node. To provide application-specific knowledge to the analysis, we introduce the concept of a mapping directive. Each directive identifies a pair of events that should belong to the same flow. The added relation between two events allows us
to insert a new edge into the PDG. An important simplification is our observation that each directive needs to connect two events within the same process (interprocess dependences are correctly constructed by the communication-pair rule already). To give directives preference over the message-switching rule, we insert the edges first, treat them as inter-process edges, and then apply the local edgeremoving algorithm described in the previous section. Since directives require knowledge of system internals, they can be provided by system developers, rather than end users. To specify directives, we apply the event-join formalism of Magpie [5] to control-flow traces: our directives have the form hbb,jattr i, where bb is the address of a basic block in the code, jattr is a so-called join attribute, e.g., a program variable. The result of this directive is labelling an event corresponding to execution of bb with the join attribute of jattr. Control-flow events u and v with the same value of the join attribute are assigned to the same flow: if v.jattr = u.jattr, then Φ(v) = Φ(u). We translate each directive into a code fragment that is inserted into the basic block bb. When executed, the fragment saves the value of jattr along with bb in the trace. At analysis time, events with the same value of jattr are assigned to the same flow. Legend
client2 server
enQ 1
deQ 1 enQ 2
client1
event in flow 1 deQ 2
event in flow 2
edge added by the directives edge removed by the rules
Fig. 3: Flows constructed with the help of directives To match the enqueue and dequeue events in Figure 3, we can provide a simple directive: henQ:entry,argi → hdeQ:exit,ret val i. This directive assumes that the argument to the enQ routine is the address of the request structure to enqueue; the deQ routine returns that address on exit. At analysis time, we identify trace records where the argument to enQ was equal to the return value of deQ and introduce an artificial PDG edge between them. This operation increases the in-degree of the deQ node, causing us to remove the original intraprocess edge incidental to deQ and allowing us to separate the two requests.
4
Identification of Anomalies and their Causes
Specialized techniques aim at locating a single type of bugs, such as buffer overruns, memory leaks, or race conditions. Our approach however, belongs to another class of techniques that can locate a wide variety of problems, provided that they are manifested by deviation of the execution from the norm. Our approach looks for problems manifested by unusual control flow, such as functions that only executed in failed flows or took substantially more time in failed flows. To identify the causes of such problems, we use a two-step process. First, we perform data categorization: identify anomalous flows, i.e., one or several flows that are different from the rest and may correspond to failed requests. Second, we perform root cause identification: examine the differences between the anomalous flows and the normal ones to help the analyst identify the causes of the anomalies. To reduce the required manual effort, we eliminate some dif-
ferences that are effects of earlier ones. We also rank the remaining differences to estimate their importance to the analyst. 4.1
Data Categorization
Our framework can be deployed in two different scenarios: on-demand diagnosis of a particular problem and always-on system monitoring. In the first scenario, the end user often is able to categorize collected flows manually. If the problem occurs for a particular HTTP request, the user can mark that request as an anomaly. For always-on system monitoring however, manual categorization may not be feasible. A flow may fail silently, without user-visible effects. A flow may also start misbehaving after a non-fail-stop failure. To identify anomalous flows, we started with the algorithm of spTracer [35] and extended it to operate on distributed flows. spTracer summarizes each perprocess control flow trace as a fixed-length vector (a time profile), defines a distance metric between pairs of profiles, and finds one or more profiles that are most distant from the rest. To extend this approach to the distributed scenario, we construct distributed per-flow profiles. Each profile now summarizes activities in a single flow, spanning multiple processes where these activities occurred. Profiles that are most distant from the rest correspond to flows whose behavior is most different from common. In this paper, we use two types of flow summaries: coverage and composite profiles. The coverage profile for flow Φ is a bit vector pv (Φ) = hv1 , . . . , vF i of length F , where F is the number of different functions in all executed binaries. Bit vi is set if and only if the corresponding function fi was executed in flow Φ. Therefore, the difference between two coverage profiles identifies functions present in one flow and absent from another. As a result, flows that execute similar code will result in similar coverage profiles and vice versa. Our profiles also include call path profiles if we treat different call paths from main to each function as a separate function. For simplicity, we refer to components of profile vectors as functions. The experiments in Section 5, use the path-based method due to its higher accuracy. The composite profiles capture both the temporal behavior and the communication structure of a distributed application. A composite profile for flow Φ is a concatenation of two vectors: a multi-process time profile and a communication profile. The multi-process time profile pt (Φ) = ht1 , . . . , tF i is a natural extension of single-process time profiles used by spTracer. Here, ti is the fraction of time flow Φ spends on path i. The communication profile, is a vector ps (Φ) = hs1 , . . . , sF i. Here, si is the normalized number of bytes sent by path i on flow Φ. The addition of the communication structure allows us to detect anomalies that cause little change in the temporal behavior. For example, UDP message loss and retransmission will be visible in the communication profile while the time to handle this condition may not be noticeable in the time profile. In Section 5, both composite and coverage profiles proved equally effective at identifying anomalous flows. In other scenarios, composite profiles may be more suitable for detecting problems that result in little change in function coverage: indefinite blocking in system calls, infinite loops, and performance problems.
In contrast, coverage profiles may be more effective for locating anomalies in workloads with large normal variations in time or bytes sent on each flow. Furthermore, we use coverage profiles at the second stage of our diagnosis. They allow us to identify a problem even if it was in a short-running function that did not involve communication activities (e.g., a double free causing a later crash). Once profiles are constructed, we compute a distance metric between each pair of profiles as the Manhattan norm of their per-component difference. Then, we use the pair-wise distance metric to compute the suspect score of a profile, that is the distance of the profile to common or known-normal behavior. Finally, we report the profile with the highest score to the analyst as the most unusual. An important feature of this algorithm is its ability to integrate prior examples of known-normal behavior into analysis and thus avoid reporting unusual but normal behaviors as anomalies. 4.2
Root Cause Identification
spTracer focused on finding the most visible symptom of a problem (the function where the most unusual amount of time was spent). This paper presents a root cause analysis approach that may identify more subtle problem causes occurring long before the failure. To locate such causes, we examine differences in coverage between normal and anomalous flows. Namely, we construct the set ∆a containing call paths that are present in the anomalous profiles and absent from all normal ones, the set ∆n containing call paths that are present in the normal profiles and absent from all anomalous ones, and their union ∆ = ∆a ∪ ∆n . By inspecting each path in ∆ and determining why it is present only in normal or only in anomalous flows, the analyst may be able to find the problem cause. For example, an intermittent double free bug would manifest itself by an extra call to free in anomalous flows, thus adding a path to ∆a . Similarly, an attempt to reference unallocated memory would result in an extra call to malloc in ∆n . In our experience however, the number of call paths in ∆ is often large. In addition to the call path corresponding to the root cause of the problem, ∆ may contain subsequent symptoms of the same problem. We refer to such call paths as problem-induced variations in coverage. ∆ may also contain unrelated paths that are caused by slight differences in system load or program input between flows. We refer to such call paths as normal variations in coverage. While we cannot distinguish problem-induced variations from normal variations automatically, we can substantially reduce the number of variations of each type. In our experience, a single variation in the execution can generate multiple call paths in ∆. We attempt to retain one path for each cause by using two transformations of set ∆. We present these transformations on the example of ∆a ; the same techniques also apply to ∆n . First, assume that function main called functions A and D only in the anomalous run; function A also called functions B and C. As a result, set ∆a will contain call paths main → A, main → A → B, main → A → C, and main → D. The corresponding call tree is shown in Figure 4a. To understand why the anomalous run was different from the normal run, we must explain why paths main → A and main → D are part of ∆a . Longer paths, main → A → B
main A B
main
main D
A
D
A,D
C
(a) ∆a
(b) ∆′a
(c) ∆′′a
Fig. 4: Call tree before and after the transformations and main → A → C would become part of ∆a automatically: since main → A was never observed in a normal run, any longer path also could not be observed in a normal run. Our first transformation examines each path π ∈ ∆a and discards all longer paths that contain π as a prefix. We denote the transformed set ∆a as ∆′a and show it in Figure 4b. Second, we merge call paths in ∆′a that differ only in the last call as such paths typically correspond to a single cause. The reason why functions A and D were invoked only in the anomalous flow is located in their parent, function main, thus making the parent, not the leaves, a potential problem location. We can therefore replace the two paths in ∆′a with a single composite path main → [A, D], creating ∆′′a shown in Figure 4c. If the application exhibited more than one problem in a single function, this optimization might hide one of the problems. However, we believe this case to be quite rare and the merging optimization to be widely beneficial. To further simplify examination of call paths in ∆′′a , we introduce two competing ranking techniques. The first technique arranges call paths in the order of their first occurrence in the trace. It assumes that the earlier differences between anomalous and normal flows are more likely to correspond to the root cause of a problem. This assumption holds for problem-induced variations in coverage (since all symptoms happen after the root cause). However, it may be violated for normal variations that can occur even before the root cause. Our second technique orders shorter call paths before longer ones. Shorter paths are easier to analyze. Furthermore, they often represent more substantial differences in the execution than longer paths.
5
Experience
Our earlier prototype proved useful for diagnosing bugs and performance problems in single-process scenarios and in a collection of identical processes [34, 35]. To evaluate our techniques in a distributed environment, we applied them to finding the causes of two bugs in the Condor distributed scheduling system. Condor provides batch scheduling, execution, and monitoring facilities for highthroughput computing tasks [28, 41]. It can schedule sequential and parallel jobs. Condor operates in a variety of environments from loosely-connected networks of desktop workstations to large-scale supercomputers and the Grid. Condor is a complex system that has a multi-tier architecture where different services are performed by different daemons communicating over the network. A simple user job requires cooperation of six different daemons on multiple hosts and also several auxiliary programs. In complex Grid environments, it
involves even more services. Internally, Condor uses several standard communication mechanisms including pipes, TCP sockets, and UDP sockets. It also implements custom primitives such as queues and timers for deferring actions. 5.1
File Transfer Problem
Condor allows the user to specify multiple jobs to be run as part of a single submission. Such a submission is referred to as a cluster. A recent bug caused the output files for some jobs in a cluster to be created in a wrong directory. The output for the first job is placed at the correct location, but the output for all subsequent jobs are created in the current working directory rather than the directory specified by the user. This problem has been fixed by Condor developers. Here, we describe how we found it with the help of our techniques. collector submit
negotiator
schedd startd
job
starter
rm tmp_dir
shadow
mail
Fig. 5: Communication diagram for scheduling a Condor job. Manually annotated with process names. To diagnose this problem, we submitted a cluster of five jobs to Condor (Version 6.7.17) and collected the traces starting from the condor submit command. Our tracer propagated through all the daemons and auxiliary programs involved in handling the jobs. When the last job in the cluster terminated, we saved the traces to disk. Collected traces allowed us to construct the PDG for the execution. Figure 5 shows a summary diagram that we created automatically from the PDG and visualized the resulting graph with the Graphviz package [18]. It shows the traces for a single-job submission since a five-job diagram and the full PDG are more complex. Each node in this diagram corresponds to a process that our agent traced. Each edge corresponds to one or several repeating communication events: sending a message, forking a child, or waiting for a child’s completion. This diagram allows us to understand the job scheduling process: condor submit contacts the schedd daemon on the local host, and schedd adds the job to its scheduling queue. Next, the schedd contacts the negotiator daemon to find a matching execution host for the job. The negotiator uses information maintained by the collector daemon to find an idle execution host and contact its startd daemon. The startd spawns an auxiliary process called the starter, and the schedd on the submitting machine spawns a process called the shadow. The starter and the shadow communicate to transfer the job input to the execution machine, start and monitor the job, and transfer the output files to the submitting machine on job completion. Finally, Condor notifies the user via email. Once all five jobs completed, we attributed collected events to separate flows, where each flow represented processing one user job. While following component interactions did not use Condor-specific knowledge, flow construction required di-
rectives. Without directives, communication diagrams for two consecutive identical jobs appeared substantially different from each other. By examining detailed flow graphs, we identified two instances where schedd switched from working on one job to another without a recv event. After introducing simple directives, the flows for identical jobs became visually similar. To quantify the accuracy of flow construction, we reused the core of our anomaly detection algorithm. We computed the distance metric between coverage profiles for two known-different jobs and the distance between two knownsimilar jobs. The distance between different jobs was 4.7 times higher than that between similar jobs. That is, our algorithm constructed similar flows for similar activities and substantially different flows for different activities. Another approach for validating the results of flow construction is to use high-level knowledge about the system. Consider a system for example, where the event of sending a packet from the server to the client always belongs to the same flow as the earlier incoming request from the client. If the results of the automated algorithm satisfy this property, we obtain additional assurance that flows are constructed accurately. Such properties can be naturally expressed by our custom directives. The effectiveness of this technique remains to be seen. Next, we obtained the profiles for each flow. In this study, profiles were already classified: the first job corresponded to the normal profile, subsequent ones corresponded to problem profiles. Therefore, we did not need to perform the anomaly detection step and directly applied our root cause identification technique. Namely, we compared the call path coverage profiles for the normal flow and the anomalous flow with the most similar coverage (corresponding to the second job). Each profile contained more than 80,000 distinct call paths. We represented each call path as a string of function addresses, sorted them lexicographically, and found strings present in one flow but not the other. This technique identified more than 21,000 differences between the flows; examining them manually would be infeasible. However, the transformations described in Section 4.2 were able to reduce the number of differences to 107 paths, a factor of 200 reduction, thus enabling manual path investigation. This result shows that filtering is essential for analysis of detailed coverage data in distributed systems. To locate the cause of the problem, we examined the remaining paths in the order of their first occurrence in the flow. Several early paths corresponded to normal variations in coverage: processing of the first job in the cluster requires additional initialization tasks. However, the 15th earliest difference pointed us to the root cause of the problem. The path (main → read condor file → queue → SetTransferFiles → InsertJobExpr → HashTablehM yString, inti::lookup) in condor submit was present in the anomalous flow but not in the normal one. By examining the source code for SetTransferFiles and InsertJobExpr, we found that the name of the output file was incorrectly registered in a hash table as a per-cluster attribute. Per-cluster attributes are shared among all jobs in a cluster while the output file has to be unique for each job. Changing SetTransferFiles to treat the output file name as a per-job attribute fixed the problem.
This study also uncovered a limitation of our current prototype. After fixing the problem, we discovered that the discussed path to HashTablehM yString, inti ::lookup was still part of the difference between the first and the second flow. Although this path was no longer taken when constructing the output file attribute, it was taken for several unrelated attributes that were correctly marked as percluster. Function SetTransferFiles invoked InsertJobExpr from several call sites, but our prototype did not distinguish these invocations as different paths. Unlike the path for the output file attribute however, these paths corresponded to normal variations between flows and must be ignored. Such variations did not prevent us from finding the cause of this problem. However, finding the causes of other problems may require analysis of paths that are distinguished by the call site information. Since our agent already uses call site instrumentation, augmenting our approach to record the site address for each function call is straightforward. Our analyses would be able to handle call paths of the form (main → site1 → A → site2 → B) without any modification. 5.2
Job-run-twice Problem
Techniques that allowed us to find the cause of the file-transfer problem also proved useful for finding another previously-diagnosed problem in the Condor environment. The shadow daemon contained an intermittent bug that could cause it to crash after reporting successful job completion. In such cases, the schedd daemon restarted the shadow and the job was run for the second time. Re-running the job after reporting its successful completion caused a higher-level work-flow management component built on top of Condor to abort; reporting job completion twice also was confusing for the end user. To model this hard-to-reproduce problem in our test environment, we inserted a controlled intermittent fault in the Condor source code. If the fault occurs, it terminates the execution of the shadow daemon after it writes the job completion entry in the log; if the fault does not occur, the shadow completes successfully. Similar to the file-transfer problem, we then submitted a cluster of five identical jobs to Condor, obtained the system-wide trace that began at condor submit, and separated the trace into flows. One of the flows contained an instance of the problem and our anomaly detection algorithm was able to identify such a flow as follows. Figure 6a shows the suspect scores computed for composite profiles of all flows without prior reference traces. Flows 1 and 5 have higher scores than the rest of the flows. Detailed examination of their differences from the common behavior showed that these differences corresponded to normal variations in activities performed only for the first and the last job in the cluster. Therefore, this approach is unable to locate the true anomaly. Coverage profiles performed similarly to the composite profiles and also could not locate the anomaly. Unlike the file-transfer scenario however, this problem was intermittent. As a result, we were able to obtain a set of known-correct traces, where the problem did not happen, and used them to improve the accuracy of anomaly detection. Figure 6b shows the suspect scores for all flows computed using such knowncorrect traces as a reference. Flows 1 and 5 receive low suspect scores because
0.30 0.20
suspect score
0.00
0.10
1.0 0.5 0.0
suspect score
1.5
similar flows were present in the normal run. In contrast, Flow 3 exhibits an anomalous behavior; it has not been observed in previous normal executions. Analysis of coverage profiles showed similar results. By examining Condor jobcompletion log records, we confirmed that our automated approach identified the correct anomaly: Flow 3 corresponded to the job that was run twice.
job1 job2 job3 job4 job5
(a) Without reference
job1 job2 job3 job4 job5
(b) With normal traces
Fig. 6: Suspect scores for five jobs with and without reference traces To identify the root cause of this problem, we analyzed differences in call path coverage between Flow 3 in the anomalous run and Flow 3 in the knownnormal previous run. The total number of paths present only in the anomalous flow or only in the normal flow was 964. After applying our filtering techniques, we reduced the number of paths to inspect to 37, a factor of 26. While substantial, the reduction factor was lower than that in the file-transfer problem since most differences corresponded to functions with smaller call path subtrees. Our techniques still enabled us to examine the remaining ones manually. We ranked all the paths by time of first occurrence. Similar to the file-transfer problem, several early paths corresponded to normal variations in the workload rather than anomalies. However, the 14th path corresponded to an immediate effect of the fault: schedd ’s function Scheduler::child exit invoked DaemonCore::GetExceptionString only in the anomalous flow. By examining the source code, we determined that child exit calls GetExceptionString when the shadow crashes or aborts. Next, this function writes a warning record to the schedd log file and reschedules the job. Due to the large log file, and the large number of log files from other Condor components, finding this record via manual inspection of the logs would be difficult. In contrast, our approach presented a small number of reports to the analyst and significantly simplified locating the failed component. To find the location of the fault in the shadow, we examined the last functions the shadow called in the anomalous Flow 3. The call path at the crash time pointed to the location where we previously inserted the fault thus correctly identifying the cause of the problem. To compare our ranking strategies, we also ordered call paths by their length. This strategy placed the call path to DaemonCore::GetExceptionString in the first position: this path was the shortest among the differences. Here, ranking by length was more effective than ranking by time of occurrence. In the file-transfer problem however, the true cause was ranked 31st by length and 15th by time. Determining which ranking technique works better in most environments and designing alternative ranking techniques remains future work.
5.3
Run-time overhead
In our previous experiments with real-life applications, the overhead of functionlevel instrumentation ranged from 35% for a call-intensive workload to less than 1% for an I/O-bound workload [33–35]. While some elusive problems may be masked by any amount of overhead, this limitation exists in all run-time diagnostic tools. Yet, they are still widely used and effective in many cases. Furthermore, the overhead of our tool might be lowered by using static structural analysis to reduce tracing of functions in inner loops. Another alternative is to combine our distributed propagation infrastructure with hardware branch-tracing capabiliR ties available in recent Intel processors [19]. Whether tracing every branch in hardware introduces less run-time overhead than tracing every function call with instrumentation is likely workload-specific. The efficacy of these optimizations is yet to be studied. Most importantly, the key feature of our approach is dynamic deployment in distributed environments, introducing zero overhead in normal execution, where no diagnosis is required.
6
Related Work
Our framework collects event traces, identifies semantic activities in the traces, such as requests, locates anomalous activities, and attempts to explain the causes of the anomalies. While several previous diagnostic approaches follow the same steps, we use substantially different techniques to target unmodified production environments. Below, we survey related work at each of these steps. 6.1
Techniques for Data Collection
Our approach can collect detailed traces from already-running unmodified distributed systems and it introduces zero overhead when disabled. AjaxScope diagnoses problems in a client’s browser by instrumenting the JavaScript source passing through a proxy server [22]. This approach works on unmodified systems but applies only to scripting environments. Within a single host, our technique is most similar to dynamic binary translation [1, 7, 12, 29, 31, 36, 39]. Triage combines binary translation of PIN [29] with record-replay capabilities [43]. The novel feature of our approach however, is its ability to cross host boundaries, propagating from one process into another in a distributed system. This property enables system-wide on-demand analysis of individual requests in the field. Unlike the single-host case, previous techniques for distributed tracing could not be applied to an already-running system and they typically collect coarsegrained traces that may be insufficient for accurate diagnosis. Magpie obtains traces of kernel events using probes already available in Windows and relies on binary rewriting for application-level tracing. Similarly, SysProf relies on static Linux kernel instrumentation [2]. Pinpoint and Stardust [42] collect traces of communication events by modifying middleware and applications. Some mechanisms can obtain more detailed traces, but they still require system modification and restart. Traceback uses offline binary-rewriting to instrument application components [4]. King and Chen obtain system-wide dependence graphs from applications that communicate via standard UNIX mechanisms [23]. To intercept all communication operations, they run the entire system inside a
virtual machine and modify the virtual machine monitor to capture all system calls made inside the guest operating system. Whodunit tracks communications through shared memory by running critical sections of the application in an instruction emulator [9]. To intercept message-passing communications, Whodunit uses send and recv wrappers in all components. 6.2
Techniques for Flow Reconstruction
A trace from a real-world distributed system may contain interleaved events from several concurrent user requests. To simplify trace analysis, several previous approaches attempted to separate events from different requests into flows [3, 5, 9, 10, 24, 26, 32, 42]. Our approach aims to support many systems with applicationindependent rules. These rules are similar to the algorithms of DPM [32] and Whodunit [9]. In scenarios where such rules are insufficient however, we allow the analyst to provide additional application-specific directives to analysis. These directives have the form similar to the event-join schema of Magpie [5]. The key feature of our flow-reconstruction approach is its ability to combine generic and application-specific knowledge in a uniform algorithm. Aguilera et al. studied probabilistic techniques for building causal flows without application-specific knowledge [3]. This approach looks for frequent causal paths in the system and thus may be used for locating performance bottlenecks. However, results presented by the authors indicate that this probabilistic approach generates many false paths for rare requests. As a result, it may not be accurate for locating the causes of infrequent bugs and performance anomalies. Another approach for flow construction is to assign a unique identifier to each request-arrival event and modify the source code of the system to pass this identifier to other components on inter-component communications. This technique has been used by Pinpoint [10], Stardust [42], the works of Li [26], and Krempel [24]. These projects can accurately track the paths of requests through components. However, they require extensive middleware modifications. 6.3
Techniques for Data Analysis
Our data analyses contain two steps. First, we use an anomaly detection algorithm to find an unusual request. In this step, we use the algorithm of spTracer [35], extended to operate on distributed rather than per-process flows. Second, we perform root cause analysis to find why the identified request is unusual. Below, we focus on this step, surveying techniques for root cause analysis. Several projects attempt to diagnose problems by correlating observed events with failures. Pinpoint looks for components (hosts or software modules) that are present only in failed requests. Jones et al. apply a similar idea at the program statement level, identifying statements that are frequently present in failed runs and absent in passing runs [20]. Dynamic program dicing [11, 30] and Triage [43] compare the dynamic backward slice for a variable with an incorrect value (a set of program statements or basic blocks affecting the variable) to the slice for a variable with a correct value, e.g., the same variable in a successful run. Finally, Cooperative Bug Isolation CBI) samples various predicates during pro-
gram runs (e.g., whether each conditional branch in the code was taken) and reports predicates correlated with failures to the analyst [27]. We apply a similar approach to function-level coverage data in a distributed system. Triage and dynamic program dicing have a finer level of detail, but they work in a single process. Another important feature of our approach is its ability to substantially reduce the number of differences to examine. In distributed environments, slicing-based approaches may also require similar filtering techniques though it remains to be seen. Similar to CBI and Jones et al., we also rank the differences so that more likely problem causes are ranked higher. However, our scheme can order even functions that are perfectly correlated with the failure rather than assigning the same highest rank to them. Magpie attempts to locate the cause of the problem from raw traces rather than trace summaries [6]. It automatically builds a probabilistic state machine that accepts the collection of traces, processes each anomalous trace with the machine, and marks events that correspond to state transitions with low probabilities as the causes of anomalies. Pip also operates on raw traces of events and checks them against a manually-constructed model [38]. These techniques could also be applied to our function-level traces. In our experience however, functionlevel traces in distributed systems are highly variable and the first difference is often caused by minor variations in workload for different runs. We eliminate most of such variations by summarizing traces as call path profiles. Yuan et al. propose a supervised technique for identifying known problems in failure reports coming from the field [44]. They summarize the system call trace for a failed run and find an already-diagnosed problem with the most similar summary. Cohen et al. construct signatures of application performance metrics and search the collection of signatures for previously-diagnosed performance problems [15]. Unlike both approaches, we operate on detailed function-level traces and thus can perform diagnosis with higher precision. Furthermore, these techniques target known problems and would be unable to diagnose new failures. Finally, there are several approaches that attempt to localize the root cause of a problem via repetitive modification of system parameters. Delta Debugging [46] and the first stage of Triage look for the minimum change in program input that cause the incorrect run to complete successfully. Delta Debugging also attempts to isolate the problem to a minimum set of program variables. Choi and Zeller diagnose race conditions by finding the minimum change in thread schedules that would make the problem disappear [14]. Whether these techniques can be generalized to handle production distributed systems remains to be seen.
Acknowledgments We wish to thank Naoya Maruyama, Ben Liblit, Somesh Jha, and Miron Livny for helpful comments and suggestions throughout this work. Discussions with Jaime Frey and Jim Kupsch helped us in our Condor experiments. This work is supported in part by Department of Energy Grants DE-FG02-93ER25176 and DE-FG02-01ER25510, and the National Science Foundation. The U.S. Government is authorized to reproduce and distribute reprints for Governmental purposes notwithstanding any copyright notation thereon.
References 1. K. Adams and O. Agesen, “A comparison of software and hardware techniques for x86 virtualization”, 12th International Conference on Architectural Support for Programming Languages (ASPLOS), Oct. 2006. 2. S. Agarwala and K. Schwan, “SysProf: Online Distributed Behavior Diagnosis through Finegrain System Monitoring”, 26th International Conference on Distributed Computing Systems (ICDCS), Lisboa, Portugal, July 2006. 3. M.K. Aguilera, J.C. Mogul, J.L. Wiener, P. Reynolds, and A. Muthitacharoen, “Performance Debugging for Distributed Systems of Black Boxes”, 19th ACM Symposium on Operating Systems Principles, Bolton Landing, New York, Oct. 2003. 4. A. Ayers, R. Schooler, A. Agarwal, C. Metcalf, J. Rhee, and E. Witchel, “TraceBack: FirstFault Diagnosis by Reconstruction of Distributed Control Flow”, Conf. on Programming Language Design and Implementation, Chicago, IL, Jun. 2005. 5. P. Barham, A. Donnelly, R. Isaacs, and R. Mortier, “Using Magpie for Request Extraction and Workload Modelling”, 6th Symposium on Operating Systems Design and Implementation, San Francisco, CA, Dec. 2004. 6. P. Barham, R. Isaacs, R. Mortier, D. Narayanan, “Magpie: real-time modelling and performance-aware systems”, 9th Workshop on Hot Topics in Operating Systems, Lihue, Hawaii, May 2003. 7. D. Bruening, E. Duesterwald, and S. Amarasinghe, “Design and Implementation of a Dynamic Optimization Framework for Windows”, 4th ACM Workshop on FeedbackDirected and Dynamic Optimization, Austin, TX, Dec. 2001. 8. A. Chanda, K. Elmeleegy, A.L. Cox, and W. Zwaenepoel, “Causeway: Support For Controlling And Analyzing The Execution Of Web-Accessible Applications”, 6th International Middleware Conference, Grenoble, France, Nov. 2005. 9. A. Chanda, A.L. Cox, and W. Zwaenepoel, “Whodunit: Transactional Profiling for MultiTier Applications”, EuroSys, Lisbon, Portugal, Mar 2007. 10. M. Chen, A. Accardi, E. Kiciman, J. Lloyd, D. Patterson, A. Fox, and E. Brewer, “Path-based Failure and Evolution Management”, 1st Symposium on Networked Systems Design and Implementation, San Francisco, CA, Mar. 2004. 11. T.Y. Chen and Y.Y. Cheung, “Dynamic Program Dicing”, International Conference on Software Maintenance, Montreal, Canada, Sept. 1993. 12. A. Chernoff and R. Hookway, “DIGITAL FX!32 Running 32-Bit x86 Applications on Alpha NT”, USENIX Windows NT Workshop, Seattle, WA, Aug. 1997. 13. J.D. Choi, B.P. Miller, R.H.B. Netzer, “Techniques for Debugging Parallel Programs with Flowback Analysis”, ACM Transactions on Programming Languages and Systems 13, 4, 1991. 14. J.D. Choi and A. Zeller, ”Isolating Failure-Inducing Thread Schedules”, International Symposium on Software Testing and Analysis, Rome, Italy, July 2002. 15. I. Cohen, S. Zhang, M. Goldszmidt, J. Symons, T. Kelly, and A. Fox, “Capturing, indexing, clustering, and retrieving system history”, 20th ACM Symposium on Operating Systems Principles, Brighton, UK, Oct. 2005. 16. W. Dickinson, D. Leon, and A. Podgurski, “Finding failures by cluster analysis of execution profiles”, 23rd International Conference on Software Engineering, Toronto, Ontario, Canada, May 2001. 17. D. Engler, D.Y. Chen, S. Hallem, A. Chou, and B. Chelf, “Bugs as deviant behavior: a general approach to inferring errors in systems code”, 18th ACM Symposium on Operating Systems Principles (SOSP), Banff, Alberta, Canada, Oct. 2001. 18. E. Gansner and S. North, “An open graph visualization system and its applications to software engineering”, Software: Practice & Experience 30, 11, Sept. 2000. R 64 and IA-32 Architectures Software Developer’s Manual, Volume 3B: 19. Intel Corp., “Intel System Programming Guide, Part 2”, Order Number: 253669-022US, Nov. 2006. 20. J.A. Jones, M.J. Harrold, and J. Stasko, “Visualization of test information to assist fault localization”, Intl. Conf. on Software Engineering, Orlando, FL, May 2002. 21. E. Kiciman and A. Fox, “Detecting Application-Level Failures in Component-based Internet Services”, IEEE Trans. on Neural Networks: Spec. Issue on Adaptive Learning Systems in Communication Networks, Sep. 2005.
22. E. Kiciman and B. Livshits, “AjaxScope: A Platform for Remotely Monitoring the ClientSide Behavior of Web 2.0 Applications”, 21st Symposium on Operating Systems Principles (SOSP), Stevenson, WA, Oct. 2007. 23. S.T. King and P.M. Chen, “Backtracking Intrusions”, 19th ACM Symposium on Operating System Principles, Bolton Landing, NY, Oct. 2003. 24. S. Krempel, “Tracing Connections Between MPI Calls and Resulting PVFS2 Disk Operations”, Bachelor’s Thesis, Mar. 2006, Ruprecht-Karls-Universit-at Heidelberg, Germany. 25. L. Lamport, “Time, clocks and the ordering of events in a distributed system”, Commun. of the ACM 21, 7, 1978. 26. J. Li, “Monitoring and Characterization of Component-Based Systems with Global Causality Capture”, HP Labs Tech. Report HPL-2003-54, 2003. 27. B. Liblit, M. Naik, A.X. Zheng, A. Aiken, and M.I. Jordan, “Scalable Statistical Bug Isolation”, ACM SIGPLAN Conference on Programming Language Design and Implementation, Chicago, IL, Jun. 2005. 28. M. Litzkow, M. Livny, and M. Mutka, “Condor–a hunter of idle workstations”, 8th Intl. Conf. on Distributed Computing Systems, San Jose, CA, Jun. 1988. 29. C.K. Luk, R. Cohn, R. Muth, H. Patil, A. Klauser, G. Lowney, S. Wallace, V.J. Reddi, and K. Hazelwood, “Pin: Building Customized Program Analysis Tools with Dynamic Instrumentation”, ACM SIGPLAN Conference on Programming Language Design and Implementation, Chicago, IL, Jun. 2005. 30. J.R. Lyle and M. Weiser, “Automatic Program Bug Location by Program Slicing”, 2nd Intl. Conf. on Computers and Applications, Beijing, China, Jun. 1987. 31. J. Maebe, M. Ronsse, K. De Bosschere, “DIOTA: Dynamic Instrumentation, Optimization and Transformation of Applications”, Workshop on Binary Translation, Charlottesville, VA, Sept. 2002. 32. B.P. Miller, “DPM: A Measurement System for Distributed Programs”, IEEE Trans. on Computers 37, 2, Feb. 1988. 33. A.V. Mirgorodskiy, Ph.D. Thesis, University of Wisconsin–Madison, 2006. 34. A.V. Mirgorodskiy and B.P. Miller, “Autonomous Analysis of Interactive Systems with SelfPropelled Instrumentation”, 12th Multimedia Computing and Networking, San Jose, CA, Jan. 2005. 35. A.V. Mirgorodskiy, N. Maruyama, and B.P. Miller, “Problem Diagnosis in Large-Scale Computing Environments”, SC’06, Tampa, FL, Nov. 2006. 36. N. Nethercote and J. Seward, “Valgrind: A program supervision framework”, 3rd Workshop on Runtime Verification, Boulder, CO, Jul. 2003. 37. J. Reumann and K.G. Shin, “Stateful distributed interposition”, ACM Transactions on Computer Systems 22, 1, Feb. 2004, pp. 1–48. 38. P. Reynolds, C. Killian, J.L. Wiener, J.C. Mogul, M.A. Shah, and A. Vahdat, “Pip: Detecting the Unexpected in Distributed Systems”, 3rd Symposium on Networked Systems Design and Implementation (NSDI), San Jose, CA, May 2006. 39. K. Scott and J. Davidson, “Strata: a software dynamic translation infrastructure”, Workshop on Binary Translation, Barcelona, Sept. 2001. 40. W.R. Stevens, “UNIX Network Programming”, Prentice Hall, vol. 1, 2nd edition, 1998, ISBN 0-13-490012-X. 41. D. Thain, T. Tannenbaum, and M. Livny, “Distributed Computing in Practice: The Condor Experience”, Concurrency and Computation: Practice and Experience 17, 2–4, Feb.– Apr. 2005. 42. E. Thereska, B. Salmon, J. Strunk, M. Wachs, M. Abd-El-Malek, J. Lopez, G.R. Ganger, “Stardust: Tracking Activity in a Distributed Storage System”, International Conf. on Measurement and Modeling of Computer Systems, Saint-Malo, France, Jun. 2006. 43. J. Tucek, S. Lu, C. Huang, S. Xanthos, and Y. Zhou, “Triage: Diagnosing Production Run Failures at the User’s Site”, 21st Symposium on Operating Systems Principles (SOSP), Stevenson, WA, Oct. 2007. 44. C. Yuan, N. Lao, J.-R. Wen, J. Li, Z. Zhang, Y.-M. Wang, W.-Y. Ma, “Automated Known Problem Diagnosis with Event Traces”, EuroSys, Leuven, Belgium, Apr. 2006. 45. V. Zandy, “Force a Process to Load a Library”, http://www.cs.wisc.edu/∼ zandy/p/ hijack.c 46. A. Zeller, “Isolating Cause-Effect Chains from Computer Programs”, Intl. Symposium on the Foundations of Software Engineering, Charleston, SC, Nov. 2002.


![Distributed wisdom: what's wrong with us?[Distributed systems]](https://m.moam.info/img/260x300/distributed-wisdom-whats-wrong-with-usdistributed-_5b7f7d03097c475b2d8b4644.jpg)


