Materials Science Forum Vol. 762 (2013) pp 319-324 © (2013) Trans Tech Publications, Switzerland doi:10.4028/www.scientific.net/MSF.762.319
Die Stress Optimization Using Finite Element and Taguchi Method Rajkumar Ohdar1, a, Md Israr Equbal1, b and Vinod Kumar2, c 1
Department of Forge Technology, National Institute of Foundry and Forge Technology Ranchi834003, India 2
R&D Centre for Iron and Steel, Steel Authority of India Limited Ranchi- 834002, India
a
[email protected],
[email protected],
[email protected]
Keywords: Closed die forging, Die stress, Modeling, Simulation
Abstract. In this study, finite element simulation and the Taguchi method are employed to optimize the die stress in hot closed die forging process. Investigations are carried out for forging of automotive spring saddle by including all realistic process parameters. The research involved analyzing the effects of flash thickness, billet temperature, die temperature and friction coefficient on effective die stress by means of computer simulation. To obtain the result the forging process was modeled in CATIA V5, 3D Solid Modeling Software, simulated in DEFORMTM 3D Software, and statistically setup and examined using Taguchi’s orthogonal array. Analysis of variance (ANOVA) is employed to determine significant parameters. Introduction In forging process, there are various forging parameters with different adjustment levels which may influence the final characteristics of the product. To optimize the forging parameters, the trial and error method is used to identify the best parameters [1]. The quality of the closed die forging depends on several controlling parameters such as die design parameters and process parameters. Design parameters represent the geometrical aspect of the die such as flash thickness, flash land width, fillet radii, corner radii and draft. Process parameter is a variable related to the forging process such as process stage, load applied, shape of the die, preform and lubrication [2]. Nearly all forging companies use computer aided design (CAD), computer aided manufacturing (CAM) and computer aided Engineering (CAE) for die and part design and die manufacturing. Finite Element (FE) based process simulation is also used by a large segment of the forging industry to analyze and optimize the metal flow and conduct die stress analysis before conducting forging trials. Thus, part development time and cost are reduced while quality and productivity are increased. Industrial acceptance of metal forming and die stress process simulation has increased rapidly during recent years. The growth of simulation technology in metal forming industries has come at a time when computer hardware has experienced dramatic price reduction and speed increases. Improved graphical user interfaces in commercial codes have made this technology very easy to use. The ability to analyze complex three-dimensional processes has opened up additional avenues for the application of simulation. Die stress analysis has been shown to be a very cost-effective use of simulation. The cost of the die has been estimated at 5% to 15% of the total cost of manufacturing [3]. In addition, the dies are typically subjected to a severe operating environment due to the high interface pressure over numerous cycles in the manufacture of cold-formed parts. In warm and hot forming, these effects are compounded by extreme temperatures. Die stress analysis is used to determine the stress level on a die during service. More than one stress-state may be significant. The effective die stress is used to understand the magnitude of the stress on the tool. The effective die stress is a numerical quantity used in converting a 3D stress state to 1D data for analysis.
All rights reserved. No part of contents of this paper may be reproduced or transmitted in any form or by any means without the written permission of TTP, www.ttp.net. (ID: 112.133.201.66-22/05/13,14:03:12)
320
Physical and Numerical Simulation of Materials Processing VII
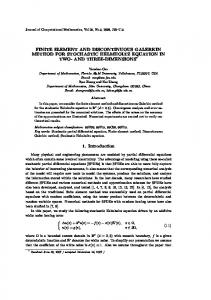
Methodology The objective of this study is to investigate the influence of forging parameters on die stress in order to improve the die life. To achieve this Taguchi experimental method is utilized to design the parameter combinations so as to identify the relative influence of each parameter on the studied response. As the real time forging is time consuming and costly therefore FEM based DEFORMTM 3D software is used for simulating forging process. For simulation purpose 3D (three-dimensional) solid model of spring saddle and its top and bottom die are modelled in CATIA V5 software. Furthermore, a statistical analysis of variance (ANOVA) is performed to find significant factors. Finally, a confirmation experiment is conducted to verify the optimal process parameters obtained from the process parameter design. Modeling in CAD System. 3-D modeling software CATIA V5 is used to model part, billet and dies. CATIA V5 has an option by which volume of the drawn part can be found. So final part is modeled and required material for the part is found. Final part is as shown in Fig. 1.
Fig. 1. 3D CAD model of spring saddle CATIA provides option of boolean operation by which specific shape can be subtracted or added to the other shape. For this part top die and bottom die are modeled by boolean operation. Even though DEFORM allows dies and billets to move in X, Y and Z directions and rotate about X, Y and Z directions it causes lot of problems in positioning, if they are aligned manually. So care must be taken while modeling dies and billet in CATIA V5. The bottom die and the top die are shown in Fig. 2. Dies and billets are drawn in such a manner that they are Z-axis aligned. After construction of the dies, the CATIA V5 files were saved as Stereo Lithography (.stl format) files to be imported into DEFORMTM 3D models which insure accurate integration.
Fig. 2(a). 3D CAD model of Bottom Die Fig. 2(b). 3D CAD model of Top Die
Materials Science Forum Vol. 762
321
The material of Spring Saddle is AISI 1035 alloy steel, whereas Tool Steel DIN 1.2714 is used as die material and their properties are given in Table 1. Table 1. Material Properties Property Units Component Density (x1000 kg/m3) 7.7-8.03 s Poisson’ Ratio 0.27-0.3 Elastic modulus GPa 190-210 Tensile strength MPa 485 Yield strength MPa 415 Hardness HB 143
Die 7.86 0.27-0.3 190-210 655 380 93
Taguchi method. The Taguchi approach enables a comprehensive understanding of the individual and combined effects of various design parameters to be obtained from a minimum number of experimental trials [4]. The aim of the Taguchi design method is to establish the parameter settings which render the product quality robust to unavoidable variations in external noise. It had been extensively used in the engineering design and the analysis of optimal manufacture. The most important stage in this method lies in the selection of control factors. The purpose of this research is to determine the effects caused by varying the forging process input parameters flash thickness, billet temperature, die temperature and friction coefficient on die stress. These parameters each at three levels are considered for the present study as shown in Table 2. The total degree of freedom (DOF) for four factors each at three levels is 8. Therefore L9 orthogonal array is selected for experimental design and is shown in Table 3.
Factors Flash thickness Billet temperature Die temperature Friction coefficient
Table 2. Factors and their values at different levels Unit Symbol Level 1 2 mm FT 2 3 0 C TB 1000 1100 0 C TD 200 250 µ 0.25 0.3
Exp. No. 1 2 3 4 5 6 7 8 9
Table 3. L9 Orthogonal array FT (mm) TB (0C) TD (0C) 2 1000 200 2 1100 250 2 1200 300 3 1000 250 3 1100 300 3 1200 200 4 1000 300 4 1100 200 4 1200 250
3 4 1200 300 0.7
µ 0.25 0.30 0.70 0.70 0.25 0.30 0.30 0.70 0.25
Simulation. The DEFORM™-3D V6.1 software package is employed in the present research for the simulation and analysis of results. DEFORM™-3D V6.1 is a practical and efficient tool to predict the material flow in industrial forming operations without the cost and delay of shop trials [5]. Following are the simulation properties used as given in Table 4.
322
Physical and Numerical Simulation of Materials Processing VII
Table 4. Operation parameters assigned to complete the simulation Forging Equipment Mechanical press Number of elements 45000 Mesh type Tetrahedral Simulation mode Isothermal Die displacement 0.5 mm Primary die Top die Environment Temperature 200C Results and Analysis After conducting all the simulations, the different effective stress has been noted for further analysis and optimization. Based on the experimental layout depicted in Table 3, the response die stress (effective) has been measured. Die stress is measured in Mega pascal (MPa) is depicted in Table 5. Exp. no. 1 2 3 4 5 6 7 8 9
Table 5. Simulation results of Die Stress (effective) FT(mm) TB(0C) TD (0C) µ Die Stress (MPa) 2 1000 200 0.25 1550 2 1100 250 0.30 1160 2 1200 300 0.70 744 3 1000 250 0.70 2100 3 1100 300 0.25 1110 3 1200 200 0.30 565 4 1000 300 0.30 733 4 1100 200 0.70 965 4 1200 250 0.25 362
S/N ratios -63.8066 -61.2892 -57.4315 --66.4444 -60.9065 -55.0410 -57.3021 -59.6905 -51.1742
In Taguchi method, the basic method converts the objective parameters to signal-to-noise (S/N) ratio treated as the quality characteristics evaluation index. The least variation and the optimal design are obtained by means of the S/N ratio. The higher the S/N ratio, the more stable the achievable quality. Usually, there are three categories of quality characteristic in the analysis of the S/N ratio, i.e., the-lower-the-better, the higher-the-better, and the-nominal-the-better characteristics. Die stress in this study is the quality characteristic with the objective ‘‘the lower-the-better”. So the S/N ratio is defined by, (1) where, ηj is S/N ratio for the ith alternative, n is number of replications, yij is observed response value of ith alternative jth replication. Fig. 3 shows the S/N ratio plot for die stress. The optimum parameters combination for Die stress is FT=4mm, TB=12000C, TD=3000C and µ=0.3 corresponding to the largest values of S/N ratio for all control parameters.
Fig. 3. S/N ratio response graph for Die stress
Materials Science Forum Vol. 762
323
Relative influence of each factor is determined by analysis of variance method (ANOVA) and results are presented in Table 6. F- value is the statistic used to test the hypothesis that all the factor level means are equal. It is calculated as the mean square for the factor divided by the mean squares for error. F is used to determine the % contribution. ANOVA depicts that the process parameter namely Flash thickness Billet temperature and Friction coefficient are the most significant parameters affecting the Forging load under 95% confidence level. Table 6. ANOVA Table for forging load Factor DOF SS Variance % contribution F-value Flash Thickness 2 19.859 9.929 17.66 1.76 Billet Temperature 2 63.909 31.955 56.82 5.68 * Die Temperature 11.253 Friction Coefficient 2 17.454 8.727 15.52 1.55 Error 6 11.253 5.625 Total 12 112.475 *pooled, DOF- Degree of freedom, SS- Sum of square, F-value - Fisher-Snedecor value Confirmation simulation. The optimum parameter level for die stress on the basis of main effect plots illustrated in Fig. 3 are FT=4 mm, TB=12000C, TD=3000C and µ=0.3 respectively. The confirmation test at the optimal parameter setting is conducted to evaluate the value of effective die stress. The value of maximum effective die stress obtained from the confirmation experiment is 275 MPa as shown in Fig. 4, which is minimum from all the values as obtained by Taguchi’s experiment. At this value of die stress complete die filling is achieved as shown in Fig. 5. This increases the die life and hence reduces the total cost of forging.
Fig. 4 Effective die Stress distribution in the die showing maximum effective die stress
Fig. 5 Complete die filling
Conclusion The research involved analyzing the effects of parameters viz. flash thickness, billet temperature, die temperature and friction coefficient for the response die stress during forging operation.Three dimensional finite element (FE) analysis along with Taguchi method has been used to simulate the closed die forging process and then performing a series of optimization iterations in order to obtain the optimum level of process parameters. Analysis of variance (ANOVA) is employed to determine significant parameters. Flash thickness, billet temperature and friction coefficient observed as the most significant parameters affecting the response. Optimization of the process parameters leading to a lower effective die stress and it is also verified through a confirmation experiment for the validation of the results.
324
Physical and Numerical Simulation of Materials Processing VII
References [1]
A.R. Ab Kadir, A.R. Othman, Z. Samad, K. Hussain, M.T. Abdullah and A.B. Abdullah: J. Appl. Sci. Vol. 7 (2007), p. 777-784.
[2] M. Sedighi and S. Tokmechi: J. Mater. Process. Techn. Vol. 197 (2008), p. 314–324. [3] J.H. Liou and D.Y. Jang: Intern. J. Mach. Tools Manufact. Vol. 37 (1997), p. 775-782. [4] P.G. Stuart: Taguchi methods: a Hand on Approach, Addison Wesley, New York (1993). [5] S.I. Oh, W. T. Wu, J.P. Tang and A. Vedharayagam: J. Mater. Process. Techn. Vol. 27 (1991), p. 25-42.