BJR Received: 7 June 2016
© 2016 The Authors. Published by the British Institute of Radiology Revised: 15 July 2016
Accepted: 25 July 2016
http://dx.doi.org/10.1259/bjr.20160509
Cite this article as: Kartamihardja AAP, Nakajima T, Kameo S, Koyama H, Tsushima Y. Distribution and clearance of retained gadolinium in the brain: differences between linear and macrocyclic gadolinium based contrast agents in a mouse model. Br J Radiol 2016; 89: 20160509.
FULL PAPER
Distribution and clearance of retained gadolinium in the brain: differences between linear and macrocyclic gadolinium based contrast agents in a mouse model 1,2
A ADHIPATRIA P KARTAMIHARDJA, MD, 1TAKAHITO NAKAJIMA, MD, PhD, 3SATOMI KAMEO, PhD, HIROSHI KOYAMA, MD, PhD and 1,4YOSHITO TSUSHIMA, MD, PhD
3 1
Department of Diagnostic Radiology and Nuclear Medicine, Gunma University Graduate School of Medicine, Maebashi, Japan Nuclear Medicine and Molecular Imaging Department, Universitas Padjadjaran, Bandung, Indonesia 3 Department of Public Health, Gunma University Graduate School of Medicine, Maebashi, Japan 4 Research Program for Diagnostic and Molecular Imaging, Division of Integrated Oncology Research, Gunma University Initiative for Advanced Research (GIAR), Maebashi, Japan 2
Address correspondence to: Mr Achmad Adhipatria Perayabangsa Kartamihardja E-mail:
[email protected]
Objective: To investigate the distribution and clearance of retained gadolinium (Gd) in various parts of the brain after intravenously administering a Gd-based contrast agent (GBCA) in normal and renal failure mouse models. Methods: Two different mouse models: normal (n 5 12) and renal failure (n 5 12) were used. Clinical GBCAs (GdDTPA-BMA, 5 mmol kg21, or Gd-DOTA, 5 mmol kg21) were intravenously administered five times per week for 4 weeks. Both groups were divided into two subgroups based on the time point for sample collection: 3 days (3d) and 45 days (45d) after the last injection. Normal saline (5 ml kg21) was intravenously administered to mice of the control groups in the same manner. Samples of the following parts of the mouse brain were obtained on dissection: olfactory bulb, cerebral cortex, hippocampus, thalamus, mid-brain, cerebellum, pons and medulla. 158Gd concentrations in each sample were quantified using inductively coupled plasma mass spectrometry. Results: The olfactory bulb had the highest Gd concentration in both Gd-DTPA-BMA and Gd-DOTA
groups. Gd retention was higher in the Gd-DTPABMA group than in the Gd-DOTA group (p , 0.01). In the Gd-DTPA-BMA group, Gd retention in the 3d subgroups of normal and renal failure models were similar (p 5 0.4). At 45d, Gd in the Gd-DTPA-BMA group was not eliminated from the renal failure model (p 5 0.1), while that in the Gd-DOTA group was eliminated from both the normal and renal failure mouse models (p , 0.01). Conclusion: Gd distributions in the brain for both groups were similar, regardless of the renal function and GBCA type. The Gd concentration was highest in the olfactory bulb of both groups. In the Gd-DOTA group, Gd was eliminated from the brain in both mouse models, while in the Gd-DTPA-BMA group, Gd clearance was limited. Advances in knowledge: Gd concentration in the brain was not affected by renal function. The clearance of Gd from linear GBCA was limited in both the normal and impaired renal function mouse models.
INTRODUCTION Gadolinium-based contrast agents (GBCAs) are widely used to increase the diagnostic yield of MRI because of their low acute adverse reaction rates and rapid clearance from the body.1,2 In the field of neuroradiology, GBCAs are particularly useful for detecting aggressive or metastatic brain tumours and vascular lesions.3,4 However, recent studies demonstrated gadolinium (Gd) retention in the brain after multiple GBCA administrations.5–9
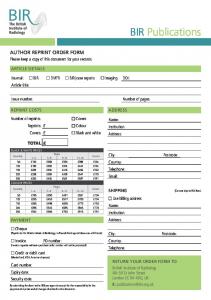
the chelate that determines the stability of GBCAs (Figure 1). Linear GBCAs have higher dissociation rates than macrocyclic GBCAs; the resulting free Gd may bind to endogenous molecules such as phosphate, carbonate or macromolecules, leading to Gd retention in various tissues.10,11 In the unchelated form, Gd is highly toxic and may cause splenic and lung degeneration or liver necrosis.
GBCAs are generally divided into two groups: linear GBCAs and macrocyclic GBCAs, based on the chemical structures of
Under normal conditions, the blood–brain barrier (BBB) and blood–cerebrospinal fluid barrier (BCSFB) prevent the uptake of intravenously administered GBCAs by the brain.12 BBB is the endothelial tight junctions of the brain
BJR
Kartamihardja et al
Figure 1. Chelate structures of gadolinium (Gd)-DTPA-BMA (linear) and Gd-DOTA (macrocyclic). Gd-DTPA-BMA has a lower stability constant than Gd-DOTA. log Kcond, conditional stability constant at pH 7.4; MW, molecular weight.
coagulated. Electrocoagulated lesions were 2-mm apart and 1-mm deep, surrounded by blanched areas to cover the majority of the kidney. The treated kidney was replaced in the retroperitoneal cavity and the wound was carefully closed with continuous over-and-over sutures. After a 10-day recovery period, the left kidney was similarly treated. Renal failure was confirmed by measuring the blood urea nitrogen (BUN) level using a commercially available kit (Wako Pure Chemical Industries, Ltd, Osaka, Japan). The criterion for renal impairment was BUN level of $30 mg dl21.16 All mice were housed in an approved animal facility at room temperature (27–28 °C) with ad libitum access to food and water.
vessels,13 while BCSFB is the epithelial cells and their tight junctions.12–14 These structures serve as protective barriers and regulate the transport of various molecules by membrane transporters and vesicle membranes.13–15 However, renal impairment may delay GBCA clearance,8,16 affect homeostasis and also disrupt BBB or BCSFB function,17 leading to Gd retention in the brain. Although the Gd pathway to the brain remains unknown, the use of linear chelate GBCA in patients with a renal impairment is associated with an increased signal intensity of the dentate nucleus and globus pallidus on T1 weighted images.5–7,18 This study aimed to investigate the distribution and clearance of Gd in various parts of the brain after intravenously administering GBCA in normal and renal failure mouse models. METHODS AND MATERIALS Animals All study protocols were approved by the institutional animal care and use committee at Gunma University. 30 female ddY mice (6–7 weeks old; mean weight, 25.2 6 0.7 g) were purchased from Japan SLC, Inc. (Tokyo, Japan). 12 normal mice were randomly divided into 2 groups to intravenously receive either Gd-DTPABMA (n 5 6) or Gd-DOTA (n 5 6). 12 renal failure mice were divided into 2 groups and treated in a similar manner. Each group was then randomly divided into two subgroups based on the time point for sample collection: 3 days (3d) and 45 days (45d) after the final injection. Three normal mice and three renal failure mice were intravenously administered saline and served as controls. Renal failure mouse models were established using a modified version of the method described by Gagnon and Duguid.19 Mice were anaesthetized using 2% inhaled isoflurane supplemented with 2 ml min21 of air and placed on a heating pad to maintain body temperature. A 2-cm incision was made along the lumbar spine on the right side and the surrounding tissues were carefully dissected to expose the right kidney. Electrocoagulation of the kidney was then carefully performed using a portable Gemini Cautery System (Braintree Scientific, Inc., Braintree, MA), ensuring that all lesions were properly
2 of 6
birpublications.org/bjr
Gd-based contrast agents and treatment protocol Two GBCAs were used in this study: the linear GBCA [OMNISCAN (Gd-DTPA-BMA), 0.5 mol l21; Daiichi-Sankyo Co. Ltd, Tokyo, Japan] and the macrocyclic GBCA [MAGNESCOPE (Gd-DOTA), 0.5 mol l21; Terumo Co., Tokyo, Japan]. Magnescope is internationally known as DOTAREM. Each contrast agent was intravenously administered via the tail vein every weekday for 4 weeks at a dose of 5 mmol kg21; mice in the control group were intravenously administered 5 ml kg21 of saline. Sample collection Brain samples were collected on either 3d or 45d after the final GBCA injection. Mice were euthanized by cervical dislocation. The heart was exposed and freed from the surrounding connective tissue; transcardial perfusion was performed to remove excess blood from the brain. After brain extraction, the surrounding tissues were carefully removed and the brain kept in ice-cold phosphate-buffered saline (PBS) for 5 min. Subsequently, the brain was dissected and samples of the olfactory bulb, cerebral cortex, hippocampus, thalamus, mid-brain, cerebellum, pons and medulla were collected. The brain was kept immersed in ice-cold PBS during dissection to prevent liquefaction. Gd concentration analysis by inductively coupled plasma mass spectrometry Each sample was weighed, sealed in a perfluoroalkoxy vial along with 500 ml of nitric acid and 100 ml of hydrogen peroxide and subjected to digestion with specific eight sequences of microwave program for 125 min (Milestone MLS 1200 Mega; Milestone Inc., Shelton, CT). The samples were transferred to a polypropylene tube, and ultrapurified water was added to each sample to obtain a total volume of 10 ml. Finally, the accumulation of the stable Gd isotope (158Gd) in each sample was measured using the inductively coupled plasma mass spectrometry system ELAN® DRC II (PerkinElmer Inc., Waltham, MA). Statistical analysis All data are expressed as mean 6 standard deviation. Gd concentrations in different parts of the brain of mice treated with the two types of GBCAs and disaggregated by the time point of sample collection were assessed using analysis of variance, followed by post hoc Tukey’s honest significant difference test. Between-group differences with respect to the average Gd
Br J Radiol;89:20160509
Full paper: Distribution and clearance of gadolinium in the brain of a mouse model
BJR
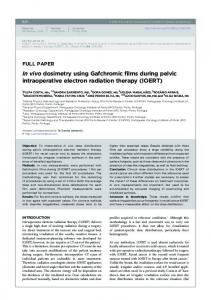
Figure 2. Gadolinium (Gd) retention in the brain of normal mice: Gd retention in both Gd-DTPA-BMA (linear) and Gd-DOTA (macrocyclic) groups was largely observed in the olfactory bulb (p , 0.01). (a) Significant difference in Gd concentration was found only in the olfactory bulb (p , 0.01). (b) Significant clearance of Gd concentration was noticeable from all areas of the brain (p , 0.01).
concentration of GBCAs were assessed using the t-test. The SPSS® software v. 23 (IBM Corp., New York, NY; formerly SPSS Inc., Chicago, IL) was used for data analyses. A p-value of ,0.05 was considered to be statistically significant. RESULTS BUN levels in all electrocoagulated mice were .30 mg dl21. Quantification of the inductively coupled plasma mass spectrometry analysis was performed using a linear regression graph of four different concentrations of a standard Gd solution (0, 25, 50 and 100 mg g21) and were verified in concentrations of up to 100 mg g21 (R 5 0.99). The limit of quantification was determined to be 0.006 mg g21, while the limit of detection was determined to be 0.0005 mg g21. In the Gd-DTPA-BMA group, the average Gd concentration in the brain at 3d was similar between normal mice (4.78 6 1.60 mg g21) and mice with renal failure (3.87 6 1.30 mg g21, p 5 0.07). In the Gd-DOTA group, the average Gd concentration at 3d was significantly higher in the normal mice (1.30 6 0.10 mg g21) than in mice with renal failure (0.56 6 0.10 mg g21; p , 0.01). The average Gd concentration was significantly higher in the Gd-DTPA-BMA group than in the Gd-DOTA group at both 3d and 45d (p , 0.01). Although the Gd concentration in both groups were significantly different, all mice injected with GBCA (Figures 2 and 3) showed similar Gd distribution (p 5 0.12). The
Gd concentration was highest in the olfactory bulb (p , 0.01), but no significant difference in Gd concentration was found in other areas of the brain. In normal mice (Table 1), the Gd concentration in the olfactory bulb of the Gd-DTPA-BMA group was significantly lower at 45d (5.95 6 0.60 mg g21) than at 3d (11.26 6 3.60 mg g21; p , 0.01) (Figure 2a); no significant difference was observed in this respect in other parts of the brain. In contrast, the Gd concentration of the Gd-DOTA group was significantly lower at 45d than at 3d (p , 0.01) (Figure 2b) in all areas of the brain, which indicates that Gd from Gd-DOTA was eventually eliminated from the brain of normal mice. In renal failure mice (Table 2), Gd concentrations in the GdDTPA-BMA group at 3d showed no significant difference compared with those at 45d (p 5 0.10) (Figure 3a), while Gd concentrations in the Gd-DOTA group were significantly lower at 45d than at 3d in all areas of the brain (p , 0.01) (Figure 3b). DISCUSSION In this study, the retained Gd distribution was not affected by renal function or by the GBCA type. Nevertheless, the Gd concentration in the brain was generally higher in the GdDTPA-BMA group than in the Gd-DOTA group. The olfactory bulb had the highest Gd concentration in both groups. Although renal impairment did not affect retention at 3d, it did impede Gd clearance from the brain of mice administered Gd-DTPABMA. Under both normal and renal impaired conditions, Gd
Figure 3. Gadolinium (Gd) retention in brains of renal failure mice: similar to that observed in normal mice, Gd retention in both GdDTPA-BMA (linear) and Gd-DOTA (macrocyclic) groups was largely observed in the olfactory bulb. (a) There was no difference in Gd concentration after 45 days, indicating Gd isolation in the brains of mice injected with Gd-DTPA-BMA. (b) Under renal failure conditions, Gd-DOTA clearance after 45 days was found to be significant.
3 of 6
birpublications.org/bjr
Br J Radiol;89:20160509
BJR
Kartamihardja et al
Table 1. Total gadolinium (Gd) concentration in the normal mice following administrations of Gd-based contrast agent
3 days Organs
45 days
Gd-DTPA-BMA (n 5 3, mg g21)
Gd-DOTA (n 5 3, mg g21)
Gd-DTPA-BMA (n 5 3, mg g21)
Gd-DOTA (n 5 3, mg g21)
Olfactory bulb
11.2 6 3.5
3.8 6 0.2
5.9 6 0.6
0.4 6 0.1
Cerebral Cortex
4.5 6 1.9
1.1 6 0.1
1.6 6 0.4
0.1 6 0.04
Hippocampus
3.6 6 1.4
1.1 6 0.1
1.2 6 0.2
0.08 6 0.01
Thalamus
4.4 6 1.3
0.8 6 0.1
2.9 6 0.6
0.09 6 0.02
Mid-brain
3.0 6 1.2
0.6 6 0.07
1.9 6 0.3
0.06 6 0.02
Cerebellum
4.5 6 1.2
1.0 6 0.1
3.0 6 0.6
0.08 6 0.02
Pons
3.7 6 1.5
0.7 6 0.1
1.9 6 0.3
0.09 6 0.04
Medulla
3.1 6 0.6
1.0 6 0.1
1.7 6 0.5
0.1 6 0.01
SD, standard deviation. Each value represents mean 6 SD of 3 mice. Values are expressed as a total Gd dose per gram of organ (mg g21).
was eliminated from the brains of mice administered Gd-DOTA, albeit incompletely, under renal failure conditions.
making its transportation into the brain less susceptible to the effect of renal failure.
The Gd retention in normal neuronal tissues in the presence of an intact BBB challenges our current understanding of the biodistribution of GBCAs in the brain. We expected the brain of renal failure mice to be more vulnerable to Gd exposure because of hypertension.20,21 However, we found no significant difference in the Gd concentration in the Gd-DTPA-BMA group between normal mice and mice with renal failure, while the Gd retention at 3d in the Gd-DOTA group was higher in normal mice than in mice with renal failure.
The higher Gd concentration in the Gd-DTPA-BMA group than in the Gd-DOTA group suggests that chelate stability also plays an important role in Gd retention in the brain. The high dissociation rate and low stability of Gd-DTPA-BMA11,22 may explain the greater total Gd concentrations in the brain. We suspected that the Gd dissociated from Gd-DTPA-BMA forms a specific complex, facilitating its transport across BBB or BCSFB and into the brain. Because Gd31 is a potent calcium antagonist owing to its ionic radius being similar to that of calcium (Ca21)23,24 and its ability to bind with macromolecules (e.g. transferrin)25,26 or endogenous molecules (e.g. phosphate and carbonate),27 Gd may be transported into the brain via the choroid plexus (BCSFB) by some specific transporter and then secreted into the cerebrospinal fluid (CSF). Iliff et al28 reported that after injection into the subarachnoid space of the cisterna magna in mice, GBCAs followed a specific paravascular pathway
Renal failure affects the expression and activity of drug transporters, including in the brain.17 This may explain the higher Gd concentration in normal mice than in renal failure mice in the Gd-DOTA group, while renal failure did not affect Gd clearance from the brain. In contrast, Gd-DTPA-BMA is less stable10 and may form another complex to be transported into the brain,
Table 2. Total gadolinium (Gd) concentration in the renal failure mice following administrations of Gd-based contrast agents
3 days Organs
45 days
Gd-DTPA-BMA (n 5 3, mg g21)
Gd-DOTA (n 5 3, mg g21)
Gd-DTPA-BMA (n 5 3, mg g21)
Gd-DOTA (n 5 3, mg g21)
9.7 6 3.5
1.0 6 0.2
9.5 6 2.2
0.3 6 0.06
Olfactory bulb Cerebral Cortex
2.6 6 1.4
0.5 6 0.1
2.9 6 1.5
0.1 6 0.02
Hippocampus
2.4 6 0.9
0.5 6 0.1
1.6 6 0.2
0.09 6 0.02
Thalamus
4.0 6 1.4
0.5 6 0.1
3.1 6 0.5
0.1 6 0.02
Mid-brain
2.6 6 0.7
0.4 6 0.1
2.6 6 0.7
0.1 6 0.01
Cerebellum
4.2 6 1.9
0.5 6 0.2
3.7 6 1.1
0.1 6 0.02
Pons
2.2 6 0.3
0.4 6 0.1
2.4 6 0.9
0.06 6 0.01
Medulla
2.9 6 0.3
0.6 6 0.1
2.8 6 1.1
0.05 6 0.01
SD, standard deviation. Each value represents mean 6 SD of 3 mice. Values are expressed as a total Gd dose per gram of organ (mg g21).
4 of 6 birpublications.org/bjr
Br J Radiol;89:20160509
Full paper: Distribution and clearance of gadolinium in the brain of a mouse model
BJR
from the basal artery to the olfactory artery and entered the brain parenchyma through interstitial exchange, particularly in the olfactory bulb and cerebellum. The drainage of CSF from the subarachnoid space through the olfactory nerves and into the nasal lymphatic system has also been discussed.29 Neural cells exclusively generated in the subventricular zone of adult mammalian brains migrate to the olfactory bulb via the rostral migration stream.30,31 The Gd retained in the brain may intracellularly reside and be transported along with the neural cells. Therefore, high Gd concentrations in the olfactory bulb may be linked to CSF circulation and rostral migration stream in the brain.
possible to determine whether the retained Gd was chelated Gd, free Gd or some other Gd complex(es). Furthermore, the meningeal and arterial vasculature lining the dorsal and ventral aspects of the brain was not separated, which may have interfered with Gd concentrations in some areas of the brain. Second, because CSF sampling requires a special technique, we could not determine whether Gd was secreted in CSF by the choroid plexus (BCSFB). Third, it was not possible to determine the structure of retained Gd in the brain because the sample analysis process included the nitric acid digestion protocol.
The use of linear GBCAs is associated with hyperintense dentate nucleus and globus pallidus on T1 weighted MRI,5,6,18,32 while no such effect is observed with the use of macrocyclic GBCAs.33–35 Although the Gd effect on neuronal tissues remains unclear, a higher Gd concentration may mean more adverse effects. Our results revealed lower Gd retention in all assessed areas of the brain in the Gd-DOTA group than in the Gd-DTPABMA group. In addition, our findings are also consistent with the retrospective patient studies that showed hyperintense deep cerebellar nuclei only after the injection of linear GBCAs.
CONCLUSION In conclusion, Gd was completely eliminated under normal conditions and albeit completely eliminated under renal failure conditions for Gd-DOTA, while a significant amount of GdDTPA-BMA remained in all assessed parts of the brain under normal and renal failure conditions. The Gd distribution did not differ between the linear and macrocyclic chelate GBCAs, although a higher Gd concentration in the brain was observed in the linear chelate GBCA group. The retained Gd was concentrated in the olfactory bulb, which supports the hypothesis that Gd enters the brain via CSF.
The renal failure model reduced the capability of mouse kidneys to eliminate Gd from the brain. Although this did not affect Gd accumulation in the mouse model of renal failure, it does not rule out the possibility of Gd accumulation in the brain in humans with impaired renal function. This study has some limitations. First, the organ sample processing included nitric acid digestion; therefore, it was not
ACKNOWLEDGMENTS We would like to express our gratitude to Ayako Takahashi, MD, PhD (Radiology Diagnostic and Nuclear Medicine Department, Gunma University Hospital), for reviewing the article. We also thank the staff and members of the Department of Radiology Diagnostic and Nuclear Medicine, Gunma University Graduate School of Medicine, Japan, for the support during the study.
REFERENCES 1.
2.
3.
4.
5.
Runge VM. Safety of the gadolinium-based contrast agents for magnetic resonance imaging, focusing in part on their accumulation in the brain and especially the dentate nucleus. Invest Radiol 2016; 51: 273–9. doi: http://dx.doi.org/10.1097/ RLI.0000000000000273 Silvio A, Peter C. Biodistribution of gadolinium-based contrast agents, including gadolinium deposition. J Magn Reson Imaging 2009; 30: 1259–67. Carr D, Brown J, Bydder G, Weinmann HJ, Speck U, Thomas D, et al. Intravenous chelated gadolinium as a contrast agent in NMR imaging of cerebral tumours. Lancet 1984; 323: 484–6. doi: http://dx.doi.org/ 10.1016/S0140-6736(84)92852-6 Tali ET, Ercan NI, Krumina G, Zeng QY. Intrathecal gadolinium (gadopentetate dimeglumine) enhanced magnetic resonance myelography and cisternography. Invest Radiol 2002; 37: 152–9. Kanda T, Ishii K, Kawaguchi H, Kitajima K, Takenaka D. High signal intensity in the
5 of 6
birpublications.org/bjr
6.
7.
dentate nucleus and globus pallidus on unenhanced T1-weighted MR images: relationship with increasing cumulative dose of a gadolinium- based contrast material. Radiology 2014; 270: 834–41. doi: http://dx.doi. org/10.1148/radiol.13131669 Quattrocchi CC, Mallio CA, Errante Y, Cirimele V, Carideo L, Ax A, et al. Gadodiamide and dentate nucleus T1 hyperintensity in patients with meningioma evaluated by multiple follow-up contrast-enhanced magnetic resonance examinations with no systemic interval therapy. Invest Radiol 2015; 50: 470–2. doi: http://dx.doi.org/10.1097/ RLI.0000000000000154 Robert P, Lehericy S, Grand S, Violas X, Fretellier N, Id´ee JM, et al. T1-weighted hypersignal in the deep cerebellar nuclei after repeated administrations of gadolinium-based contrast agents in healthy rats: difference between linear and macrocyclic agents. Invest Radiol 2015; 50: 473–80. doi: http://dx.doi.org/10.1097/ RLI.0000000000000181
8.
Kartamihardja AA, Takahito N, Satomi K, Hiroshi K, Yoshito T. Impact of impaired renal function on gadolinium retention after administration of gadolinium-based contrast agents in a mouse model. Invest Radiol 2016; 51: 1–6. doi: http://dx.doi.org/10.1097/ RLI.0000000000000295 9. Murata N, Gonzalez-Cuyar LF, Murata K, Fligner C, Dills R, Hippe D, et al. Macrocyclic and other non-group 1 gadolinium contrast agents deposit low levels of gadolinium in brain and bone tissue. Invest Radiol 2016; 51: 447–53. doi: http://dx.doi.org/10.1097/ RLI.0000000000000252 10. Frenzel T, Lengsfeld P, Schirmer H, H¨utter J, Weinmann HJ. Stability of gadolinium-based magnetic resonance imaging contrast agents in human serum at 37 degrees C. Invest Radiol 2008; 43: 817–28. doi: http://dx.doi. org/10.1097/RLI.0b013e3181852171 11. Bleavins K, Perone P, Naik M, Rehman M, Aslam N, Dame MK, et al. Stimulation of fibroblast proliferation by insoluble gadolinium salt. Biol Trace Elem Res 2013; 145:
Br J Radiol;89:20160509
BJR
12.
13.
14.
15.
16.
17.
18.
19.
20.
257–67. doi: http://dx.doi.org/10.1007/ s12011-011-9176-9 Laterra J, Keep R, Betz LA, Goldstein GW. Basic neurochemistry: molecular, cellular and medical aspects. In: Siegel A, Agranoff B, Albers S, eds. Basic neurochemistry: molecular, cellular and medical aspects. 6th edn. Philadelphia, PA: Lippincott-Raven; 1999. Ballabh P, Braun A, Nedergaard M. The blood-brain barrier: an overview: structure, regulation, and clinical implications. Neurobiol Dis 2004; 16: 1–13. doi: http://dx.doi.org/ 10.1016/j.nbd.2003.12.016 de Vries HE, Kuiper J, de Boer AG, Van Berkel TJ, Breimer DD. The blood-brain barrier in neuroinflammatory diseases. Pharmacol Rev 1997; 49: 143–56. Abbott NJ, Patabendige AA, Dolman DE, Yusof SR, Begley DJ. Structure and function of the blood-brain barrier. Neurobiol Dis 2010; 37: 13–25. doi: http://dx.doi.org/ 10.1016/j.nbd.2009.07.030 Schuhmann-Giampieri G, Krestin G. Pharmacokinetics of Gd-DTPA in patients with chronic renal failure. Invest Radiol 1991; 26: 975–9. doi: http://dx.doi.org/10.1097/ 00004424-199111000-00009 Naud J, Michaud J, Beauchemin S, H´ebert MJ, Roger M, Lefrancois S, et al. Effects of chronic renal failure on brain drug transporters in rats. Drug Metab Dispos 2011; 39: 1363–9. doi: http://dx.doi.org/10.1124/ dmd.111.039115 Errante Y, Cirimele V, Mallio CA, Di Lazzaro V, Zobel BB, Quattrocchi CC. Progressive increase of T1 signal intensity of the dentate nucleus on unenhanced magnetic resonance images is associated with cumulative doses of intravenously administered gadodiamide in patients with normal renal function, suggesting dechelation. Invest Radiol 2014; 49: 685–90. doi: http://dx.doi.org/10.1097/ RLI.0000000000000072 Gagnon RF, Duguid WP. A reproducible model for chronic renal failure in the mouse. Urol Res 1983; 11: 11–14. doi: http://dx.doi. org/10.1007/BF00272702 Ito U, Ohno K, Yamaguchi T, Takei H, Tomita H, Inaba Y. Effect of hypertension on
6 of 6 birpublications.org/bjr
Kartamihardja et al
21.
22.
23.
24.
25.
26.
27.
28.
blood-brain barrier. Change after restoration of blood flow in post-ischemic gerbil brains. An electronmicroscopic study. Stroke 1980; 11: 606–11. doi: http://dx.doi.org/10.1161/ 01.STR.11.6.606 Bolwig TG, Hertz MM, Westergaard E. Acute hypertension causing blood-brain barrier breakdown during epileptic seizures. Acta Neurol Scand 2009; 56: 335–42. doi: http:// dx.doi.org/10.1111/j.1600-0404.1977. tb01440.x Perazella MA. Gadolinium-contrast toxicity in patients with kidney disease: nephrotoxicity and nephrogenic systemic fibrosis. Curr Drug Saf 2008; 3: 67–75. doi: http://dx.doi. org/10.2174/157488608783333989 Roland CR, Naziruddin B, Mohanakumar T, Flye MW. Gadolinium blocks rat Kupffer cell calcium channels: relevance to calciumdependent prostaglandin E2 synthesis and septic mortality. Hepatology 1999; 29: 756–65. doi: http://dx.doi.org/10.1002/ hep.510290345 Bourne GW, Trifaro´ JM. The gadolinium ion: a potent blocker of calcium channels and catecholamine release from cultured chromaffin cells. Neuroscience 1982; 7: 1615–22. doi: http://dx.doi.org/10.1016/0306-4522(82) 90019-7 Korkusuz H, Ulbrich K, Welzel K, Koeberle V, Watcharin W, Bahr U, et al. Transferrincoated gadolinium nanoparticles as MRI contrast agent. Mol Imaging Biol 2013; 15: 148–54. doi: http://dx.doi.org/10.1007/ s11307-012-0579-6 Brunetti A, Blasberg RG, Finn RD, Larson SM. Gallium-transferrin as a macromolecular tracer of vascular permeability. Int J Rad Appl Instrum B 1988; 15: 665–72. doi: http://dx.doi.org/10.1016/0883-2897(88) 90059-1 Morcos SK. Extracellular gadolinium contrast agents: differences in stability. Eur J Radiol 2008; 66: 175–9. doi: http://dx.doi.org/ 10.1016/j.ejrad.2008.01.025 Iliff JJ, Lee H, Yu M, Feng T, Logan J, Nedergaard M, et al. Technical advance brain-wide pathway for waste clearance captured by contrast-enhanced MRI. J Clin
29.
30.
31.
32.
33.
34.
35.
Invest 2013; 123: 1299–309. doi: http://dx. doi.org/10.1172/JCI67677 Walter BA, Valera VA, Takahashi S, Ushiki T. The olfactory route for cerebrospinal fluid drainage into the peripheral lymphatic system. Neuropathol Appl Neurobiol 2006; 32: 388–96. doi: http://dx.doi.org/10.1111/ j.1365-2990.2006.00737.x Curtis MA, Faull RL, Eriksson PS. The effect of neurodegenerative diseases on the subventricular zone. Nat Rev Neurosci 2007; 8: 712–23. doi: http://dx.doi.org/10.1038/ nrn2216 Pencea V, Bingaman KD, Freedman LJ, Luskin MB. Neurogenesis in the subventricular zone and rostral migratory stream of the neonatal and adult primate forebrain. Exp Neurol 2001; 172: 1–16. doi: http://dx.doi. org/10.1006/exnr.2001.7768 Robert P, Violas X, Grand S, Lehericy S, Id´ee JM, Ballet S, et al. Linear gadolinium-based contrast agents are associated with brain gadolinium retention in healthy rats. Invest Radiol 2016; 51: 73–82. doi: http://dx.doi. org/10.1097/RLI.0000000000000241 Radbruch A, Weberling LD, Kieslich PJ, Eidel O, Burth S, Kickingereder P, et al. Gadolinium retention in the dentate nucleus and globus pallidus is dependent on the class of contrast agent. Radiology 2015; 275: 783–91. doi: http://dx.doi.org/10.1148/ radiol.2015150337 Radbruch A, Weberling LD, Kieslich PJ, Eidel O, Burth S, Kickingereder P, et al. Gadolinium retention in the dentate nucleus and globus pallidus is dependent on the class of contrast agent evaluation of the macrocyclic gadolinium-based contrast agent gadobutrol. Invest Radiol 2015; 50: 805. doi: http://dx.doi.org/10.1097/ RLI.0000000000000227 Kanda T, Osawa M, Oba H, Toyoda K, Kotoku J, Haruyama T, et al. High signal intensity in dentate nucleus on unenhanced T1-weighted MR images: association with linear versus macrocyclic gadolinium chelate administration. Radiology 2015; 275: 803–9. doi: http://dx.doi.org/10.1148/ radiol.14140364
Br J Radiol;89:20160509