were graded as negative, +, ++, and +++ for p53, p21, p27,. C-MYC, PTEN, and ..... negative for c-myc. D, High grade serous carcinoma with p53-expression.
ORIGINAL STUDY
Differences in Clinical and Biological Features Between Type I and Type II Tumors in FIGO Stages I-II Epithelial Ovarian Carcinoma Ingiridur Skirnisdottir, MD, PhD,* Tomas Seidal, MD, PhD,Þ and Helena A˚kerud, MD, PhD*
Objective: The objective of this study was to compare immunohistochemical profile for the apoptosis regulators p53, C-MYC, bax, PUMA, and PTEN and the cell cycle regulatory proteins p21 and p27, as well as clinical factors between types I and II tumors. Methods: In total, 131 patients in FIGO (International Federation of Gynecology and Obstetrics) stages I-II were divided into 2 groups of patients after type I tumors (n = 79) and type II tumors (n = 52). Differences in the immunohistochemical profile for the cell cycleYrelated proteins, detected by tissue microarrays and immune-histochemistry, were compared. For statistical tests, the Pearson W2 test and the logistic regression model were used. All tests were 2-sided, and the level of statistical significance was P e 0.05. Results: In multivariate logistic regression analysis with recurrent disease as endpoint, FIGO stage (odds ratio [OR], 4.7), type I/II tumors (OR, 3.8), body mass index (BMI) (OR, 3.5), and p53 status (OR, 4.2) all were found to be independent predictive factors. In 2 different multivariate logistic regression analyses with type I/II tumors as endpoint, both p53+p21j (OR, 2.9) and p27 status (OR, 3.0) were associated with type II tumors. Differently, C-MYC status (OR, 0.4) was associated with type I tumors. Furthermore, age (OR, 1.04), BMI (OR, 0.4), and recurrent disease (OR, 4.3) all were associated to type II tumors. In survival analysis, there was a trend (P = 0.054) toward better disease-free survival for patients with type I tumors. Conclusions: Concomitant positivity for p53 and negativity for p21, positivity for p27, and negativity for C-MYC in an epithelial ovarian tumor might strengthen the diagnostic option of type II tumor ovarian carcinoma. Patients with type II tumors were older, had lower BMI, and had more often recurrent disease than patients with type I tumors. Key Words: Concomitant p53+p21j, FIGO stage I-II, Ovarian cancer; p27, Type I/II tumors Received February 3, 2015, and in revised form March 18, 2015. Accepted for publication April 1, 2015. (Int J Gynecol Cancer 2015;25: 1239Y1247)
ovarian cancer (EOC) is still the leading cause of E pithelial death among women with gynaecological malignancies.
Based on histopathology and molecular genetic alterations, ovarian carcinomas are divided into 5 main histological
From the *Department of Women’s and Children’s Health, Uppsala University, Uppsala; and the †Department of Pathology, Halmstad Medical Center Hospital, Halmstad, Sweden. Address correspondence and reprint requests to Ingiridur Skirnisdottir, MD, PhD, Department of Women’s and Children’s Health, Uppsala University, SE-751 85 Uppsala, Sweden. Copyright * 2015 by IGCS and ESGO ISSN: 1048-891X DOI: 10.1097/IGC.0000000000000484
E-mail: ingiridur.skirnisdottir@ kbh.uu.se. No funding was received for this work.
1
International Journal of Gynecological Cancer
The authors declare no conflicts of interest. This is an open-access article distributed under the terms of the Creative Commons Attribution-NonCommercial-NoDerivatives 3.0 License, where it is permissible to download and share the work provided it is properly cited. The work cannot be changed in any way or used commercially.
& Volume 25, Number 7, September 2015
1239
Skirnisdottir et al
International Journal of Gynecological Cancer
types.2 Furthermore, on the basis of morphologic and molecular genetic studies, the 5 types of ovarian cancer can be classified into 2 groups designated types I and II tumors. Thus, type I tumors are composed of low-grade serous (grade 1), low-grade endometrioid (grade 1 or 2), mucinous, and clear cell carcinomas. Type II tumors consist of high-grade serous (grade 2 or grade 3) and high-grade endometrioid (grade 3).3,4 Type I tumors often present in early stage and are slowly growing from benign cystic neoplasm through borderline tumor. They are relatively stable genetically and rarely harbor TP53 mutations with exception of concomitant KRAS mutations in low-grade mucinous tumors.5 In contrast, type II tumors are rapidly growing and more often present in advanced stage. They are genetically highly unstable and have a high frequency of TP53 mutations. There is mounting evidence that types I and II ovarian tumors develop along different molecular pathways.4,6 Some differences in clinical aspects between types I and II tumors have been noted.1 The classic clinicopathological factors have been proven insufficient to define prognostic subgroups.7 It is now widely accepted that cancer can arise as a cell cycle defect, but cellular homeostasis is regulated by proliferation, growth arrest, and apoptosis.8,9 Apoptosis is a biological process controlled by different regulators and potentially could be a goal for new cancer treatment approaches.10 As a transcription factor, wild-type p53 can limit cell proliferation after DNA damage by arresting the cell cycle or inducing apoptosis through the mitochondrial pathway by activating the expression of bax and PUMA.11 However, certain mutants of p53 can inhibit the proapoptotic function of p53 through the formation of heterotetramer with wild-type p53 and
& Volume 25, Number 7, September 2015
induce oncogenesis after up-regulation of C-MYC (Fig. 1).12 PTEN is a main tumor suppressor and induces apoptosis by upregulation of wild-type p53.13 The cell cycle regulators p21 and p27 are belonging to 1 (the Cip/kip family) of the 2 major families regulating the cell cycle.14 The p21 gene is the primary mediator of p53-induced cell cycle arrest, and cells lacking functional p53 express only low levels of p21.10 The primary aim of this study was to compare some clinicopathological features and differences in the immunohistochemical (IHC) profile for the apoptosis regulators p53, C-MYC, bax, PUMA, and PTEN and the cell cycle regulatory proteins p21 and p27, detected in previous studies,15Y18 between the groups of types I and II tumors in patients with International Federation of Gynecology and Obstetrics (FIGO) stages I-II ovarian carcinoma.
MATERIALS AND METHODS In total, 131 of 140 consecutive patients with FIGO stage (1988 FIGO staging) I-II EOC, who underwent primary surgery and postsurgical chemotherapy in the Uppsala¨ rebro Medical Region during the 5-year period from O January 1, 2000, to December 31, 2004, were entered into this study. All samples were collected with the patient’s informed consent (131 of 140 patients accepted) and were in compliance with the Helsinki Declaration19 and used in accordance with the Swedish Biobank Legislation and Ethical Review Act (approval by Uppsala Ethical Review Board, decision ref. UPS-03-477). There were 131 available tumors for analysis of p53 and p27, 130 tumors for PTEN and bax, and
FIGURE 1. Wild p53 has important function for both cell cycle arrest and apoptosis. However, certain mutants of p53 can inhibit the proapoptotic function of p53 through the formation of heterotetramer with wild-type p53 and induce oncogenesis after up-regulation of C-MYC.
1240
* 2015 IGCS and ESGO
International Journal of Gynecological Cancer
& Volume 25, Number 7, September 2015
TABLE 1. Patients’ characteristics (n = 131) n Age (mean) BMI e25 kg/m2 BMI 925 kg/m2 World Health Organization performance status 0 1 2 3 FIGO stage* IA IB IC II Types of ovarian tumors† Type I tumors Low-grade (G1) serous Mucinous (G1 + G2 + G3) Low-grade endometrioid (G1 + G2) Clear cell Type II tumors High-grade (G2 + G3) serous High-grade (G3) endometrioid Anaplastic
%
59.0 y 69 57
(54.8) (45.2)
37 66 21 6
(28.2) (50.4) (16.0) (4.6)
39 6 66 20
(29.7) (4.6) (50.4) (15.3)
79 14 20 29 16 52 37 13 2
(65.8)
primary surgery, and after staining with hematoxylin-eosin, they were classified and graded by a single pathologist. The tissue microarrays were constructed as described previously.21 Two tissue core specimens (diameter, 0.6 mm) from all 131 ovarian carcinomas were arranged in 3 recipient paraffin blocks. The presence of tumor tissue on the arrayed samples was verified by hematoxylin-eosinYstained section by a pathologist. Five-micrometer-thick sections were cut from each multitissue block and were put on coated slides and dried overnight at 37-C. The sections were pretreated by heathinduced epitope retrieval in target-retrieval solution (Dako, Glostrup, Denmark), pH 6, or EDTA buffer, pH 9, for 7 + 7 minutes in microwave oven (99-C). Blocking with peroxidase was performed for 5 minutes. The slides were counterstained with hematoxylin for 2 minutes. Information about the primary antibodies and IHC analyses can be found in previous studies.15Y18 The IHC stainings were interpreted by 2 of the authors (I.S. and T.S.). At the time of evaluation, no information was available on the specific diagnosis and prognosis for the individual cases. A semiquantitative analysis22 was used, and the stainings were graded as negative, +, ++, and +++ for p53, p21, p27, C-MYC, PTEN, and bax, and all those markers were
TABLE 2. Clinical features compared between types I and II tumors (34.2)
*FIGO stage (1988 FIGO staging). †Types of tumors (tumors divided in types I and II tumors according to combination of histological subtype and FIGO grade).
129 tumors for analysis of p21, C-MYC, and PUMA (lower numbers because of technical issues in the staining process). The staging procedure was done at the time of primary surgery. Modified surgical staging according to the European Organisation for Research and Treatment of Cancer surgical staging20 was undertaken in 34 (26%) of 131 cases, and in the remaining 77 patients (74%), surgical staging was regarded as minimal or inadequate. All patients had chemotherapy 4 to 6 weeks after primary surgery, usually (n = 105) paclitaxel 175 mg/m 2 and carboplatin (area under the curve = 5) at 3-week intervals usually in 4 courses or single-drug carboplatin in 4 to 6 courses. The mean follow-up time was 65 months (range, 5Y110 months). Survival was defined as date of confirmed histological diagnosis after primary surgery to date of recurrence, death, or last visit.
Tissue Microarray, Immunohistochemistry, and Interpretation The specimens were obtained from the paraffin blocks containing the embedded tissue removed from the tumor at * 2015 IGCS and ESGO
Ovarian Tumors in FIGO Stages I-II
Type I Tumors (n = 79), % Age BMI BMI e25 kg/m2 BMI 925 kg/m2 FIGO stage IA-B IC II Capsule rupture* Yes No Residual tumor† Yes No Recurrence With Without
Type II Tumors (n = 52), %
P (W2 Test)
57.2
60.7
P = 0.108 (t test)
36 (47)
33 (66)
40 (53)
17 (34)
P = 0.039
31 (39) 39 (49) 9 (12)
14 (27) 27 (52) 11 (21)
P = 0.184
34 (43) 45 (57)
15 (29) 37 (71)
P = 0.100
1 (1) 78 (99)
5 (10) 90 (90)
P = 0.025
15 (19) 64 (81)
19 (37) 33 (63)
P = 0.025
*Capsule of the tumor is perforated before or at primary surgery. †Residual tumor after primary surgery.
1241
Skirnisdottir et al
International Journal of Gynecological Cancer
& Volume 25, Number 7, September 2015
FIGURE 2. Disease-free survival was compared between patients with type I tumors (n = 79) and type II (n = 52) tumors in the study. dichotomized into negative and positive (+, ++, +++) cases.23 However, for PUMA, weak positive staining (+) was graded as negative (j), and moderate/strong staining (++/+++) graded as positive. The staining for p21 and p53 was considered to be positive when there was a strong, granular staining of the nuclei of the majority of tumor cells, but the staining for p27 and PTEN was considered to be positive when strong granular staining of the nuclei and cytoplasm of the tumor cells was found. Localization for C-MYC staining was nuclear, cytoplasmic, and membranous in the tumor cells. Staining for bax showed faint, nonspecific staining of the cytoplasm. However, the cases, which were interpreted as positive, showed strong granular and punctuate staining of the cytoplasm in most of the tumor cells. Weak cytoplasmic staining for PUMA was detected in tumor cells in almost all tumors evaluated. As negative staining of cytoplasm hardly was detected in this series of patients, our findings were limited to weak or moderate/strong staining of cytoplasm.
Statistical Analysis
The Pearson W2 test was used for testing proportional differences in univariate analyses. The survival curve was generated by using the Kaplan-Meier technique, and differences between these curves were tested by the log-rank test. The logistic regression model was used for both univariate and multivariate analysis with recurrent disease and tumor type (I/II) as the endpoint, respectively. All tests were 2-sided, and the level of statistical significance was P e 0.05. The STATISTICA 12.0 (StatSoft) statistical package for personal computers was used for the analyses.
1242
RESULTS Patients Patients’ characteristics are demonstrated in Table 1. The study population included 79 type I tumors (65.8%) and 52 type II tumors (34.2%). Primary cure was achieved in all 131 patients. The number of recurrences in the complete series was 34 (26%) of 131, and 22 of these patients died because of disease. In the complete series, recurrent disease was associated with FIGO substages (P = 0.0005), FIGO grade (P = 0.030), adequate surgical staging (P = 0.033), and residual disease (P = 0.001). The 5-year disease-free survival rate was 68%, the disease-specific survival rate was 76%, and the overall survival rate was 71%.
Clinical Features Compared Between Type I and Type II Tumors The mean age of patients with type I tumors (57.2 years) did not differ from that in type II group (60.7 years) (Table 2). However, the group of patients with type I tumors had significantly (P = 0.039) higher body mass index (BMI) compared with the type II group. Residual tumor after primary surgery (all 6 patients in FIGO stage IIC) occurred more frequently (P = 0.025) in type II tumors. Recurrent disease was more frequently (P = 0.025) found among patients with type II tumors, and it was a trend (P = 0.054) toward better disease-free survival among patients of type I tumors (Fig. 2).
Cell CycleYAssociated Proteins Compared Between Type I and Type II Tumors In previous studies15Y17 including the total series of patients (n = 131) and18 including 105 (adjuvant taxane * 2015 IGCS and ESGO
International Journal of Gynecological Cancer
& Volume 25, Number 7, September 2015
chemotherapy) of 131 patients, respectively, results from IHC for some cell cycleYassociated proteins and several combinations of those have already been presented. The status of protein expression (positivity/negativity) for the apoptosis regulators, p53, C-MYC, bax, PUMA, and PTEN and the cell cycle regulatory proteins p21 and p27 and some combinations of those is presented (Table 3) and compared between types I and II tumors. Positive staining for p53 and p27 alone was more frequently detected in type II tumors (Fig. 3). Concomitant positivity for p53 and negativity for p21 (p53+p21j) and concomitant positivity for bax and negativity for p53 (bax+p53j) also were more frequently found in type II tumors compared with expression status for alternative combinations of biomarkers detected in type I tumors.
Ovarian Tumors in FIGO Stages I-II
Differently, concomitant positivity for p21 and p27 (p21+p27+), concomitant positivity for C-MYC and negativity for p53 (CMYC+p53j), concomitant positivity for C-MYC and p21 (CMYC+p21+), and concomitant negativity for PUMA and p53 (PUMAjp53j) were more frequently detected in type I tumors compared with expression status for alternative combinations of those biomarkers found in type II tumors.
Multivariate Analysis Results are shown in Tables 4A-C for univariate and multivariate logistic regression analyses. In Table 4A, with recurrent disease as endpoint, FIGO stage, tumor type (I vs II), BMI in the 2 groups, and p53 status all were independent
TABLE 3. Protein expression of apoptosis regulators versus types I and II ovarian tumors (n = 131) Tumors
Type I (%) n=79(66)
Protein expression p53+ p53j
14 (18) 65 (82)
p21+ p21j
33 (42) 45 (58)
p27+ p27j
37 (47) 42 (53)
p27+p53j Other§
29 (37) 50 (63)
p53+p21j Other¶
9 (12) 69 (88)
p21+p27+ Other#
10 (13) 68 (87)
C-MYC+ C-MYCj
65 (83) 13 (17)
PTEN+ PTENj
13 (17) 65 (83)
Type II n (%) n=52(34)
19 (37) 33 (63) P = 0.015 13 (25) 38 (75) P = 0.051 38 (73) 14 (27) P = 0.003 23 (44) 29 (56) P = 0.389 16 (31) 35 (39) P = 0.005 1 (2) 50 (98) P = 0.030 33 (65) 18 (35) P = 0.051 15 (29) 37 (71) P = 0.097
Protein expression C-MYC+p53j Other* PTENjC-MYC Other†
Type I (%) n=79(66)
Type II (%) n=52(34)
55 (70) 23 (30)
21 (41) 30 (59) P = 0.0009 9 (17) 43 (83) P = 0.598 10 (19) 42 (81) P = 0.566 8 (16) 43 (84) P = 0.008 39 (75) 13 (25) P = 0.331 26 (50) 26 (50) P = 0.027 25 (49) 26 (51) P = 0.455 42 (82) 9 (18) P = 0.045
j
11 (14) 68 (86)
PTENjp53+ Other‡
12 (15) 66 (85)
C-MYC+p21+ Other||
29 (37) 49 (63)
bax+ baxj
64 (82) 14 (18)
bax+p53j Other**
24 (31) 54 (69)
PUMA+ PUMAj
33 (42) 45 (58)
PUMAjp53j Other††
73 (94) 5 (6)
*Other (C-MYC+p53+, C-MYC-p53+, C-MYCjp53). †Other (PTEN+CjMYC+, PTEN+C-MYCj, PTEN-CjMYC+). ‡Other (PTEN+p53+, PTEN+p53j, PTENjp53j). §Other (p27+p53+, p27jp53+, p27jp53j). ||Other (C-MYC+p21j, C-MYC+p21j, C-MYCp21j). ¶Other (p21+p53+, p21+p53j, p21jp53j). #Other ( p21+p27j, p21jp27+, p21jp27). **Other (bax+p53+, baxjp53+, baxjp53j). ††Other (PUMA+p53+, PUMAjp53+, PUMA+ p53j).
* 2015 IGCS and ESGO
1243
International Journal of Gynecological Cancer
Skirnisdottir et al
& Volume 25, Number 7, September 2015
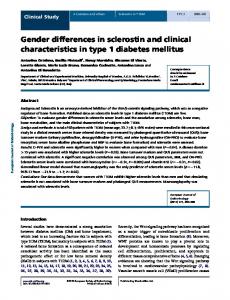
FIGURE 3. Immunohistochemical results for type II tumor (high grade serous) are demonstrated: A, High grade serous carcinoma with strong positivity for p27. B, High grade serous carcinoma, negative for p21. C, High grade serous carcinoma, negative for c-myc. D, High grade serous carcinoma with p53-expression. Concomitant positivity for p53 and negativity for p21, positivity for p27, and negativity for C-MYC in an epithelial ovarian tumor might strengthen the diagnostic option of type II tumor ovarian carcinoma. predictive factors for recurrent disease. In a multivariate logistic regression analysis with type I/II tumors as endpoint, recurrent disease and status of p53 or p53+p21j were not introduced in the multivariate model together because of strong correlation between them. In Table 4B, age, status of CMYC, and concomitant positivity for p53 and negativity for p21 all were independent predictive factors. In a separate TABLE 4. A. Predictive factors for recurrent disease (univariate and multivariate logistic regression analysis) Univariate Analysis
Multivariate Analysis
Variable
OR
95% CI
OR
95% CI
P
Age Stage (I vs II) Type* (I vs II) BMI† p53 p27 PTENjCMYCj‡
0.99 7.96 2.46 2.99 4.18 0.57 0.28
0.96Y1.06 2.80Y22.62 1.01Y5.49 1.30Y6.83 1.77Y9.89 0.26Y1.27 0.10Y0.75
1.01 4.76 3.78 3.55 4.19 0.33 0.28
0.97Y1.06 1.41Y16.04 1.19Y11.98 1.13Y11.13 1.42Y12.39 0.11Y1.0 0.08Y1.03
0.68 0.01 0.02 0.03 0.01 0.05 0.05
*Type I or type II tumor. †BMI e25 versus BMI 925 kg/m2. ‡PTENjC-MYCj (PTENjC-MYCj) vs (PTEN+C-MYC+, PTEN+ C-MYCj PTENjC-MYC+). CI, Confidence interval.
1244
multivariate logistic regression analysis with type I/II tumors also as endpoint (Table 4C), age, BMI, p27 status, and recurrent disease all were independent predictive factors.
DISCUSSION Findings from the present study have confirmed that types I and II ovarian tumors exhibit different clinicopathological and IHC features. This is confirmed by previous studies on the basis of morphologic and molecular genetics, showing, that the 5 main histological types of ovarian cancer can be classified into TABLE 4. B. Possible predictive factors that distinguish types I and II tumors EOC in FIGO stages I-II (univariate and multivariate logistic regression analysis) Univariate Analysis
Multivariate Analysis
Variable
OR
95% CI
OR
95% CI
P
Age BMI* C-MYC p27 p53+p21j†
1.02 0.46 0.37 3.08 3.50
0.99Y1.06 0.22Y0.98 0.16Y0.85 1.44Y6.60 1.40Y8.80
1.04 0.45 0.33 2.30 2.95
1.00Y1.08 0.19Y1.11 0.13Y0.85 0.96Y5.42 1.07Y8.14
0.03 0.08 0.02 0.06 0.03
*BMI e25 versus BMI 925 kg/m2. †p53+p21j (p53+p21j) versus (p53+p21+, p53jp21+j, p53jp21j). CI, Confidence interval.
* 2015 IGCS and ESGO
International Journal of Gynecological Cancer
& Volume 25, Number 7, September 2015
TABLE 4. C. Possible predictive factors that distinguish types I and II tumors EOC in FIGO stages I-II (univariate and multivariate logistic regression analysis) Univariate Analysis
Multivariate Analysis
Variable
OR
95% CI
OR
95% CI
P
Age BMI* C-MYC p27 Recurrent disease
1.02 0.46 0.37 3.08 2.46
0.99Y1.06 0.22Y0.98 0.16Y0.85 1.44Y6.61 1.10Y5.50
1.04 0.37 0.38 3.00 4.26
1.01Y1.08 0.13Y0.89 0.14Y1.10 1.21Y7.39 1.53Y11.84
0.02 0.03 0.05 0.02 0.01
*BMI e25 versus BMI 925 kg/m2. CI, Confidence interval.
types I and II.2,7 Positive staining for the apoptosis regulator p53, concomitant positivity for p53 and negativity for the cell cycle regulator p21 (vs other combinations in one group), and positive staining for the cell cycle regulator p27 were more frequently detected in type II tumors. Differently, positive staining for the apoptosis regulator C-MYC was more frequently seen in type I tumors. Our findings related to the IHC differences between types I and II tumors are supported by earlier studies.4,10,24 Differences in clinical aspects between types I and II tumors have also been noted. Thus, patients with type II tumors were of higher age, had lower BMI, and had more often recurrent disease than patients with type I tumors. Previous studies have reported that patients with low-grade serous carcinoma are younger than those with high-grade serous tumors and that there is an elevated risk for EOC in women with higher BMI for type I tumors.24,25 Furthermore, recurrent disease occurred more frequently among patients in the subgroup of type II tumors, which had 3.8 times increased risk of recurrent disease compared with women with type I tumor. In our series, there was a trend (P = 0.054) for better diseasefree survival for patients with type I tumors compared with patients with type II tumors (Fig. 2). Nearly 30% of the EOC patients will present at diagnosis with stage I-II disease with a favorable survival. However, about 30% of those patients will have recurrent disease and survival that is comparable with survival after recurrent disease for patients with stage III-IV disease.1 In our study limited to FIGO stages I-II, the recurrence rate was 26% for all patients with types I and II tumors in 1 group, and in multivariate analysis, the FIGO stage was the strongest (odds ratio [OR], 4.7) clinical predictive factor for recurrent disease. In a study from Canada26 on 605 patients in FIGO stages I-II, the FIGO stage was a strong (OR, 8.0) predictive factor for tumor recurrence. The p53 status was also an independent predictive factor for recurrent disease in the present study with an OR of 4.2. This has been confirmed in other studies.27,28 In a metaanalysis including 62 studies, a hazard ratio of 1.47 for p53 status was found with overall survival as endpoint.29 There is mounting evidence that types I and II ovarian tumors develop along different molecular pathways,4,6 and * 2015 IGCS and ESGO
Ovarian Tumors in FIGO Stages I-II
tumor type is considered to reflect different diseases with different clinical behavior, response to chemotherapy, and prognosis.26 The apoptosis regulator p53 was an independent predictive factor for type II tumor only in combination with the cell cycle regulator p21. Thus, the IHC profile of p53 positivity and concomitant negativity of the cell cycle regulator p21 was unique for type II tumors. The p21 gene is the primary mediator of p53-induced cell cycle arrest, and cells lacking functional p53 express only low levels of p21.10 Presence of the cell cycle regulator p27 alone was mostly (OR, 3) detected in type II tumors, and an OR of 0.3 for p27 status with recurrent disease as endpoint meant 70% decreased risk for a patient with p27 positivity of the tumor to have recurrent disease. In 1 study,30 the p27 status alone was related to better survival or in combination with p53 in another study.15 Differently, presence of the apoptosis regulator C-MYC was a predictive factor for type I tumor in a logistic regression analysis. The proposed model by assigning different ovarian tumors into 2 categories (types I and II) based on clinical, morphological, and molecular genetic characteristics facilitates understanding the pathogenesis of ovarian cancer.31 Type I tumors are considered as slowly growing neoplasm through borderline tumors, but according to 1 study,32 it is possible that some serous type I tumors can progress to serous type II tumors. How could this new proposed model, which divides ovarian tumors into 2 different artificial types of tumors, become helpful in the clinics? At present, adjuvant therapy for ovarian cancer is mainly dependent on FIGO stage and grade rather than type, and many hospitals have recommended that patients with ovarian carcinoma in FIGO stage IA of tumor grade 1 should not receive adjuvant therapy.33 Type I tumors, which are considered resistant to traditional chemotherapeutic agents, may in the future have treatment guidelines, which are different from type II tumors.24 The grade assignment lacks reproducibility depending on the grading system used, and tumor grade does not alone reflect the biological differences of the different types. Based on improvements in how many types are assigned by pathologists, the reproducibility of typing is much better than that of grading.34,35 Differences in the IHC profile for p53 p21 status, p27 status, and C-MYC status between types I and II tumors were detected in the present study. Concomitant positivity for p53 and negativity for p21, positivity for p27, and negativity for C-MYC in an epithelial ovarian tumor might strengthen the pathological diagnosis of type II tumor ovarian carcinoma. Thus, our findings might be useful in the histopathologic distinction of types I and II ovarian carcinoma, and the use of designed panels, based on observations in a defined tumor material, as in this series, may increase the diagnostic options. Tumor type has more reproducibly assigned than grade and identifies a larger cohort of women with stage I/II ovarian carcinoma with favorable outcomes and therefore is superior to grade in estimating risk of death from ovarian carcinoma.26 However, some authorities in the field are in some disagreement with the new classification into 2 groups, designed as types I and II tumors. Thus, clear cell carcinoma exhibits morphologic, molecular, and clinical features that do not entirely resemble either type I or type II tumors, and
1245
International Journal of Gynecological Cancer
Skirnisdottir et al
unlike other type I tumors, clear cell carcinoma is designed as high grade at presentation.36,37 This is in agreement with recent findings from Zannoni et al,36 where they show that clear cell ovarian carcinoma should be studied separately, but still in comparison with the groups of types I and II tumors. It is likely, that serous type II carcinomas containing cells with clear cytoplasm have erroneously been classified as clear cell type I carcinoma in different studies.38 According to Prat,2 the classification into just 2 types (I and II) is artificial and limits progress in understanding the biology of the less common types of ovarian carcinoma. Limitations of this study correspond to the relative limited number of patients included and the tissue microarray technology, where only 2 0.6-mm core biopsies were obtained from each specimen for analysis as ovarian carcinomas can be very heterogeneous, and such specimens may not be representative of the tumor in some cases. Finally, the method of semiquantitative analysis22 was used for the interpretation, where all markers were dichotomized into negative and positive groups.23 However, our findings might be useful in the pathologic diagnosis of distinction of types I and II epithelial ovarian carcinoma.
REFERENCES 1. Chan JK, Tian C, Teoh D, et al. Survival after recurrence in early-stage high-risk epithelial ovarian cancer: a Gynecologic Oncology Group study. Gynecol Oncol. 2010;116:307Y311. 2. Prat J. New insights into ovarian cancer pathology. Ann Oncol. 2012;23:x111Yx117. 3. McCluggage: Morphological subtypes of ovarian carcinoma: a review with emphasis on new developments and pathogene. Pathology. 2011;420Y432. 4. Kurman RJ, Shih I-M. The origin and pathogenesis of epithelial ovarian cancer: a proposed unifying theory. Am J Surg Pathol. 2010;34:433Y433. 5. Rechsteiner M, Zimmermann A-K, Wild PJ, et al. TP53 mutations are common in all subtypes of epithelial ovarian cancer and occur concomitantly with KRAS mutations in the mucinous type. Exp Mol Pathol. 2013;95:235Y241. 6. Kurman RJ, Shih I-M. Molecular pathogenesis and extraovarian origin of epithelial ovarian cancerVshifting the paradigm. Hum Pathol. 2011;42:918Y931. 7. Crijns APG, Duiker EW, de Jong S, et al. Int J Gynecol Cancer. 2006;16:152Y165. 8. Nam EJ, Kim YT. Alteration of cell-cycle regulation in epithelial ovarian cancer. Int J Gynecol Cancer. 2008;18:1169Y1182. 9. Foster I. Cancer: A cell cycle defect. Radiography. 2008;14:144Y149. 10. Lee YH, Heo JH, Kim TH, et al. Significance of cell cycle regulatory proteins as malignant and prognostic biomarkers in ovarian epithelial tumors. Int J Gynecol Pathol. 2011;30: 205Y217. 11. Harris SL, Levine AJ. The p53 pathway: positive and negative feedback loops. Oncogene. 2005;24:2899Y2908. 12. Ozaki T, Nakagawara A. Role of p53 in cell death and human cancers. Cancers (Basel). 2011;3:994Y1013. 13. Lee YK, Park NH. Prognostic value and clinicopathological significance of p53 and PTEN in epithelial ovarian cancers. Gynecol Oncol. 2009;112:475Y480. 14. Bali A, O’Brien PM, Edwards LS, et al. Cyclin D1, p53, and p21Waf1/Cip1 expression is predictive of poor clinical outcome
1246
15.
16.
17.
18.
19.
20.
21.
22.
23.
24. 25.
26.
27.
28.
29.
30.
31.
32.
& Volume 25, Number 7, September 2015
in serous epithelial ovarian cancer. Clin Cancer Res. 2004;10:5168Y5177. Skirnisdottir IA, Sorbe B, Lindborg K, et al. Prognostic impact of p53, p27, and C-MYC on clinicopathological features and outcome in early-stage (FIGO I-II) epithelial ovarian cancer. Int J Gynecol Cancer. 2011;21:236Y244. Skirnisdottir I, Seidal T. Prognostic impact of concomitant p53 and PTEN on outcome in early stage (FIGO I-II) epithelial ovarian cancer. Int J Gynecol Cancer. 2011;21:1024Y1031. Skirnisdottir I, Seidal T. Association of p21, p21 p27 and p21 p53 status to histological subtypes and prognosis in low-stage epithelial ovarian cancer. Cancer Genomics Proteomics. 2013;10:27Y34. Skirnisdottir I, Seidal T. The apoptosis regulators p53, bax and PUMA: Relationship and impact on outcome in early stage (FIGO I-II) ovarian carcinoma after post-surgical taxane-based treatment. Oncol Rep. 2012;27:741Y747. WMA Declaration of Helsinki - Ethical Principles for Medical Research Involving Human Subjects (http://www.wma.net/en/ 30publications/10policies/b3/index.html). Trimbos JB, Vergote I, Bolis G, et al. Impact of adjuvant chemotherapy and surgical staging in early-stage ovarian carcinoma: European Organisation for Research and Treatment of CancerYAdjuvant ChemoTherapy in Ovarian Neoplasm Trial. J Natl Cancer Inst. 2003;95:113Y125. Kononen J, Bubendorf L, Kallioniemi A, et al. Tissue microarrays for high-throughput molecular profiling of tumor specimens. Nat Med. 1998;4:844Y847. Seidal T, Balaton AJ, Battifora H. Interpretation and quantification of immunostains. Am J Surg Pathol. 2001;25:1204Y1207. Ko¨bel M, Kalloger SE, Boyd N, et al. Ovarian carcinoma subtypes are different diseases: Implications for biomarker studies. PLoS Med. 2008;5:1749Y1760. Vang R, Shih I-M,, Kurman R. Ovarian low grade and high grade serous carcinoma. Adv Anat Pathol. 2009;16:267Y282. Olsen CM, Nagle CM, Whiteman DC, et al. Obesity and risk of ovarian cancer subtypes: evidence from the Ovarian Cancer Association Consortium. Endocr Relat Cancer. 2013;20: 251Y262. Ko¨bel M, Kalloger SE, Santos JL, et al. Tumor type and substage predict survival in stage I and II ovarian carcinoma: insights and implications. Gynecol Oncol. 2010;116:50Y56. Skirnisdottir I, Seidal T, Sorbe B. A new prognostic model comprising p53, EGFR, and tumor grade in early stage epithelial ovariancarcinoma and avoiding the problem of inaccurate surgical staging. Int J Gynecol Cancer. 2004;14:259Y270. Heini Lassus AL, Lundin Johan, Pentti Lehtovirta aRB. Distinct subtypes of serous ovarian carcinoma identified by p53 determination. Gynecol Oncol. 2003;91:504Y512. de Graeff P, Crijns AP, de Jong S, et al. Modest effect of p53, EGFR and HER-2/neu on prognosis in epithelial ovarian cancer: a meta-analysis. Br J Cancer. 2009;101:149Y159. Newcomb E, Sosnow M, Demopoulos R, et al. Expression of the cell cycle inhibitor p27KIP1 is a new prognostic marker associated with survival in epithelial ovarian tumors. Am J Pathol. 1999;154:19Y125. Kurman RJ, Visvanathan K, Roden R, et al. Early detection and treatment of ovarian cancer: shifting from early stage to minimal volume of disease based on a new model of carcinogenesis. Am J Obstet Gynecol. 2008;198:351Y356. Shih I-M, Kurman RJ. Ovarian tumorigenesis. Am J Pathol. 2004;164:1511Y1518. * 2015 IGCS and ESGO
International Journal of Gynecological Cancer
& Volume 25, Number 7, September 2015
33. Trope C, Kaern J. Adjuvant chemotherapy for early-stage ovarian cancer: review of the literature. J Clin Oncol. 2007;25:2909Y2920. 34. Gilks CB, Ionescu DN, Kalloger SE, et al. Tumor cell type can be reproducibly diagnosed and is of independent prognostic significance in patients with maximally debulked ovarian carcinoma. Hum Pathol. 2008;39:1239Y1251. 35. Singh N, Ayhan A, Menon U, et al. Grading of serous ovarian carcinoma: further evidence of a lack of agreement between conventional grading systems. Histopathology. 2008;52:393Y395. 36. Zannoni GF, Morassi F, Prisco MG, et al. Clinicopathologic and immunohistochemical features of ovarian clear cell carcinomas
* 2015 IGCS and ESGO
Ovarian Tumors in FIGO Stages I-II
in comparison with type I and type II tumors. Int J Gynecol Pathol. 2012;31:507Y516. 37. Zhao C, Wu LS, Barner R. Pathogenesis of ovarian clear cell adenofibroma, atypical proliferative (borderline) tumor, and carcinoma: clinicopathologic features of tumor with endometriosis or adenofibromatous components support two related pathways of tumor development. J Cancer. 2011;2: 94Y106. 38. Ko¨bel M, Kalloger SE, Huntsman DG, et al. A limited panel of immunomarkers can reliably distinguish between clear cell and high-grade serous carcinoma of the ovary. Am J Surg Pathol. 2009;33:14Y21.
1247