sports Article
Differences in Spatial Physical Activity Patterns between Weekdays and Weekends in Primary School Children: A Cross-Sectional Study Using Accelerometry and Global Positioning System Rahel Bürgi * and Eling D. de Bruin Department of Health Sciences and Technology, Institute of Human Movement Sciences and Sport, ETH Zürich, Leopold-Ruzicka-Weg 4, Zurich 8093, Switzerland;
[email protected] * Correspondence:
[email protected]; Tel.: +41-44-632-4235 Academic Editor: Michael Duncan Received: 12 May 2016; Accepted: 22 June 2016; Published: 27 June 2016
Abstract: Targeting the weekend to promote physical activity (PA) in children seems to be promising given that they tend to be less physically active and, particularly, as the age-related decline in PA is more marked during weekends. Considering the ambiguity of why children are not able to maintain their PA level on weekends, the aim of the present study was to objectively investigate differences in children’s spatial PA patterns between week and weekend days using the combination of Global Positioning System (GPS) and accelerometry. Seventy-four second graders (aged 7–9 years) and 98 sixth graders (aged 11–14 years) wore an accelerometer and GPS sensor for seven consecutive days to determine where children spend time and engage in PA. Time-matched accelerometer and GPS data was mapped with a geographic information system and multilevel analyses accounting for the hierarchical structure of the data were conducted. Differences between weekdays and weekends regarding the total time spent and the absolute and relative level of PA in various settings were found in both age groups. The findings support previous research pointing to the importance of targeting weekend PA, especially when children grow older. Future interventions should encourage children to use outdoor spaces more frequently on weekends, rather than stay at home, and to commute actively to destinations other than school. Keywords: physical activity; accelerometer; GPS; children; location; weekend; weekday
1. Introduction Regular physical activity (PA) in children is associated with many physical and psychological health benefits, and there is a widespread belief that PA contributes to children’s social development [1–3]. Evidence is present that PA performed during childhood may also contribute to an active lifestyle in adulthood [4,5]. Current international public health guidelines for children recommend at least one hour of moderate-vigorous PA (MVPA) per day [6]. However, only a small percentage of school-aged children achieve these recommendations [7,8]. In Switzerland, only one in five boys and just only one in ten girls aged 11 are adequately physically active according to these PA recommendations [8]. In light of this evidence, the promotion of an active and healthy lifestyle during childhood and adolescence should be an urgent public health priority. In order to develop effective evidence-based public health interventions, it is essential to have a clear understanding of children’s PA patterns and its influencing factors [9]. A large number of studies have been conducted in the last ten years to assess patterns and correlates of children’s PA, in which gender, age, socioeconomic status, and parental and peer influences were among the most investigated correlates [10]. However, since previous studies mostly rely on subjective assessment Sports 2016, 4, 36; doi:10.3390/sports4030036
www.mdpi.com/journal/sports
Sports 2016, 4, 36
2 of 17
methods that are subject to recall bias, knowledge on children’s PA is still incomplete [11]. Using objective high-frequency accelerometry, which facilitates the analysis of temporal correlates, previous studies were able to find notable differences in PA level between weekdays and weekends [12–14]. Given that school-aged children generally accumulated more health-enhancing PA on weekdays than on weekends, Brooke and colleagues [12] pointed to the importance of targeting weekend PA for future interventions. Moreover, different studies showed that the well-investigated decline in MVPA across age groups between childhood and adolescence is more marked on weekends than weekdays [14–16], which also supports interventions focusing on PA maintenance on weekend days. Although there is growing evidence about the discrepancy in PA level between weekdays and weekends, it is still unclear why children are not able to maintain their weekday PA level on weekends. It is suggested that the low accumulation of MVPA during weekends can partly be explained by the absence of the structured school environment, a greater television viewing time, or a more significant familial influence [17–19]. The longer sleep duration at weekends, which limits waking hours available for recreational pursuits and PA, may also be an influential factor [20]. To shed light on this issue, future studies encompassing multidimensional correlates have to investigate differences in activity patterns between weekdays and weekends in more detail [12,21]. Along with the increased use of ecological models in public health, also the environment in which PA takes place has become a stronger focus of attention [22]. Primarily, environmental interventions and changes are thought to have a high potential for sustained impact on populations, especially on those groups that are hard to reach with PA promotion programs [23]. A growing body of research emphasises that environmental factors may have a crucial influence on children’s PA patterns [24], but this influence seems to be highly context-specific [25,26]. Therefore, to guide more targeted PA promotion programs, knowledge on differences in context-specific PA between weekdays and weekends may be a promising step. Recent technological advances have led to the advent of Global Positioning System (GPS) in PA related studies [27,28]. The development of lightweight, accurate, and affordable GPS devices has opened up new possibilities to investigate how people move within their neighbourhood [27,29]. When combining these devices with accelerometers, objectively measured PA can be linked to the location in which the activity takes place, thereby providing a spatial context of PA. Given that the combination of GPS and accelerometry provides objective, reliable, and accurate measurements of context-specific PA [30,31], studies using this objective approach are increasing in numbers and new evidence about context-specific activity patterns is being generated. A review by McCrorie and colleagues [28], which summarises the current literature about using the combination of GPS and accelerometry in children and adolescents, has indicated that objectively measured environmental characteristics can significantly influence children’s PA levels. Moreover, they showed that roads, school grounds, and the home environment are particularly important for both total PA and MVPA [28]. However, nearly none of the studies using GPS and accelerometry examined if there were any differences in the context-specific PA patterns between week and weekend days in primary school children. Klinker and colleagues [32] provided baseline results on both the use of different domains and the time spent in these domains separately for week and weekend days. However, neither did they conduct formal statistical tests of differences between weekdays and weekends nor did they investigate whether there are differences between these time segments relating to the accumulation of MVPA. Using the combination of GPS and accelerometry, the aim of the current study therefore was to assess objectively the spatial PA patterns during weekdays and weekends in school-aged children living in an urban area in Switzerland. In particular, the goal was to investigate if there were any significant differences in context-specific PA between week and weekend days in both second- and sixth-grade children. In addition to existing literature, we aimed to consider not only the use of and total time spent in different settings, but also the time spent in health-enhancing MVPA. Given that reporting both relative and absolute amounts of PA can provide complementary information [12,33], we used the amount of MVPA in minutes as an absolute outcome and the proportion of MVPA in %
Sports 2016, 4, 36
3 of 17
as a relative outcome to examine differences in the context-specific PA behaviour between week and weekend days. 2. Materials and Methods 2.1. Setting To investigate spatial activity patterns of Swiss primary school children in relation to gender and socioeconomic differences, we previously conducted two cross-sectional studies in two different municipalities in the German-speaking part of Switzerland. During January and April 2013, a convenience sample of sixth-grade children participated in a first study carried out in Winterthur [33]. Winterthur is the sixth largest city in Switzerland, with a population of over 100,000 residents. One year later, between February and June 2014, a convenience sample of second-grade children participated in a second study conducted in the municipality of Zurich [34]. With a population of over 400,000 residents, Zurich is the largest city in Switzerland. Both cities represent an urban area, which is representative in relation to various demographic values (e.g., unemployment rate, foreign nationals, or social assistance rate) [35]. In both years, the same recruitment and data collection procedures were applied, which enabled us to aggregate the data for the current study to investigate differences in the spatial PA behaviour between week and weekend days in a sample of both second- and sixth-grade children. 2.2. Participant Recruitment After approval of the school authorities, relevant teachers from public schools in one of the two municipalities were informed in cooperation with the local office of sports by an information letter. If a teacher agreed to take part, his class was visited by a trained study team consisting of the first author [RB] and a student research assistant during a lesson. The study team briefed the class about the study and provided all children with an information letter and an entry form for their parents. To be eligible to participate, children had to be free from any severe disability which prevented them from engaging in routine everyday PA. For every pupil in a participating class, the participation was voluntary and parental written informed consent was obtained. Ethical approval for both studies was obtained from the Ethics Committee of the ETH Zurich (EK 2012-N-62; EK 2013-N-66). 2.3. Data Collection and Measures Data were collected in Winterthur during March and April 2013 and in Zurich during May and June 2014, respectively. It was ensured that all measurements took place within a regular school week without irregular days off from school or school excursions. One day before the start of the measurements, the study team visited the corresponding class again and fitted each registered child with an elastic belt equipped with a tri-axial accelerometer (GT3X, Actigraph, Pensacola, FL, USA) to measure PA and a GPS receiver (BT-Q1000XT, QStarz, Taipei, Taiwan) to record the geographical location (Circular Error Probability, CEP, (50%) < 3 m). Both devices offer accurate measures and are suitable for use in larger population studies with a data collection period of seven or more days [36,37]. The study team configured the devices for each child in advance setting them to record at ten second intervals with their internal clocks synchronized. This rather high sampling frequency was used to reflect children’s PA pattern accurately, which is spontaneous and intermittent in its nature [38]. All children were given a detailed verbal and written instruction on belt wear which involved wearing the belt around the waist from waking to bedtime on seven consecutive days starting the next day. Due to the limited battery life of the GPS receiver, each child was provided with a charger and was instructed to recharge the receiver during each night when asleep. Children further received a small diary in which they had to report times they woke up and went to bed and times and reasons when the belt was not worn throughout the week. To obtain information on children’s age, sex, home address, and sports club membership, a short parental questionnaire was handed out. The same instrument served to assess factors of children’s individual socio-economic status (e.g., nationality,
Sports 2016, 4, 36
4 of 17
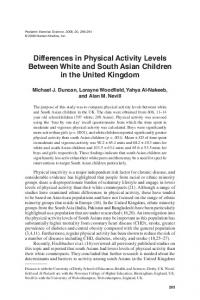
language spoken at home, parental education and income). In addition, height and weight were Sports 2016, 4, 36 4 of 17 measured using a stadiometer (seca 213, Seca AG, Hamburg, Germany) and a digital scale (Beurer using a stadiometer (seca 213, Secaparticipants AG, Hamburg, Germany) andindoor a digital scale (Beurer GS 12,measured Beurer GmbH, Ulm, Germany) with wearing light clothing and shoes ˝ C),indoor GS 12, Beurer GmbH, Ulm,data, Germany) participants wearing clothing and shoes removed. Daily meteorological such with as mean temperatures (inlight sum of precipitation (in mm), removed. meteorological such as meanprovided temperatures (in °C), sum of (in and the sum ofDaily sunshine durationdata, (in min), were by MeteoSwiss forprecipitation each measurement mm), and the sum of sunshine duration (in min), were provided by MeteoSwiss for each week [39]. One day after the last day of measurements, children had to bring all instruments back to measurement week [39]. One day after the last day of measurements, children had to bring all school,instruments where they were collected by the study team. Figure 1 gives an overview on the data collection back to school, where they were collected by the study team. Figure 1 gives an overview duringonthe themeasurement data collection week. during the measurement week.
Figure 1. Overview on the data collection during the measurement week. GPS = global positioning
Figure 1. Overview on the data collection during the measurement week. system. positioning system.
GPS = global
2.4. Data Merging and Processing
2.4. Data Merging and Processing
After manually reviewing each participant’s GPS and accelerometer data file to ensure that they
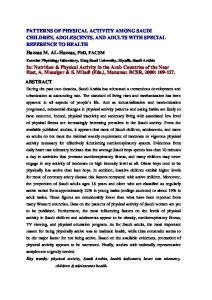
contained no incomplete or erroneous data, GPS and accelerometer data were matched byto date and that After manually reviewing each participant’s GPS and accelerometer data file ensure time. We used existing software (Actilife 6.5.2, Actigraph, Pensacola, FL, USA) for this process they contained no incomplete or erroneous data, GPS and accelerometer data were matched by date producing for each recorded GPS point a measure of activity and location. Only accelerometer data and time. We used existing software (Actilife 6.5.2, Actigraph, Pensacola, FL, USA) for this process from the vertical axis was considered for further analysis since current accelerometer cut points for producing for each recorded GPS point a measure of activity and location. Only accelerometer data different activity levels are based on vertical axis counts. The processing of the matched data was from the verticalusing axisMATLAB was considered for furtherNatick, analysis since accelerometer cut Core points for performed R2012a (MathWorks, MA, USA)current and R 3.1.2 (R Development different activity levels are based on vertical axis counts. The processing of the matched Team, Vienna, Austria). Intervals with >60 min of consecutive zero activity counts were classifieddata as was non-wear time and excluded from(MathWorks, analysis [40]. Activity >5461and counts per 10(R s were identified Core performed using MATLAB R2012a Natick,records MA, USA) R 3.1.2 Development outliersAustria). [41] and replaced with the mean of the and the following value. Based on ageTeam,as Vienna, Intervals with >60 min ofprevious consecutive zero activity counts were classified appropriate [42,43], from each data point [40]. was then classified as sedentary (5461 counts per 10 minute (CPM)), light (101–2295 CPM), moderate (2296–4011 CPM) or vigorous (≥4012 CPM) activity. identified as outliers [41] and replaced with the mean of the previous and the following value. Based To remove GPS outliers from the data, we processed the data by visual observation as well as on age-appropriate cut-points [42,43], each data point was then classified as sedentary (500 m per 10 minutes) (CPM)), light (101–2295 CPM), moderate (2296–4011 or vigorous and invalid values of altitude, which are not possible for theCPM) respective regions. (ě4012 CPM) activity. To remove The GPSlocation-based outliers fromcategorisation the data, weofprocessed thedata datapoints by visual observation as well10as(ESRI, automatic the matched was conducted in ArcGIS identification invalid points data using extreme changes into in distance (>500 m per 10 s) and Redlands,ofCA, USA). GPS Each data participant’s points were imported ArcGIS and plotted on their own point layer. We chose to define the seven activity settings presented in Figure 2 to assign each data invalid values of altitude, which are not possible for the respective regions. point to a location. The settings used of arethe based on similar studies in was this field of research [44–46] and The location-based categorisation matched data points conducted in ArcGIS 10 (ESRI, the ability to clearly assign each point to a location within ArcGIS. The assignment process was Redlands, CA, USA). Each participant’s data points were imported into ArcGIS and plotted on their conducted in a hierarchical order using the point-in-polygon overlay, which is a spatial operation in own point layer. We chose to define the seven activity settings presented in Figure 2 to assign each ArcGIS. During this process described in Figure 2, each participant’s data layer was overlaid on five data point to a location. The settings used are based on similar studies in this field of research [44–46] and the ability to clearly assign each point to a location within ArcGIS. The assignment process was conducted in a hierarchical order using the point-in-polygon overlay, which is a spatial operation
Sports 2016, 4, 36 Sports 2016, 4, 36
5 of 17 5 of 17
in ArcGIS. During this process described in Figure 2, each participant’s data layer was overlaid on different polygonlayers layersto todetermine determine which within which polygons. TheThe five different polygon which data datapoints pointsare arecontained contained within which polygons. creation of the five polygon layers was done using further geospatial data (land-use data, register creation of the five polygon layers was done using further geospatial data (land-use data, register data, data, points-of-interest, and imagery) satellite imagery) provided the Land Surveying Office Winterthurand points-of-interest, and satellite provided by thebyLand Surveying Office of of Winterthur and the Office for Geomatics and Surveying of the City of Zurich and has been described elsewhere the Office for Geomatics and Surveying of the City of Zurich and has been described elsewhere [33]. [33]. To take the GPS measurement error into account, a buffer zone of ten meters was drawn around To take the GPS measurement error into account, a buffer zone of ten meters was drawn around the the school, recreation, and street polygons [30,36,47]. school, recreation, and street polygons [30,36,47].
FigureFigure 2. Definitions ofofactivity andoverview overview of hierarchical the hierarchical assignment 2. Definitions activity settings settings and of the assignment process inprocess the in the geographic geographicinformation information system ArcGIS. The assignment process was conducted using the system ArcGIS. The assignment process was conducted using the point-inpolygon-overlay, which is aisspatial operation in ArcGIS. TheThe creation of the fivefive polygon layers point-in-polygon-overlay, which a spatial operation in ArcGIS. creation of the polygon layers boundary, school, recreation, street wasdone doneusing using further further geospatial provided by the boundary, home,home, school, recreation, andand street was geospatialdata data provided by the Land Surveying of Winterthur Officefor forGeomatics Geomatics and and Surveying the City of Zurich. Land Surveying OfficeOffice of Winterthur andand thethe Office Surveyingofof the City of Zurich.
2.5. Data Analysis
2.5. Data Analysis
Children had to provide at least one weekday and one weekend day with four full hours of
Children provide at in least weekday one weekend day with fourconsidered full hours of matched had data to to be included the one analysis [33]. Toand improve the data quality, we only matched data to be included in the analysis [33]. To improve the data quality, we only matched wear time data on valid days from locations in which the participant spent ≥2 minconsidered during matched thiswear day. time data on valid days from locations in which the participant spent ě2 min during this day. Statistical analyses were performed using R. Descriptive statistics to calculate frequency distributions (numberwere (n) and proportion (%)) for R. categorical data, mean and standard deviation (SD) Statistical analyses performed using Descriptive statistics to calculate frequency for normally distributed variables, or median and interquartile ranges (IQR) for non-normally distributions (number (n) and proportion (%)) for categorical data, mean and standard deviation distributed data were used to describe the general characteristics of the two groups. Univariate (SD) for normally distributed variables, or median and interquartile ranges (IQR) for non-normally analysis using χ2-test, t-test, or Mann-Whitney-U-test was performed to test differences in general distributed data were used to describe the general characteristics of the two groups. Univariate characteristics between age groups. analysis using χ2 -test,int-test, wasweekend performed test differences general Differences spatialor PAMann-Whitney-U-test patterns between week and daystowithin the two age in groups characteristics between age groups. were examined by using the total time spent in a setting and both an absolute (amount of MVPA in Differences in spatial PA patterns between week and weekend days within groups min) and relative (proportion of MVPA in %) outcome measure of MVPA, as the this two can age provide were examined by using the total time spent in a of setting andand both an absolute (amountspent of MVPA complementary information. Mean daily minutes total time MVPA that a participant in each setting were(proportion calculated as of outcomes for week and weekend days. From these values, in min) and relative MVPAseparately in %) outcome measure of MVPA, as this can provide complementary information. Mean daily minutes of total time and MVPA that a participant spent in each setting were calculated as outcomes separately for week and weekend days. From these values,
Sports 2016, 4, 36
6 of 17
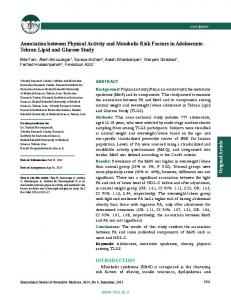
we further calculated the proportion of time spent in MVPA out of the total time spent in each setting separately for weekdays and weekends based on children who visited the corresponding setting. As these variables were not normally distributed, median and IQR were used to present the outcome measures stratified by age group. For the three outcomes and separated by age group, we conducted multilevel analyses based on individual scores across days and locations to provide results on differences between week and weekend days. Models were transformed by log transformation to fulfil the model assumptions and individuals and classes were included as random effects accounting for the hierarchical structure of the data [48]. To adjust for individual differences, sex, BMI, sports club membership, total matched wear time, weather conditions (mean temperature, sum of precipitation, and sum of sunshine duration), and socioeconomic characteristics (language spoken at home, highest parental education, parental income and nationality) were included as potential confounders, as these parameters may have an influence on children’s activity patterns [49,50]. A backward elimination algorithm with Akaike’s information criterion (AIC) as a goodness-of-fit measure was applied to test the contribution of the entered predictors and to determine the final models. For each model, we used a single-step method calculating interaction contrasts to investigate differences between week and weekend days across settings. Differences were provided by the transformed and adjusted p-values, which were calculated from F-tests based on Sattethwaite’s or Kenward-Roger approximation. 3. Results 3.1. General Characteristics A total of 86 second graders and 123 sixth graders out of 407 invited children provided consent and wore a measurement belt during one week. One second grader and two sixth graders returned a malfunctioning accelerometer, and one second grader lost both devices during the week. One further second grader had to be excluded due to illness which prevented him from engaging in routine everyday PA. Another 32 participants did not fulfil the inclusion criteria of at least one weekday and one weekend day with four full hours of matched data. Thus, the final study population consisted of 74 second and 98 sixth graders (Figure 3). Table 1 presents the general characteristics of the study population separated by age group. Participants wore the devices during a median time of 12.8 h per day at a median of seven days. During this time, valid GPS data was available for a median of 9.7 h per day, which is equal to a median of 77.2% of the total accelerometer wear time data. In total, children reached a median of five valid weekdays and two valid weekend days. The two age groups showed similar wear time characteristics and did not differ in relation to the available amount of daily combined data. Table 1. General characteristics of the study population, stratified by age. Characteristic
Second Graders
Sixth Graders
p-Value
Age in years, mean (SD) Gender, boys, n (%) Gender, girls, n (%) Body height in cm, mean (SD) Body weight in kg, median (IQR) BMI in kg/m´2 , median (IQR) Daily wear time in min, median (IQR) Daily combined data in min, median (IQR) Availability of GPS data in %, median (IQR) Wear days, median (IQR) Valid weekdays, median (IQR) Valid weekend days, median (IQR)
8.5 (0.3) 38 (51.4) 36 (48.6) 133.4 (5.6) 28.4 (25.6–32.1) 15.9 (15.1–17.5) 754.6 (702.6–799.5) 575.4 (493.4–621.6) 76.8 (68.6–84.6) 7.0 (7.0–7.0) 5.0 (5.0–5.0) 2.0 (2.0–2.0)
12.5 (0.4) 45 (45.9) 53 (54.1) 154.7 (7.7) 1 44.2 (38.2–53.8) 1 18.3 (16.5–20.7) 1 772.4 (727.1–810.4) 579.0 (498.6–659.7) 78.1 (68.1–86.8) 7.0 (7.0–7.0) 5.0 (4.0–5.0) 2.0 (2.0–2.0)