Gene 381 (2006) 24 – 33 www.elsevier.com/locate/gene
Differences in the pattern of evolution in six physically linked genes of Drosophila melanogaster Martina Žurovcová a,⁎, Andrey Tatarenkov b , Luděk Berec a a
Institute of Entomology, Czech Academy of Sciences and Faculty of Biological Sciences, University of South Bohemia, Branišovská 31, 370 05 České Budějovice, Czech Republic b Department of Ecology and Evolutionary Biology, University of California, 321 Steinhaus Hall, Irvine, CA 982697-2525, U.S.A. Received 29 January 2006; received in revised form 2 May 2006; accepted 1 June 2006 Available online 28 June 2006 Received by A. Bernardi
Abstract We describe DNA sequence polymorphisms at six loci (Acp26Aa, Acp26Ab, Acp29AB, Idgf1, Idgf3 and Ddc), all on the second chromosome of Drosophila melanogaster in one natural European population. Previous studies considering these loci separately showed that some of them were affected by natural selection. However, demographic processes or population admixture can produce footprints similar to natural selection. Simultaneous consideration of several genes may help to discern between selective and demography/admixture scenarios because the latter are expected to affect a majority of loci in a similar manner. Such an effect is not necessarily uniform among genes, but can be modified by rates of recombination and substitution. Since different evolutionary forces shaped the variation of the studied genes, our aim is to examine if their physical linkage could have affected the observed pattern. Fisher's conservative test of linkage disequilibrium is not significant. Lewontin's sign test pointed to linkage disequilibrium both within and between loci levels, though, none of the loci exhibits haplotype structure. Coupled with other results, the possibility of demography being the exclusive explanation for the observed variability is ruled out. © 2006 Elsevier B.V. All rights reserved. Keywords: DNA polymorphism; Demography; Linkage disequilibrium; Molecular evolution
1. Introduction Until now a number of studies dealing with multiple-loci screening from natural populations of Drosophila melanogaster have been conducted. Some of those studies were focused on general patterns of the demographic and selection history of natural populations (Glinka et al., 2003; Baudry et al., 2004; Orengo and Aguadé, 2004; Haddrill et al., 2005). Others were dedicated to more specific questions such as the relationship among linkage disequilibrium, recombination and gene conversion (Langley et al., 2000; Andolfatto and Wall, 2003), evolution Abbreviations: Acp26Aa, Accessory gland-specific peptide 26Aa; Acp26Ab, Accessory gland-specific peptide 26Ab; Acp29AB, Accessory gland-specific peptide29AB; Idgf1, Imaginal disc growth factor 1; Idgf3, Imaginal disc growth factor 3; Ddc, Dopa decarboxylase; Adh5′, 5′ end region of Alcohol dehydrogenase; PCR, polymerase chain reaction; bp, a base pair; kbp, a thousand base pairs; FET, Fisher's exact test; LD, linkage disequilibrium. ⁎ Corresponding author. Tel.: +42 38 777 5260; fax: +42 38 5310354. E-mail address:
[email protected] (M. Žurovcová). 0378-1119/$ - see front matter © 2006 Elsevier B.V. All rights reserved. doi:10.1016/j.gene.2006.06.011
of the particular group of proteins (Begun et al., 2000) or detecting the footprint of a selective sweep (Sáez et al., 2003). Studies of individual genes are bound to remain important if one is interested in intricacies of natural selection and its connection with the functional importance of the genes (Lazzaro and Clark, 2003). However, if genes are considered individually, the effects of natural selection can sometimes be difficult to disentangle from the effects of certain demographic processes or population admixture, which leave similar changes in nucleotide variation (Przeworski, 2002). Since demography should impact a majority of genes, while natural selection is more idiosyncratic, the simultaneous consideration of several genes is generally considered as a way to differentiate between these factors (Andolfatto and Przeworski, 2000; Glinka et al., 2003). The interaction of demographic processes with natural selection makes nucleotide variation even more complex. Accounting for linkage disequilibrium is a key area where a more detailed analysis can bring new insights (Nordborg and Tavaré, 2002). However, interaction of linkage disequilibrium and selection remains a contentious issue. Nurminsky et al. (2001)
M. Žurovcová et al. / Gene 381 (2006) 24–33
reported selection affecting linked loci over very large scale (two cytological divisions) and Sáez et al. (2003) recently detected recent selective sweep over 41–54 kbp, but Andolfatto et al. (1999) showed that a selection effect can decline quickly even within very close proximity of a selected region. Recently, several studies suggested that in non-African natural populations of D. melanogaster, the effect of demography is quite considerable (Andolfatto and Przeworski, 2000; Glinka et al., 2003; Baudry et al., 2004; Caracristi and Schlötterer, 2003; Ometto et al., 2005; and others). Although these studies made a huge contribution with respect to the elucidation of the history of both African and European populations, timing of the presumed bottleneck affecting the non-African populations is still unclear. Most of the analyses (Glinka et al., 2003; Ometto et al., 2005; Haddrill et al., 2005; Thornton and Andolfatto, 2006) were also based on a single sample from Netherlands, which means that the results may be specific to this particular population. Orengo and Aguadé (2004) actually showed that unlike the Netherlands population, the observed pattern in a population from Spain cannot be explained by a bottleneck scenario alone, even when using the same type of data (non-coding loci on X-chromosome). It was our aim to revise the previously published information and to extend the analyses in these previously unexplored directions. Our analysis uses genes from the left arm of the second chromosome, which have been recently screened for genetic variability: Acp26Aa, Acp26Ab (Aguadé, 1998), Acp29AB (Aguadé, 1999), Idgf1, Idgf3 (Žurovcová and Ayala, 2002), and Ddc (Tatarenkov and Ayala, unpublished). Studied from the same individuals of a single population (Montblanc, Spain), these loci provide a good opportunity for multiple locus comparisons. Some loci are closely localized; coding regions of Acp26Aa and Acp26Ab are separated just by ∼200 bp, and the loci of another pair, Idgf1 and Idgf3, are 4 kbp apart. On the other hand, 11 cytological bands (from 26A to 37D) containing about 10 Mbp separate the two most distant genes Acp26Aa and Ddc. Ddc is also one of the genes for which a considerable linkage disequilibrium was described both at the larger scale of 65 kbp (Aquadro et al., 1992) as well as at the shorter scale (Tatarenkov and Ayala, unpublished) within the gene. The genes have different functions and represent different evolutionary models. Acp26Aa and Acp26Ab encode for sexrelated peptide hormones (male accessory gland proteins). These loci are tightly linked in a region with a high recombination rate (clab =4.402× 10− 8 rec/bp/generation). Another locus, Acp29AB, belongs to the same functional family of male accessory gland proteins but does not show similarity to the other Acps (clab = 4.286 × 10− 8 rec/bp/generation). Development-related genes, Idgf1 and Idgf3 (imaginal disc growth factors), encode for proteins with growth promoting activity. They are members of a multigene family and localized in a region with a medium recombination rate (clab = 1.611 × 10− 8 rec/bp/generation). Ddc (dopa decarboxylase), whose protein product is involved in dopamine biosynthesis (neurotransmitter and cuticle formation), also belongs to a multigene family and is located in a region with the lower recombination rate (clab =0.774× 10− 8 rec/bp/generation). There are two goals in this study. By examining the variability at the previously screened autosomal genes, we aimed to get
25
additional insights by focusing on the linkage disequilibrium at the intralocus and interloci levels, with particular attention to the recombination rate issue. This goal is intertwined with the second task, which was to test the bottleneck hypothesis by combining the approach of Orengo and Aguadé (2004), whose sample also originated from Spain, and Lazzaro and Clark (2003), whose analysis of non-African population was based on autosomal loci. 2. Materials and methods 2.1. Data acquisition D. melanogaster data are from lines isogenic for the 2nd chromosome, derived from flies collected on Montblanc (Tarragona, Spain; Aguadé, 1998, 1999). Data for Acp26Aa and Acp26Ab (both n = 10) were from Aguadé (1998), Acp29 (n = 12) from Aguadé (1999), Idgf1 and Idgf3 (both n = 20) from Žurovcová and Ayala (2002) and Ddc (n = 15) from Tatarenkov and Ayala (unpublished). The sequences were either taken from GenBank (all Acp genes; alignments made de novo) or directly provided by the authors (Idgfs, Ddc; alignments as in the original publications). A summary of the screened lines in different studies is given in Supplementary Table 1. Sequences were edited and aligned both manually and with the assistance of the EditSeq and MegAlign programs (Lasergene package of programs from DNASTAR, Inc.). Physical locations of the individual genes were obtained from release 4.0 of the D. melanogaster genome available at FlyBase. Distance between the loci was estimated from their cytogenetical position and the cumulative parameter provided by the Recomb-Rate program (Comeron et al., 1999). The original population was cytogenetically inspected for the common inversions, which were found to be very low as expected for a European population (M. Aguadé, personal communication). Additionally, we inspected lines sequenced for Idgfs and Ddc for the presence of the In(2L)t inversion by the PCR-based method developed by Andolfatto et al. (1999). 2.2. Statistical analysis Basic population genetics parameters were obtained using DnaSP version 4.00 (Rozas et al., 2003). Nucleotide diversity π, the average number of nucleotide differences per site between two sequences, was estimated according to Nei (1987, Eqs. 10.5 or 10.6). The population mutation parameter θ (per site) was based on the number of segregating sites S (Watterson, 1975, Eq. 1.4a, but on a base pair basis; Nei, 1987, Eq. 10.3). Most of the neutrality tests were conducted using DnaSP version 4.00 (Rozas et al., 2003). DNA Slider (McDonald, 1998) was used to explore the heterogeneity in the polymorphism-todivergence ratio along the individual loci. We used the Combo software kindly provided by Lewontin to perform the Lewontin's test of linkage disequilibrium (Lewontin, 1995). The presence of possible gene conversion events was tested by Geneconv (Sawyer, 1999), and LDhat (McVean, 2004) was used for some parts of the recombination rate analysis.
M. Žurovcová et al. / Gene 381 (2006) 24–33
26
Table 1 Nucleotide diversity and neutrality tests of six loci of Drosophila melanogastera No. of lines
bp (gaps excluded) S (Syn, Repl) πtotal (per site) S.D. πsilent (per site) θtotal (per site) S.D. θsilent (per site) Hd(h) 95% C.I. Ktotal
Acp26Aa
Acp26Ab
Acp29AB
Idgf1
Idgf3
Ddc
10
10
12
20
20
15
1071 (1056) 21 (9,10) 0.0097 0.00090 0.0127 0.0070 0.00315 0.0095 0.978 (9) 0.867–1.00 0.1290
576 (576) 17 (7, 2) 0.0112 0.00175 0.0151 0.0104 0.00479 0.0147 0.956 (8) 0.778–1.00 0.0414
1771 (1747) 35 (10, 3) 0.0064 0.00126 0.0083 0.0066 0.00274 0.0089 0.909 (9) 0.924–1.00 0.1004
2032 (1905) 69 (43, 9) 0.0129 0.00056 0.0236 0.0102 0.00361 0.0189 0.989 (18) 0.926–0.995 0.0475
2427 (2364) 64 (18, 8) 0.0085 0.00068 0.0138 0.0076 0.00271 0.0117 0.979 (17) 0.932–0.995 0.0476
2061 (2585) 37 (7, 1) 0.0038 0.00082 0.0062 0.0044 0.00172 0.0073 0.971 (12) 0.876–0.991 0.0442
S, number of polymorphic sites; π, nucleotide diversity; θ, Watterson estimator; Hd, haplotype diversity; h, number of haplotypes; S.D., standard deviation; C.I., confidence interval. Divergence Ktotal is the average number of nucleotide differences per site between D. melanogaster and D. simulans (Nei, 1987), calculated for the whole sequenced regions. Calculations were done with DnaSP4.0 (Rozas et al., 2003). a
In all statistical analyses, indels as well as complex nucleotide substitutions were excluded. When the choice was given, calculations were conditioned on the number of segregating and parsimony informative sites. Since there was evidence for recombination in our data, coalescent simulations implementing the recombination parameter C were conducted to obtain confidence intervals for some statistics and significance of neutrality tests. The simulations were conditioned on the number of segregating sites S and 10,000 replicates. We derived Clab = 2Nc (the original formula C = 4Nc divided by 2 to account for the lack of recombination in males, as explained in Przeworski et al., 2001) from laboratory measurements of the exchange of flanking markers (Comeron et al., 1999) and effective population size Ne = 3 × 10⁵ (Aquadro et al., 2001, Glinka et al., 2003). We considered such a value of Ne to be more appropriate for a local population than the higher values suggested elsewhere, since it provided more conservative limits in coalescent simulations (relative to higher population sizes). Laboratory based estimates of c were most likely underestimates since they are based only on crossing over, which did not account for gene conversion (Andolfatto and Nordborg, 1998). Importantly, the estimates of Clab were conservative values independent of the observed sequence variation at loci under consideration. In addition to the tests of neutrality performed on individual loci, multilocus HKA, Tajima's D (Tajima, 1989) and Fu and Li's (Fu and Li, 1993) D tests were conducted with the use of the program HKA provided by J. Hey (http://lifesci.rutgers.edu/~heylab). Relationships between haplotypes were examined using the Neighbor-Joining (NJ) trees constructed in MEGA2 (Kumar et al., 2001), using Kimura's two-parameter distance. Bootstrap values were produced from 10,000 replicates. We did not use character-based analyses, as the presence of recombination in intraspecific data sets can be misinterpreted as homoplasy by parsimony or maximum-likelihood methods (Posada and Crandall, 2002; Baudry et al., 2004). To test whether the bottleneck accompanying the spread of D. melanogaster out of its original African habitat (David and Capy, 1988) was sufficient to explain departures from neutrality
measured by Tajima's D and Fay and Wu's H (Fay and Wu, 2000), we explored five models of population founding accompanied by reduction in population size and subsequent growth of population size. We used coalescent simulator “ms” (Hudson, 2002). In all models, we used the recombination rate Clab and 10,000 coalescent simulations. Since there has been an ongoing debate about the exact time and strength of the bottleneck, we have chosen to use the parameters that are most relevant to our data. Bottleneck scenarios B1 to B3 were based on the best fitting models of Lazzaro and Clark (2003) who inspected a derived population by the use of autosomal loci; and scenarios B4 and B5 are similarly based on the models by Orengo and Aguadé (2004) who studied a Spanish population. All scenarios assumed the following sequence of events: an ancestral population of size Nanc drops to bottleneck size Nbot. That population remains at this size for L generations, and then exponentially grows to it current size Ne. The Ne of the original (ancestral) population was set to 106 for all the simulations, while Ne of the derived (recent) one was 3 × 10⁵. Five different combinations of those parameters were tested. Additionally, a null model of panmixia with recombination taken into account was explored as well. To detect the overall pattern across the loci, Fisher's combined probability (Sokal and Rohlf, 1995) was calculated. For each gene, separate analyses were done based on whole regions, as well as on the non-coding parts, in order to differentiate the possible selective forces from the demography effects. 3. Results Contrary to the previous cytogenetical inspection, 3 lines out of 20 (15%, lines numbered 48, 52 and 63) showed the In(2L)t inversion, which is more than original estimate of about 5% (M. Aguadé, personal communication). A summary of the nucleotide variability and divergence is presented in Table 1. Almost all the genes show a much higher total polymorphism than the average observed in D. melanogaster, having a πtotal = 0.00443 (Moriyama and Powell, 1996), with the exception of Ddc, with a lower value of πtotal = 0.0038.
M. Žurovcová et al. / Gene 381 (2006) 24–33
27
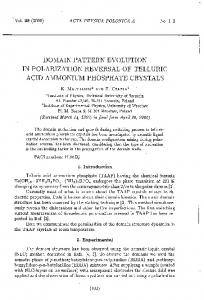
Fig. 1. Combined chart of pattern of polymorphism and divergence. The plot of polymorphism and divergence refers to left y-axis and was generated in DnaSP 4.00 on the total variability. The size of sliding window is 100 sites and step is 25 sites; gaps were excluded. (A–E) Sliding window plots of total polymorphism (π) and total divergence with Jukes and Cantor corrections (K). Sliding window plot of polymorphism-to-divergence ratio across the loci generated in DNA Slider refers to the right y-axis. Only silent variability was used. The size of sliding window is 15 differences (polymorphisms and fixed differences). Loci with significant (P b 0.05) heterogeneity in the polymorphism-to-divergence ratio as detected by the McDonald tests are presented in green, others in red. In schematic of individual genes, boxes represent coding regions, horizontal lines represent non-coding regions. D. simulans was used for the divergence estimates.
Nevertheless, θtotal exceeds the average D. melanogaster value of 0.00441 only in Acp26Ab, Idgf1 and Idgf3. Haplotype diversity is also high, but within the range of neutral expectations (none of the values exceeds 95% confidence interval limits). Distribution of polymorphisms is mostly paralleled by the distribution of divergence across the individual loci (Fig. 1). However, there is considerable heterogeneity in the polymorphism to divergence ratio with respect to different parts of the Acp26Aa, Acp26Ab, Idgf1 and Ddc genes, as proven by the McDonald tests applied to silent variation (Fig. 1). These tests (McDonald, 1996, 1998) are designed to identify genes with more heterogeneity in the polymorphism-to-divergence ratio than expected under a
neutral model. While the peak of high polymorphism can be a sign of balancing selection, the reverse pattern, i.e. an area of low polymorphism, is more likely due to selective sweep. 3.1. Tests of neutrality Tests of neutrality differ in their power to detect different types of selection, and thus we applied several of the most commonly used tests. Table 2 summarizes the results, with a suggestion of the possible evolutionary model based on all the evidence collected. Most of the results corroborate the previous outcomes, but some discrepancies could be observed due to which approach was applied.
M. Žurovcová et al. / Gene 381 (2006) 24–33
28 Table 2 Tests of neutralitya Test
Acp26Aa
Acp26Ab
Acp29AB
Idgf1
Idgf3
Ddc
Ka/Ks HKA (silent sites, P value) Tajima's D Fu and Li's D (outgroup) Fay and Wu's H Strobeck's S Pattern of nucleotide variability Mode of evolution
0.860 ns 1.806⁎⁎ 1.840⁎⁎ − 3.733 ns 0.968 excess of fixed nonsyn. changes positive directional selection
0.306 0.0451⁎ 0.354 ns 0.003 ns 0.711 ns 0.942 neutral
0.270 ns − 0.142 ns 0.199 ns − 9.667 ns 0.758 excess of fixed nonsyn. changes positive and balancing selection
0.081 ns 1.057⁎ 1.652⁎⁎ 0.526 ns 0.983 excess of syn. polymorphisms balancing selection
0.078 ns 0.473 ns 0.483 ns − 3.884 ns 0.966 neutral
0.006 ns − 0.587 ns − 0.841 ns − 7.981⁎ 0.967 excess of high-frequency derived alleles hitchhiking
neutral
neutral
a
DnaSP4.0 (Rozas et al., 2003) was used for all tests. D. simulans served as an outgroup and for divergence estimates. Adh 5′ was used in HKA as a reference neutral locus. HKA, Hudson et al. (1987); C.I., confidence interval; ⁎P b 0.05. ⁎⁎P b 0.01. Conclusion about the mode of evolution is based upon overall evidence (see text for details).
The Ka/Ks ratio is the most conservative index, showing adaptive selection between species if it is greater than 1. Such high ratio was previously detected for Acp26Aa (Tsaur and Wu, 1997) when the comparisons were made for the melanogaster/simulans and yakuba/teissieri species, using only the second exon and the 3′ end in the analysis. Our result for the whole gene, based on the comparison of melanogaster vs. simulans, was not significant, although the Ka/Ks ratio was the highest among the inspected loci. McDonald and Kreitman's (1991) test was applied to the coding parts of the genes. The results, such as the excess of nonsynonymous fixed differences in Acp26Aa and Acp29AB while being not significant in all the other loci (data not shown), supported the previous conclusion that Acp26Aa and Acp29AB are under positive adaptive selection. The Hudson-KreitmanAguadé test (1987) was conducted on the silent variation using the canonical Adh5′ as a neutral counterpart. HKA was not significant in all but one locus, Acp26Ab, where its significance was only marginal and could be due to chance or be biased by the shortness of this gene (only 576 bp). MK and HKA tests for heterogeneity are considered to be very conservative, as the null model assumes no recombination within loci.
Table 3 Summary of bottleneck simulations by the Fisher's combined probabilities across six loci (see Supplementary Table 2 for the full results) Panmixia
B1a
B2a
B3a
B4a
B5a
0.010 0.105
0.940 0.827
0.803 0.597
2.56 × 10⁻¹¹ 5.11 × 10⁻¹¹
0.922 0.800
0.949 0.843
Fay and Wu's H b Total 0.009 Non-coding 0.110
0.809 0.869
0.278 0.324
8.94 × 10⁻¹³ 3.55 × 10−08
0.821 0.860
0.791 0.802
Tajima's Db Total Non-coding
a Scenarios of bottleneck tested in this study. Time of the bottleneck occurrence before present tbot and time L that bottleneck lasted before population began to grow are given in number of generations, effective population size during the bottleneck Nbot is given in number of individuals. B1: tbot = 500, Nbot = 100, L = 100; B2: tbot = 2000, Nbot = 100, L = 100; B3: tbot = 50000, Nbot = 100, L = 100; B4: tbot = 30000, Nbot = 100000, L = 10000; B4: tbot = 60000, Nbot = 100000, L = 10000. b Tajima's D, double-sided test; Fay and Wu's H, left-sided test. Significant values are in bold.
Tajima's D (1989), Fu and Li's D (with outgroup, 1993) and Fay and Wu's H (2000) are tests based on a frequency spectrum. Acp26Aa and Idgf1 have positive values for both Tajima's D and Fu and Li's D, thus suggesting balancing selection or population subdivision. These results appear to be different from the previous findings, although the tests were originally applied without assuming recombination (Aguadé, 1998, 1999) or only on the genes without the non-coding 5′ and 3′ ends. (Žurovcová and Ayala, 2002). Strobeck's S (Strobeck, 1987) value is based on the haplotype frequency distribution, with the null hypothesis that the population is panmictic. The alternative hypothesis of population subdivision is not accepted in any of the loci, since S values (the probability of obtaining a sample with the number of haplotypes smaller or equal to the observed value) range from 0.758 (Acp29AB) to 0.983 (Idgf1). The multilocus HKA test yielded a marginally significant result (χ2 = 10.64, df = 5, P = 0.059) using total variation. Contribution to the overall χ2 value varied among loci: thus, three loci, Acp26Aa, Acp26Ab, and Idgf1, accounted for 76% of the χ2 value. Of these three loci, Acp26Ab and Idgf1 showed an excess of polymorphism, whereas Acp26Aa showed a deficiency in polymorphism. However, result was not significant when based on variation in the non-coding regions only. Additional multilocus tests were based on the mean and variance of Tajima's D and Fu and Li's D statistics. Multilocus tests of means and variances of Tajima's D values were both not significant, but approaching significance in the former test (mean D = 0.493, P = 0.056). In multilocus tests based on mean and variance of Fu and Li's D, only the former test was significant (mean D = 0.556, P b 0.05). The significance of the results in both tests were likely explained by contributions from Acp26Aa and Idgf1, which have noticeably higher D values than rest of the loci (Table 2). 3.2. Demography modelling Demographic structure may have caused departures of Tajima's D and Fay and Wu's H from the neutral panmictic null expectations (Przeworski, 2002). In accordance with the distribution of D. melanogaster from its place of origin (David
M. Žurovcová et al. / Gene 381 (2006) 24–33 Table 4 Tests of linkage disequilibrium by Lewontin (1995) for individual locia Summed G P values
Sign D test Neg(Tot)
All sites
Singletons excluded
All sites
Acp26Aa Acp26Ab
0.001 0.194
0.001 0.133
9 (20) 5 (16)⁎
Acp29AB Idgf1 Idgf3 Ddc
7 × 10− 4 0.002 0.003 2 × 10− 4
0.021 0.007 0.004 0.210
9 (34)⁎⁎⁎ 44 (68) 35 (63) 14 (36)⁎⁎⁎
Table 5 Tests of linkage disequilibrium by Lewontin (1995) for pairwise comparisonsa
Conclusion
Singletons excluded 9 (20) 1 (7) 1 38 17 4
(16)⁎⁎⁎ (57)⁎ (36) (13)
complex weak tendency toward PA LD, PA LD, NA complex LD, PA
a
See Section 3.2 for details. Summed G, G value with William's correction; Neg(Tot), number of negative (total) pairs. Conclusions are based on overall consideration of four tests: LD, detected linkage disequilibrium; PA, positive association; NA, negative association; ⁎⁎⁎P b 0.001; ⁎⁎P b 0.01; ⁎P b 0.05.
and Capy, 1988), we tested the observed values of D and H under various models of bottleneck. Only one out of five scenarios conflicted with our data (Table 3 and Supplementary Table 2), which was the ancient and rather severe bottleneck. This pattern held for the whole sequenced regions as well as the non-coding parts. A model without bottleneck fits the observed data in non-coding parts, too, while it is significant for both the Tajima's D and Fay and Wu's H evaluated for the whole loci. 3.3. Linkage disequilibrium The initial analyses were conducted with pairwise comparisons and Fisher exact test (FET), with or without Bonferroni correction (see Supplementary Table 3). Within individual loci, the FET found considerable linkage (after Bonferroni correction) only in the Idgf1 locus. Among the loci, none of the comparisons yielded significant results. However, the sample size was too small (ranging from n = 5 for Ddc vs. Acp26Aa and Acp26Ab to n = 20 for the Idgf1 vs. Idgf3 comparison, see Supplementary Table 3), for this test to be valid. Since the FET was a conservative test (with limited sensitivity), we also performed the Lewontin's sign tests designed to overcome bias due to asymmetrical allele frequencies. The first (summed G) test evaluated overall linkage disequilibrium in the region. The procedure of the second (sign D) test was designed to uncover a potential general bias toward a negative or positive association. Lewontin showed that classes of pairs of sites with rare alleles (e.g. singletons) were able to detect coupling disequilibria but not to detect repulsion disequilibria. If no genuine coupling disequilibrium was present in the sample, the presence of classes with rare alleles may obscure the detection of the repulsion disequilibrium. In order to increase the capacity to detect negative associations (i.e. repulsions), the summation of G values, or numbers of pairs of a certain sign, can be conducted for classes of sites with a more even distribution of allele frequency, i.e. omitting pairs of sites with a few copies of alleles. In our case, we omitted classes with pairs of sites having singletons (in addition to using all classes). Lewontin's tests uncovered some interesting aspects that were contrary to the FET. At the intralocus level (Table 4), each locus actually exhibited a certain degree of linkage. While the Acp26Aa and Idgf3 patterns were complex, positive associa-
29
Acp29AB/Ddc Acp26Aa/ Idgf1 Acp26Ab/ Idgf1 Acp29AB/ Idgf1 Acp29AB/ Idgf3 Acp26Ab/Ddc Idgf1/Ddc Idgf3/Ddc Idgf1/Idgf3 Acp26Aa/ Acp29AB Acp26Ab/ Idgf3 Acp26Ab/ Acp29AB Acp26Aa/Ddc Acp26Aa/ Idgf3 Acp26Aa/ Acp26Ab
Summed G P values
Sign D Neg(Tot)
All sites
All sites
Singletons excluded
Conclusions
Singletons excluded
4.06 × 10⁻¹⁴ 5.97 × 10⁻⁴ 16 (65) 9.62 × 10⁻¹¹ 1.35 × 10⁻⁹ 38 (76)
3 (20) 22 (55)
PA NS
4.08 × 10⁻¹⁰ 9.74 × 10⁻⁹ 30 (69)
15 (47)
NS
39 (102) 16 (49)
PA
5.5 × 10⁻⁸
1.5 × 10⁻⁴
1.06 × 10⁻⁷
1.02 × 10⁻³ 36 (95)
9.08 × 10⁻⁷ 7.35 × 10⁻⁶ 1.55 × 10⁻⁵ 2.47 × 10⁻⁵ 3.30 × 10⁻⁵
0.35 0.01 0.03 3.39 × 10⁻⁴ 3.51 × 10⁻³
5.67 × 10⁻⁵
4.32 × 10⁻³ 15 (56)
6 (33)
PA
5.78 × 10⁻⁵
0.06
1 (8)
PA
6.88 × 10⁻⁵ 1.32 × 10⁻⁴
0.65 11 (34) 6.56 × 10⁻³ 23 (63)
5 (14) 13 (41)
NS PA
0.05
0.03
10 (27)
NS
8 (40)
PA
7 (29) 1(7) 54 (103) 36 (66) 44 (98) 18 (50) 80 (132) 55 (93) 12 (44) 2 (20)
PA NS PA NS PA
12 (36)
14 (37)
a
See Section 3.2 for details. Summed G, P values given for G with William's correction. Numbers in bold denote results that remain significant after sequential Bonferroni correction. Neg(Tot), number of negative (total) pairs. Conclusions are based on overall consideration of four tests: PA, positive association; NS, non-significant.
tions were detectable for Acp29AB and Ddc. The most revealing was the Idgf1 locus, where a negative association could be also a sign of selection. Positive associations were also detectable among the loci (Table 5), with 9 significant comparisons out of 15. This association could not relate to the physical distance, as LD between the closest loci, Acp26Aa and Acp26Ab, was not significant, while it was significant between the more distant Acp26Aa and Idgf3. However, this result could be affected by intralocus linkage disequilibrium.
Table 6 Empirically observed values of ZnS and their exact probabilities under different recombinational scenarios Locus
ZnS
nra
Claba
RHa
Acp26Aa Acp26Ab Acp29AB Idgf1 Idgf3 Ddc Combined probabilityb
0.278 0.206 0.243 0.151 0.215 0.156
0.626 0.859 0.676 0.845 0.553 0.910 0.988
0.081 0.581 0.018 0.337 0.018 0.713 0.014
0.076 0.301 0.380 0.028 0.005 0.853 0.006
a For comparisons, neutral panmictic process was simulated with no recombination (nr), laboratory estimate Clab and Hudson's estimate (Hudson, 1987) of recombination RH calculated from the observed data. Significant values are in bold. b Fisher's combined probability (Sokal and Rohlf, 1995, pp.794–797) across all loci.
M. Žurovcová et al. / Gene 381 (2006) 24–33
30
different calculation methods. The only estimate not based on nucleotide variation of our data set was Clab, which was derived from laboratory measurements and polynomial fitting (see Materials and methods). It was usually considered a lowerbound limit and therefore conservative for further analysis. In addition to utilizing effective population size Ne = 3 × 10⁵, we included the value calculated with commonly used Ne = 106. We also estimated recombination parameters based on the observed data RH (Hudson, 1987), RW (Wakeley, 1997) and Rho (as implemented in LDhat by McVean, 2004). As can be seen in Table 7, the likelihood-based estimate Rho was very different from the others in respect to Acp29AB, Ddc and Acp26ab. The laboratory-based estimate of recombination rate was considered to be lower than the real value, as it did not account for possible gene conversion events. Therefore, the Sawyer method (Sawyer, 1989) was used to detect gene conversion events at the intralocus level. Based on the aligned DNA sequences and distribution of polymorphisms, this method determined whether some regions of a pair of sequences were sufficiently similar to be suggestive of past gene conversions. We did not find any evidence for gene conversion at the Acp29AB locus, while all the rest had significant results, indicating this did occur. The most striking was probably the value observed for Idgf3, where 23 gene conversion fragments were detected. Such a high number of fragments were probably in accordance with the neutrality of this locus. However, the second highest score of 13 fragments was found in Idgf1. In this gene, a balancing selection was indicated in a small region of 151 bp, which was spanned by all the gene conversion fragments (ranging in length from ∼600 bp to 1200 bp).While Andolfatto and Nordborg (1998) concluded that at intragenic distances, gene conversion was more important than recombination in breaking down possible linkage among sites, in Idgf1 the crossing over broke down the linkage and the gene conversion counteracted by preserving the selected region. When compared to Hudson and Kaplan's (1985) estimate of minimum recombination events Rmin,
We used linear regression to examine the relationship of linkage disequilibrium measured by the r2 parameter (Hill and Robertson, 1968, estimated by DnaSP 4.00) and physical distance (in kbp). As expected, linkage disequilibrium decreased with physical distance; parameter b (slope) in the linear regression ranges from − 1.709 (goodness-of-fit r2 = 0.3703) for Acp26Ab to − 0.0950 for Idgf1 (goodness-of-fit r2 = 0.0568). Excess linkage disequilibrium can be also measured by the ZnS statistical formula (Kelly, 1997), which was based on the sum of r2 across all pairs of sites in the sample. This parameter was not significant when the critical values were determined by simulations assuming no recombination. However, when Clab or Hudson's estimate of recombination RH was considered, the ZnS became significant for Acp29AB and Idgf3, and the overall tendency toward an excess of LD was observed (Table 6). Linkage disequilibrium may also be due to partitioning of haplotypes into distinct classes. Despite the high number of haplotypes and haplotype diversity, we explored this relationship by constructing NJ trees for individual loci. Whether conducted on silent sites or whole sequenced regions, none of the analyses yielded well outlined clusters (data not shown). In general, if present in the population, inversions can also create an excess of LD. In our sample, which was cytogenetically inspected by the researchers who established the original isogenic lines; there was little evidence of inversion (Aguadé, personal communication). We also tested the available DNA for the presence of In(2L)t, which could be the only one common inversion with some impact on the Acp genes. We found the inversion only in three lines in the sample screened for Idgf1, Idgf3 (two of them overlap with the Ddc sample, one of which also overlaps with the Acp29AB sample). 3.4. Recombination and gene conversion To obtain the most accurate estimate of recombination rate parameter R for the coalescent simulations, we used several Table 7 Recombination analysis bp (no gaps/gaps)
Cytological map position clab (%rec/bp/gen)a Clab (per gene)b Ne = 3 × 10⁵ Ne = 106 RH (per gene)c RW (per gene)d Rho (per gene)e Rminf Gene conversion No. of fragments (P value)
Acp26Aa
Acp26Ab
Acp29AB
Idgf1
Idgf3
Ddc
1071/1056
576/576
1771/1747
2032/1905
2427/2364
2601/2585
26A 4.402 × 10− 8
26A 4.402 × 10− 8
29B 4.286 × 10− 8
36A 1.611 × 10− 8
36A 1.611 × 10− 8
37C 0.774 × 10⁻⁸
27.90 92.97 30.0 25.66 23.00 3
15.21 50.71 35.7 27.48 50.00 4
44.93 149.75 8.7 5.46 50.00 5
18.41 61.38 48.0 44.64 39.00 16
22.85 76.17 31.3 27.75 30.00 11
12 40.02 5.1 2.56 70.00 8
3 (0.023)
2 (0.023)
0
13 (0.001)
23 (0.000)
8 (0.002)
Gene conversion was estimated by the method of Sawyer (1999) with the program GenConv. a clab from RecombRate (Comeron et al., 1999). b Clab = 2 × Ne × clab × length of the locus (in bp). c From DnaSP 4.00, Hudson (1987). d From LDhat, Wakeley (1997). e From LDhat, McVean (2004). f Minimum number of recombination events, Hudson and Kaplan (1985).
M. Žurovcová et al. / Gene 381 (2006) 24–33
the number of gene conversion fragments was more or less equal to that value, so the effect of crossing over and gene conversion was likely very complex and could be different for different loci. 4. Discussion and conclusions When studying the evolutionary history of a gene, there is a possibility that departures from the neutral pattern of variation is caused by demographical events rather than by selective forces. Screening more loci than one should help to resolve this question, as demographic processes are supposed to affect the whole genome in a similar fashion. On the contrary, if the genes are influenced by selection as well, the resulting pattern becomes more complex. Recently, several studies describe the recent history of nonAfrican samples, which presumably underwent reduction in genetic variability due to a bottleneck or selection during adaptation to a new environment (Andolfatto and Przeworski, 2000; Glinka et al., 2003; Lazzaro and Clark, 2003; Baudry et al., 2004; Caracristi and Schlötterer, 2003; Orengo and Aguadé, 2004; Veuille et al., 2004; Ometto et al., 2005). Yet another scenario is that non-African populations can be an admixture of several populations, which can result in an increased level of linkage disequilibrium. In this case, we should see well-defined group of haplotypes in all loci. Haplotype structure created by admixture is probably harder to detect at the loci affected by selection than at neutral loci, although in many cases the haplotype structure is found in the loci under selection (Balakirev et al., 1999; Balakirev and Ayala, 2004; Baudry et al., 2004). It was our aim to revisit data taken from one Spanish population in the light of the newly detected patterns. By adding new analysis on linkage disequilibrium and simulations of bottleneck, we wanted to see whether there are common features of variation attributable to demography, or if their signatures were obliterated by the idiosyncrasies of natural selection. Although four of the six inspected loci were under some form of selection, the effect of demography should be preserved in the two neutral loci (Acp26Ab and Idgf3). Both of them failed to reveal selection, but results such as the positive Tajima's D could be a sign of population structure. However, since linkage disequilibrium was only partially preserved in the loci from this particular population, there was no clear haplotype structure that would support the demographic explanation. High haplotype diversity as well as the high number of haplotypes also contradicted this scenario. The pattern observed on the two neutral loci (Acp26Ab and Idgf3) was similar to that described by Veuille et al. (2004), who found that a local population from France was a panmictic unit without substructure. The possibility of non-European populations being formed by admixture of the ancestral was also explored by Andolfatto and Przeworski (2000) and discussed by Teeter et al. (2000), but in both cases the conclusions were against this simple explanation. On the other hand, several simulations of demography showed that various bottlenecks could also create the observed pattern. The only scenario which significantly disagreed with the
31
data was modelled as an ancient and rather severe bottleneck. The conclusion was that effects of demography or population admixture were not readily observed — either due to a high recombination, or selection, or specific conditions of this particular local population. We expected that population admixture (or other processes affecting whole population) would affect all genes similarly, after adjustments for differences in the rates of recombination and substitution. Nevertheless, we failed to find convincing evidence for similar changes in the loci inspected. Instead, nucleotide patterns were highly variable among genes. Unfortunately, since it is still not well known about the exact role of the Idgf1 and Idgf3 in the organism, it is impossible to try to connect the observed patterns to function of the loci. We thus conclude that variations in selective pressure on genes (from negative to absence of selection to positive) are the primary reason behind those departures from neutrality that we detect, although part of the variability can be due to the bottleneck. This is bringing more evidence for the results of the previous studies focusing on detecting the selection (Aguadé, 1998, 1999; Žurovcová and Ayala, 2002; Tatarenkov and Ayala, unpublished). On the other hand, since our findings about the bottleneck explanation are in accordance of those by Orengo and Aguadé (2004), it appears that the demography in European populations may not be as simple as suggested by other authors (Glinka et al., 2003; Ometto et al., 2005; Haddrill et al., 2005; Thornton and Andolfatto, 2006). Recombination still remains an open issue, since the significance of these tests is dependent on some preset recombination values. Even when taken from laboratory measurements, the value of C can be biased by the chosen Ne. Another discrepancy is seen in the empirical estimates of R based on a pattern of nucleotide variation, which are quite different when obtained by various methods suggested in the literature (Stumpf and McVean, 2003). Tests for gene conversion should also be implemented in future analysis, since we found evidence for it in five out of the six loci. Here, when Acp26Ab is excluded for its shortness, the neutral gene Idgf3 has twice as much gene conversion observed than crossing-over events (measured by Rmin). This pattern is in accordance with the conclusions of Andolfatto and Nordborg (1998), while the loci under selection have the extent of gene conversion equaled by the crossing over, which is in accordance with the observations of Langley et al. (2000). Acknowledgments We thank R. Lewontin, J. Hey and G. McVean for sharing their software and D. Filatov, H. Hashimi, B. Tlougan and two anonymous reviewers for discussion and helpful comments. This work was supported by Grant No. 204/03/1383 of the Grant Agency of the Czech Republic (Prague) to M.Ž. and Research Center Program of the Czech Ministry of Education (LC06077). M.Ž. and L.B. also acknowledge funding by the Institute of Entomology (Z50070508) and MŠMT ČR (MSM6007665801). Appendix A. Supplementary data Supplementary data associated with this article can be found, in the online version, at doi:10.1016/j.gene.2006.06.011.
32
M. Žurovcová et al. / Gene 381 (2006) 24–33
References Aguadé, M., 1998. Different forces drive the evolution of the Acp26Aa and Acp26Ab accessory gland genes in the Drosophila melanogaster species complex. Genetics 150, 1079–1089. Aguadé, M., 1999. Positive selection drives the evolution of the Acp29AB accessory gland protein in Drosophila. Genetics 152, 543–551. Andolfatto, P., Nordborg, M., 1998. The effect of gene conversion on intralocus associations. Genetics 148, 1397–1399. Andolfatto, P., Przeworski, M., 2000. A genome-wide departure from the standard neutral model in natural populations of Drosophila. Genetics 156, 257–268. Andolfatto, P., Wall, J.D., 2003. Linkage disequilibrium patterns across a recombination gradient in African Drosophila melanogaster. Genetics 165, 1289–1305. Andolfatto, P., Wall, J.D., Kreitman, M., 1999. Unusual haplotype structure at the proximal breakpoint of In(2L)t in a natural population of Drosophila melanogaster. Genetics 153, 1297–1311. Aquadro, C.F., Jennings Jr., R.M., Bland, M.M., Laurie, C.C., Langley, C.H., 1992. Patterns of naturally occurring restriction map variation, Dopa decarboxylase activity variation and linkage disequilibrium in the Ddc gene region of Drosophila melanogaster. Genetics 132, 443–452. Aquadro, C.F., DuMont, V.B., Reed, F.A., 2001. Genome-wide variation in the human and fruitfly: A comparison. Curr. Opin. Genet. Dev. 11, 627–634. Balakirev, E.S., Ayala, F.J., 2004. Nucleotide variation in the tinman and bagpipe homeobox genes of Drosophila melanogaster. Genetics 166, 1845–1856. Balakirev, E.S., Balakirev, E.I., Rodríguez-Trelles, F., Ayala, F.J., 1999. Molecular evolution of two linked genes, Est-6 and Sod, in Drosophila melanogaster. Genetics 153, 1357–1369. Baudry, E., Viginier, B., Veuille, M., 2004. Non-African populations of Drosophila melanogaster have a unique origin. Mol. Biol. Evol. 21, 1482–1491. Begun, D.J., Whitley, P., Todd, B.L., Waldrip-Dail, H.M., Clark, A.G., 2000. Molecular population genetics of male accessory gland proteins in Drosophila. Genetics 156, 1879–1888. Caracristi, G., Schlötterer, C., 2003. Genetic differentiation between American and European Drosophila melanogaster populations could be attributed to admixture of African Alleles. Mol. Biol. Evol. 20, 792–799. Comeron, J.M., Kreitman, M., Aguadé, M., 1999. Natural selection on synonymous sites is correlated with gene length and recombination in Drosophila. Genetics 151, 239–249. Fay, J.C., Wu, C.I., 2000. Hitchhiking under positive Darwinian selection. Genetics 155, 1405–1413. Fu, Y.X., Li, W.H., 1993. Statistical tests of neutrality of mutations. Genetics 133, 693–709. Glinka, S., Ometto, L., Mousset, S., Stephan, W., De Lorenzo, D., 2003. Demography and natural selection have shaped genetic variation in Drosophila melanogaster: A multi-locus approach. Genetics 165, 1269–1278. Haddrill, P.R., Thornton, K.R., Charlesworth, B., Andolfatto, P., 2005. Multilocus patterns of nucleotide variability and the demographic and selection history of Drosophila melanogaster populations. Genome Res. 15, 790–799. Hill, W.G., Robertson, A., 1968. Linkage disequilibrium in finite populations. Theor. Appl. Genet. 38, 226–231. Hudson, R.R., 1987. Estimating the recombination parameter of a finite population model without selection. Genet. Res. 50, 245–250. Hudson, R.R., 2002. Generating samples under a Wright-Fisher neutral model of genetic variation. Bioinformatics 18, 337–338. Hudson, R.R., Kaplan, N.L., 1985. Statistical properties of the number of recombination events in the history of a sample of DNA sequences. Genetics 111, 147–164. Hudson, R.R., Kreitman, M., Aguadé, M., 1987. A test of neutral molecular evolution based on nucleotide data. Genetics 116, 153–159. Kelly, J.K., 1997. A test of neutrality based on interlocus associations. Genetics 146, 1197–1206. Kumar, S., Tamura, K., Jakobsen, I.B., Nei, M., 2001. MEGA2: Molecular evolutionary genetics analysis software. Bioinformatics 17, 1244–1245. Langley, C.H., Lazzaro, B.P., Phillips, W., Heikkinen, E., Braverman, J.M., 2000. Linkage disequilibria and the site frequency spectra in the su(s) and su (wa) regions of Drosophila melanogaster X chromosome. Genetics 156, 1837–1852.
Lazzaro, B.P., Clark, A.G., 2003. Molecular population genetics of inducible antibacterial peptide genes in Drosophila melanogaster. Mol. Biol. Evol. 20, 914–923. Lewontin, R.C., 1995. The detection of linkage disequilibrium in molecular sequence data. Genetics 140, 377–388. McDonald, J.H., 1996. Detecting non-neutral heterogeneity across a region of DNA sequence in the ratio of polymorphism to divergence. Mol. Biol. Evol. 131, 253–260. McDonald, J.H., 1998. Improved tests for heterogeneity across a region of DNA sequence in the ratio of polymorphism to divergence. Mol. Biol. Evol. 15, 377–384. McDonald, J.H., Kreitman, M., 1991. Adaptive protein evolution at the Adh locus in Drosophila. Nature 351, 652–654. McVean, G., 2004. LDhat: A package for the population genetic analysis of recombination. Department of Statistics, Oxford. www.stats.ox.ac.uk/ ~mcvean/LDhat.html. Moriyama, E.N., Powell, J.R., 1996. Intraspecific nuclear DNA variation in Drosophila. Mol. Biol. Evol. 13, 261–277. Nei, M., 1987. Molecular Evolutionary Genetics. Columbia University Press, New York. Nordborg, M., Tavaré, S., 2002. Linkage disequilibrium: What history has to tell us. Trends Genet. 18, 83–90. Nurminsky, D., Aguiar, D.D., Bustamante, C.D., Hartl, D.L., 2001. Chromosomal effects of rapid gene evolution in Drosophila melanogaster. Science 291, 128–130. Ometto, L., Glinka, S., De Lorenzo, D., Stephan, W., 2005. Inferring the effects of demography and selection on Drosophila melanogaster populations from a chromosome-wide scan of DNA variation. Mol. Biol. Evol. 22, 2119–2130. Orengo, D.J., Aguadé, M., 2004. Detecting the footprint of positive selection in a European population of Drosophila melanogaster: Multilocus pattern of variation and distance to coding regions. Genetics 167, 1759–1766. Posada, D., Crandall, K.A., 2002. The effect of recombination on the accuracy of phylogeny estimation. J. Mol. Evol. 54, 396–402. Przeworski, M., 2002. The signature of positive selection at randomly chosen loci. Genetics 160, 1179–1189. Przeworski, M., Wall, J.D., Andolfatto, P., 2001. Recombination and the frequency spectrum in Drosophila melanogaster and Drosophila simulans. Mol. Biol. Evol. 18, 291–298. Rozas, J., Sánchez-DelBarrio, J.C., Messeguer, X., Rozas, R., 2003. DnaSP, DNA polymorphism analyses by the coalescent and other methods. Bioinformatics 19, 2496–2497. Sáez, A.G., Tatarenkov, A., Barrio, E., Becerra, N.H., Ayala, F.J., 2003. Patterns of DNA sequence polymorphism at Sod vicinities in Drosophila melanogaster: unravelling the footprint of a recent selective sweep. Proc. Natl. Acad. Sci. U. S. A. 100, 1793–1798. Sawyer, S.A., 1989. Statistical tests for detecting gene conversion. Mol. Biol. Evol. 6, 526–538. Sawyer, S.A., 1999. GENECONV: A computer package for statistical detection of gene conversion. Distributed by the author, Department of Mathematics, Washington University in St. Louis, available at http://www.math.wustl.edu/ ~sawyer. Strobeck, C., 1987. Average number of nucleotide differences in a sample from a single subpopulation: a test for population subdivision. Genetics 117, 149–153. Stumpf, M.P.H., McVean, G.A.T., 2003. Estimating recombination rates from population-genetic data. Nat. Rev., Genet. 4, 959–968. Sokal, R.R., Rohlf, F.J., 1995. Biometry: The Principles and Practice of Statistics in Biological Research. W.H. Freeman and Company, New York. Tajima, F., 1989. Statistical method for testing the neutral mutation hypothesis by DNA polymorphism. Genetics 123, 585–595. Teeter, K., et al., 2000. Haplotype dimorphism in a SNP collection from Drosophila melanogaster. J. Exp. Zool. 288, 63–75. Thornton, K., Andolfatto, P., 2006. Approximate Bayesian inference reveals evidence for a recent, severe bottleneck in a Netherlands population of Drosophila melanogaster. Genetics 172, 1607–1619. Tsaur, S.C., Wu, C.I., 1997. Positive selection and the molecular evolution of a gene of male reproduction, Acp26Aa of Drosophila. Mol. Biol. Evol. 15, 544–549.
M. Žurovcová et al. / Gene 381 (2006) 24–33 Veuille, M., Baudry, E., Cobb, M., Derome, N., Gravot, E., 2004. Historicity and population genetics of Drosophila melanogaster and D. simulans. Genetica 120, 61–70. Wakeley, J., 1997. Using the variance of pairwise differences to estimate the recombination rate. Genet. Res. 69, 45–48.
33
Watterson, G.A., 1975. On the number of segregating sites in genetical models without recombination. Theor. Popul. Biol. 7, 256–276. Žurovcová, M., Ayala, F.J., 2002. Polymorphism patterns in two tightly linked developmental genes, Idgf1 and Idgf3, of Drosophila melanogaster. Genetics 162, 177–188.