cells to the stigma of the pistil so that fertilization can occur in the embryo sac .... tapetum being formed; connective established. ... pollen binucleate. Anthers ...
The Plant Cell, Vol. 2, 1201-1 224, December 1990 O 1990 American Society of Plant Physiologists
Different Temporal and Spatial Gene Expression Patterns Occur during Anther Development Anna M. Koltunow, Jessie Truettner,‘ Kathleen H. C O X , Marco ~ Wallr~th,~ and Robert 6. Goldberg4 Department of Biology, University of California, Los Angeles, California 90024-1606
We studied the temporal and spatial regulation of three mRNA sequence sets that are present exclusively, or at elevated levels, in the tobacco anther. One mRNA set accumulates in the tapetum and decays as the tapetum degenerates later in anther development. The second mRNA set accumulates after the tapetal-specific mRNAs, is localized within the stomium and connective, and also decays as these cell types degenerate during anther maturation. The third mRNA sequence set persists throughout anther development and is localized within most anther tissues. A tapetal-specific gene, designated as TA29, was isolated from a tobacco genome library. Runoff transcription studies and experiments with chimeric p-glucuronidase and diphtheria toxin A-chain genes showed that the TA29 gene is regulated primarily at the transcriptional leve1 and that a 122-base pair 5‘ region can program the tapetal-specific expression pattern. Destruction of the tapetum by the cytotoxic gene had no effect on the differentiation and/or function of surrounding sporophytic tissues but led to the production of male-sterile plants. Together, our studies show that several independent gene expression programs occur during anther development and that these programs correlate with the differentiated state of specific anther cell types.
INTRODUCTION Reproductive processes in higher plants take place within two specialized floral organ systems, the stamen and the pistil (Esau, 1977; Raven et al., 1986; Goldberg, 1988; Drews and Goldberg, 1989). The anther compartment of the stamen contains diploid cells that undergo meiosis to form haploid microspores that differentiate into the pollen grains or male gametophyte (Vasil, 1967; Esau, 1977; Raven et al., 1986). By contrast, sporogenous cells within the ovary of the pistil ultimately lead to the production of the female gametophyte, or embryo sac, that contains the egg cell (Esau, 1977; Raven et al., 1986). Pollination is required to transfer pollen grains containing the sperm cells to the stigma of the pistil so that fertilization can occur in the embryo sac (Esau, 1977; Raven et al., 1986). Stamens are differentiated from primordia that are specified within the floral meristem following the transition from a vegetative to a flowering pathway (Esau, 1977; Raven et al., 1986). Stamen primordia specification depends upon the action of several genes (Bowman et al., 1989; Meyerowitz et al., 1989; Carpenter and Coen, 1990), some of
’ Current address: Department of Cell Biology, Universityof Miami, Miami, FL 33101.
* Current address: Department of Microbiology,University of Tennessee, Memphis, TN 38163. Current address: Plant Cell Research Institute, San Carlos, CA 94070. To whom correspondence should be addressed.
which may encode transcriptional activator proteins (Sommer et al., 1990; Yanofsky et al., 1990). Following stamen primordia initiation, several highly specialized anther tissues are differentiated from cell lineages present in the floral meristem (Satina and Blakeslee, 1941) and are responsible for carrying out nonreproductive functions (e.g., support, dehiscence) and reproductive functions (e.g., spore and gamete formation). The molecular processes that are responsible for specifying functionally distinct anther cell types after primordia initiation are not well understood. Previously, we used RNA-excessDNA/RNA hybridizationexperiments to show that approximately 25,000 diverse genes are expressed in the tobacco anther (Kamalay and Goldberg, 1980). Comparisons of tobacco organ system mRNA and nuclear RNA populations showed that about 10,000 mRNAs are anther specific and are undetectable in the cytoplasm and nucleus of cells in other vegetative and floral organ systems (Kamalay and Goldberg, 1980, 1984). These findings suggest that the transcriptional activation of specific gene sets is required for the establishment and maintenance of differentiated cell types and functions during anther development. In this paper, we describe the temporal and spatial expression patterns of several different anther-specific genes. Our results show that distinct gene expression programs occur during anther development and that these programs correspond with the differentiationof functionally
(B)
(C) (D) VL
"
BBBHDBH FLOWER
5i i i i i i i i i i A«400
0
.
4
ANTHER '
i
3
PISTIL
0
-300
en
E
1
3
5 7 9 STAGE
3
5 7 9 STAGE
11
3
5 7 9 STAGE
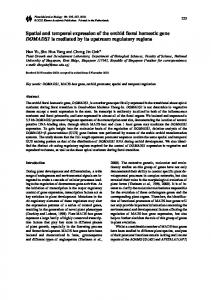
Figure 1. Tobacco Flower Development. (A) Flower development from 8-mm bud to opening. Flower buds were divided into 12 stages on the basis of size [(D)] and morphological
Anther Gene Expression Patterns
distinct cell types. Transformation studies with one antherspecific gene, designated as TA29 (Mariani et al., 1990; Seurinck et al., 1990), demonstrated that sequences responsible for the transcriptional activation of this gene in the tapetum are localized within a 122-bp 5' region. Destruction of the tapetum by a chimeric TA29 diphtheria toxin A-chain gene indicated that the tapetum is not required for the differentiation and/or function of other specialized cell types later in anther development.
RESULTS Anther Development Has Two Distinct Phases
Previously, we divided tobacco flower development into 12 stages to provide reference points for the expression of genes in different floral organ systems (Goldberg, 1988). Figure 1A shows these stages, and the floral bud lengths and morphological markers used to describe each stage are summarized in Table 1. Figures 1B and 1C correlate each stage with the developmental state of the pistil and anthers. Measurements presented in Figure 1D indicate that both the flower bud (calyx plus corolla) and pistil increase in fresh weight and length continuously from stages 1 to 12. By contrast, the anthers increase in weight and length only until stage 5. These parameters remain relatively constant until stage 11 and then decrease precipitously when flower opening and anther dehiscence occur at stage 12 (Figures 1A and 1C). We prepared transverse anther sections at each stage to correlate changes in external morphology (Figure 1C) with the presence of specific sporophytic tissues and cell types and with the presence of microspores and pollen grains. Bright-field photographs of representative anther
1203
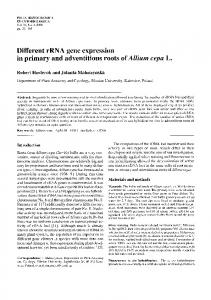
sections are shown in Figure 2A, and the major tissues present and developmental events that occurred from stages 1 to 12 are summarized in Table 1. At stage 1, all major anther tissues have been specified. These included the epidermis, endothecium, vascular bundle, connective, stomium, and tapetum. In addition, meiosis was finished and the microspores were bound together as tetrads in the pollen sac. Following stage 1, the pollen grains differentiated and the anther underwent a series of events leading to dehiscence and pollen release (Figure 2A and Table 1). For example, by stage 8, the tapetum was degenerated, the connective separating the pollen sacs had begun to degrade, and the anther wall showed signs of splitting in the stomium region (Figure 2A and Table 1). At stage 11, the connective was absent, the anther was bilocular, and pollen grains filled the locules (Table 1). We characterized anthers at earlier developmental stages to determine when the major histodifferentiation events occurred. Figure 1E shows pictures of flower bud development before stage 1. We divided these buds into seven stages on the basis of both length (Table 1) and morphological markers observed in the scanning electron microscope (Figure 1F). Early flower bud stages were designated with a minus sign to indicate that they occurred before the completion of meiosis within the anther (Table 1). The scanning electron micrographs shown in Figure 1F and the transverse sections shown in Figure 2A indicate that anther primordia were present in stage -7 flower buds and that the differentiation of specific anther tissues had begun. For example, archesporial cells, connective tissue, prevascular tissue, and epidermis were already visible at this developmental stage (Table 1). Between stages -7 and -1, the anther acquired its characteristic external shape (Figure 1F), all major anther tissues were differentiated (Table 1), and the microspore mother cells
Figure 1. (continued).
criteria (Table 1). Stage 1 was designated as the period when tetrads are present within the anther and corresponds to an 8-mm flower bud. Stage 12 was designated as the time of flower opening and anther dehiscence. The transition from stage 1 to stage 12 occurred over a 1-week period during the summer. (B)Pistil development from stage 1 to stage 12. Pistil lengths and weights are presented in (D). ( C ) Anther development from stage 1 to stage 12. Anther lengths and weights are presented in (D). (D) Changes in organ system weight and length during flower development. Five flower buds were picked at each developmental stage. and their lengths and fresh weights were measured individually. Similar measurementswere made for the anthers and pistil of each flower bud. Data points represent the mean of these five measurements. Anther fresh weights represent the collective weight of all five anthers within the flower bud. (E) Flower development from 0.75" bud to 7-mm bud. Young flower buds were divided into seven stages on the basis of size and developmental events occurring within the anther (Table 1). Stage -7 was designated as the period when tissue differentiationbegins in the anther primordium [(F)] and stage -1 was designated as the period just before the completion of meiosis within the anther (Figure 2 and Table 1). Stage -7, -6, -5, -4, -3, -2, and -1 flower buds averaged 0.75 mm, 1.5 mm, 3 mm, 4 mm, 5 mm, 6 mm, and 7 mm in length, respectively. The transition from stage -7 to stage -1 occurred over approximately 5 days. Photographs were taken using a dissecting microscope with a magnification factor of X75. (F) Scanning electron micrographs of anthers during the early stages of development. Flower buds at the designated stages were harvested, and their sepals and petals were removed to expose the anthers. The dissected flower buds were then photographed in the scanning electron microscope as outlined in Methods. Magnification factors for the stage -7, -6, -5, -4, and 1 anthers were x170, x120, x120, x125, and x60, respectively.
1204
The Plant Cell
Table 1. Major Events during Tobacco Anther Development Flower Stage
Anther Bud Length'
Morphological Markersb
Tissues Present"
Major Events and Morphological Markersd
Peta1 and stamen primordia present; carpels forming; calyx almost closed. Calyx closed; carpels not fused.
E, V, A, C
Rounded primordium; tissue differentiationbegun. lntense mitotic activity in four corners; invagination of inner side. Wall layers including endothecium and tapetum being formed; connective established. Tapetum and pollen sacs distinct; inner and outer tapetum morphologically different; middle layer crushed. Meiosis begins; callose deposition between microspore mother cells evident. Meiosis in progress; tapetum large and multinucleate; stomium differentiation begins; thick callose walls between microspore mother cells. Meiosis in progress; continued stomium differentiation. Meiosis complete; microspores in tetrad; stomium differentiated; all sporophytic tissues formed. Microspores separate. Tapetum shrunken; secondary thickening in outer wall layers; pollen grains begin to form. Cells adjacent to stomium degenerated; tapetum degenerating. Secondary thickening in outer wall layers intensified. Remnants of tapetum present; microspore nucleus dividing. Degradation of connective tissue in stomium region. Disruptionof connective tissue separating pollen sac. Continued connective degradation.
-7
0.75
-6
1.5
-5
3
Carpels fused; stamen filaments elongated; E, En, T, V, MMC, C petals equal in length with anthers.
-4
4
Anthers yellowish; petals enclose anthers; stigma forming.
-3
5
Style elongating; stamen filament extension E, En, T, V, MMC, C continues; anthers below stigma.
-2
6
Style clearly elongated; ovary expanded; anthers below stigma.
E, En, T, V, MMC, C, S
-1
7
Petals approaching top of sepals.
E, En, T, V, MMC, C, S
1
8
Anthers and pistil fully differentiatedand green.
E, En, T, V, TDS, C, S
2 3
11 14
Calyx opens slightly at top of bud Corolla emerges from calyx.
E, En, T, V, Msp, C, S E, En, T, V, Msp, C, S
4
16
E, En, T, V, Msp, C, S
5
20
Sepals completely separated at top of calyx. Corolla tube bulge just inside calyx.
E,En, T, V, Msp, C,S
6
22
Corolla tube bulge at tip of calyx.
E, En, T, V, Msp, C, S
7
28.
E, En, V, Msp, C, S
8
39
9
43
10
45
11
47
Corolla tube bulge above calyx; petals closed. Corolla elongating; petals green and slightly open. Corolla tube bulge enlarging; petal tips becoming pink. Corolla limb beginning to open; petal tips pink. Corolla limb halfway open; stigma and anthers visible.
12
46
E, V, Sp, P, C
E, En, T, V, MMC, C
E, En, V, Msp, C, S
E, En, V, Msp, C, S E, En, V, Msp, S E, En, V, Msp, S
Flower open; anthers dehisced; corolla limb E, En, V, PG fully expanded and deep pink.
Connective tissue almost fully degraded; pollen binucleate. Anthers bilocular; connective absent; locules filled with mature pollen grains. Anthers dehisce along stomium; pollen released.
Mean of five individual determinations expressed in millimeters. Data from stages 1 to 12 taken from those presented in Figure 1D. Major markers that can be used with bud length measurements to identify stage. Tube refers to the white elongated portion of the corolla; limb refers to the top pink corolla region where the petal tips are separated from each other (Figure 1A). Markers for stages -7 to -1 taken from the scanning electron micrographs (Figure 1F); markers for stages 1 to 12 were taken from visual inspection of buds (Figure 1A). A, archesporial cells; C, connective; E, epidermis; En, endothecium; MMC, microspore mother cells; Msp, microspores; P, parietal layer; PG. pollen grains; S, stomium; Sp, sporogenous cells; T, tapetum; TDS, tetrads; V, vascular tissue. Taken from bright-field photographs of transverse anther sections (Figures 2 and 14). Taken from bright-field photographsof transverse anther sections (Figures 2 and 14).
a
Anther Gene ExpressionPatterns
were undergoing meiosis (Figure 2A). Taken together, these data indicate that anther developmental stages can be correlated with floral bud lengths and that there are two major phases of anther development: phase 1-tissue differentiation, microspore mother cell specification, and meiosis (stages -7 to -l), and phase 2-growth, pollen grain differentiation, and tissue degeneration and dehiscence (stages 1 to 12). Anther-Specific Clones Were ldentified in an Anther cDNA Library
We constructed a stage 6 (Figures I A and 1C) anther cDNA library and then screened this library for cDNA clones that represented mRNAs present exclusively, or at elevated levels, in the anther (see Methods). We used stage 6 anther mRNA to construct the library because our earlier solution DNA/RNA hybridization studies indicated that stage 6 anthers contain a large number of antherspecific mRNAs (Kamalay and Goldberg, 1980,1984). We obtained 58 anther-specific cDNA clones out of a screen of 768 plasmids and then sorted 26 of these clones into groups by RNA gel blot and cross-hybridization analyses. Sixteen cDNA clones failed to cross-hybridize at a moderately stringent criterion (42OC, 50% formamide, 1 M Na') and were designated as unique. The remainder were found to belong to four different cross-hybridizing groups. Table 2 lists representative cDNA clones from three of the groups, as well as others that sorted into the unique category. DNA sequencing studies (Seurinck et al., 1990; J. Seurinck, J. Leemans, and R.B. Goldberg, unpublished results) showed that the TA32136 and TA56157 groups represented mRNAs encoding lipid transfer proteins (Bouillon et al., 1987; Takishima et al., 1988) and thiol endopeptidase proteins (Miller and Huffaker, 1982; Mitsuhashi and Minamikawa, 1989), respectively. In addition, the TA131 TA29 group represented mRNAs that encoded glycinerich proteins with properties of cell wall proteins (Condit and Meagher, 1986; Keller et al., 1988; Varner and Cassab, 1988). By contrast, the unique anther cDNA clones sequenced to date (e.g., TA20, TA25, and TA26) failed to show relatedness to any known mRNA or protein. We hybridized representative anther cDNA probes with gel blots containing floral and vegetative organ system mRNAs. As shown in Figure 3, all probes produced strong hybridization signals with anther mRNA. Prevalence estimates indicated that these mRNAs represented from 0.05% to 0.5% of the anther mRNA, depending upon the message (Table 2). ln most cases, the cDNA probes failed to produce a detectable signal with heterologous organ mRNAs, even after the gel blots were exposed 50 times longer than that required to produce a weak anther signal. By contrast, three cDNA clones (TA20, TA26, TA4) produced signals with other mRNAs in addition to anther mRNA; however, in each case, the heterologous hybridi-
1205
zation signal was at least 10-fold lower than that observed in the anther. In addition, each of these cDNA clones produced a distinct hybridization pattern with the heterologous mRNAs (Figure 3). For example, the TA20 probe hybridized with pistil and peta1 mRNAs, whereas the TA26 probe hybridized only with leaf mRNA. Taken together, these data indicate that we have identified severa1different anther-specific cDNA clones, that these clones represent relatively prevalent anther mRNAs, and that most of these mRNAs are either undetectable in other organ system mRNAs at our sensitivity level (e.g., TA13, TA29, TA36) or are present at a level at least 10-fold lower than that observed in the anther (e.g., TA4, TA20, TA26).
Gene Expression 1s Temporally Regulated during Anther Development
We hybridized representative anther cDNA plasmids with mRNAs from different anther stages to determine whether their corresponding genes were regulated temporally during anther development. These plasmids included the eight listed in Table 2 in addition to 11 others. Figures 4A and 4B present the results of RNA dot blot studies, and Figure 4C shows duplicate RNA gel Dlot experiments with some of the same plasmids. Three distinct gene expression patterns were observed. First, Figures 4A and 4C show that most anther mRNAs investigated accumulated coordinately between stages 1 and 4 and then their levels declined significantly after stage 6. These mRNAs included those encoding the glycine-rich proteins (TA13, TA29) and the lipid transfer proteins (TA32, TA36). Second, Figure 48 shows that the TA20 and TA25 mRNAs were present at relatively similar levels in all stages studied. Closer inspection of the data, however, indicated that these mRNAs increased slightly in prevalence between stages 2 and 3 (Figure 4B). Finally, Figures 48 and 4C show that the thiol endopeptidase mRNAs (TA56, TA57) accumulated between stages 1 and 6, remained relatively constant until stage 8, and then declined to low levels before dehiscence at stage 11. Together, these data indicate that many anther-specific genes are regulated temporally and that there are timing differences in anther gene expression patterns.
Gene Expression 1s Spatially Regulated during Anther Development
We hybridized single-stranded35S-RNAprobes with anther sections in situ (see Methods) to correlate the temporal gene expression patterns observed during anther development (Figure 4) with the presence of specific anther tissues and cell types (Figure 2 and Table 1).
1206
The Plant Cell
WILD TYPE
TA29/DTA
En Figure 2. Bright-Field Photographs of Tobacco Anther Development in Untransformed Plants and Plants Transformed with a Chimeric TA29/DTA Gene. Anthers at the designated stages were fixed, embedded with paraffin, and sliced into 10-Mm transverse sections as described in Methods. The fixed sections were stained with toluidine blue and photographed with bright-field illumination. A, archesporial cells; C, connective; E,
Anther Gene Expression Patterns
Table 2. Anther-Specific mRNAs mRNA
Size"
Prevalenceb
Protein Encoded"
TA13' TA20" TA25" TA26" TA2gd TA32' TA36' TA56O
1.1, 1.2 0.6 0.7 0.6, 0.7 1.1, 1.2 0.6, 0.7 0.6, 0.7 1.5
0.4 0.5 0.2 0.2 0.2 0.05
GIycine-rich Unknown Unknown Unknown Glycine-rich Lipid transfer Lipid transfer Thiol endopeptidase
0.05 0.05
Taken from Figure 3. Percentage of stage 3 anther polysomal poly(A) mRNA. Estimated relativeto calibrated RNA standards. The TA13 and TA29 mRNA prevalences were estimated using mRNA-specific oligonucleotide probes. Translation of DNA sequence (Seurinck et al., 1990), or highest identity score with proteins in the GenBank. Different members of the same family. TA13 and TA29 mRNAs are 90% similar at the nucleotide level (J. Seurinck, J. Leemans, and R.B. Goldberg, unpublished data). e Not significantly similar at the nucleotide level to each other or to the other mRNAs listed in this table (J. Seurinck, J. Leemans, and R.B. Goldberg, unpublished data). 'Different members of the same gene family. TA32 and TA36 mRNAs are 63% similar at the nucleotide level (J. Seurinck, J. Leemans, and R.B. Goldberg, unpublished data), and their cDNA plasmids only weakly hybridize at a moderately stringent criterion (42OC, 50% formamide, 1.2 M Na'). The TA56 and TA57 cDNA plasmids (Figure 48) cross-hybridize at a moderately stringent criterion.
a
Severa1 Different Anther mRNAs Are Localized within the Tapetum Figure 5 shows the localization patterns of the TA26, TA29, and TA32 mRNAs (Table 2). As seen in Figures 5A to 5C, no hybridization grains above background were observed with the TA29 mRNA control probe. By contrast, Figures 5D to 5L show that the TA26, TA29, and TA32 anti-mRNA probes produced identical, tapetal-specific localization patterns, as did TA13 and TA36 anti-mRNA probes (data not shown). For example, the TA29 antimRNA probe produced an intense hybridizationsignal over the tapetum at stage 3 (Figure 5H) and did not produce any hybridizationgrains above background over any other
1207
anther regions. Nor were there any detectable hybridization signals produced at stage 1 (Figure 5G)and stage 6 (Figure 51). The hybridization signals at each stage correlated directly with the mRNA levels observed in the RNA dot blot and gel blot experiments (Figures 4A and 4C). The absence of a detectable signal at stage 6 (Figures 5F, 51, and 5L) coincided with the degeneration process occurring in the tapetum (Figure 2 and Table 1). We hybridized 3H-poly(U) with the anther sections to localize the distribution of total poly(A) RNA molecules. In contrast with the results obtained with the TA13, TA26, TA29, TA32, and TA36 anti-mRNA probes (Figure 5), the distribution of grains was uniform throughout the anther at each stage investigated and grains were present over all tissues (data not shown). Together, these results indicate that severa1 different mRNAs that accumulate and decay coordinately during early phase 2 of anther development are localized within the tapetum and that these mRNAs include those encoding the glycine-rich proteins (TA13, TA29) and the lipid transfer proteins (TA32, TA36).
The TA56 Thiol Endopeptidase mRNA 1s Localized wifhin the Connective and Stomium The TA56 mRNA localization pattern is shown in Figure 6. Figures 6A to 6D show that the TA56 mRNA control probe produced no hybridization grains above background levels with anther sections from stage 1 (Figure 6A), stage 3 (Figure 6B), stage 8 (Figure 6C), and stage 11 (Figure 6D). By contrast, Figures 6E to 6H show that the TA56 antimRNA probe produced a localized hybridization signal at all stages investigated and that both the location and intensity of the hybridization grains changed with the developmental state of the anther. Bright-field photographs of the anther regions containing the TA56 mRNA are shown in Figures 61 to 6L, and Figures 6M to 6P show high-magnification dark-field photographs of the hybridization grains at each stage. As predicted from the RNA accumulation studies (Figures 4 8 and 4C), a relatively weak TA56 hybridization signal was observed at stage 1 of anther development (Figures 6E and 6M). This signal was localized on both sides of the anther over a circular cluster of cells between the stomium and the connective (Figures 6E, 61, and 6M). At stage 3, the TA56 mRNA hybridizationsignal intensified
Figure 2. (continued).
epidermis; En, endothecium; MMC, microspore mother cells; Msp, microspores; PS, pollen sac; S, stomium; Sp, sporogenous cells; T, tapetum; TDS, tetrads; V, vascular bundle. Magnification factors for stage -7, -6,--2, 1, 3, and 8 anthers were x400, x200, x100, ~ 1 0 0x100, , and ~ 1 0 0respectively. , (A) Anther development in wild-type untransformed plants. (6)Anther development in plants transformedwith a chimeric TA29/DTA gene. Tobacco plants were transformedwith a TA29IDTA gene as described in Methods. The TA29/DTA gene contained a TA29 5' DNA fragment containing nucleotides -1477 to +51 (Mariani et al., 1990; Seurinck et al., 1990) fused with the DTA gene coding sequence (Greenfield et al., 1983; Maxwell et al., 1986; Palmiter et al., 1987).
cDNA TA13
TA29
ORGAN SYSTEM A Pi P L S R
kb _ . -1.1
1.1
TA20
-0.6
TA25
-0.7
TA26
-0.7 -0.6
TA36
-0.6
TA39
-0.7 -0.6
TA51
-0.9
TA4
-0.5
Figure 3. Representation of Anther-Specific mRNAs in Floral and Vegetative Organ Systems. Tobacco anther (A), pistil (Pi), petal (P), leaf (L), stem (S), and root (R) polysomal poly(A) mRNAs were fractionated on denaturing agarose gels, transferred to nitrocellulose paper, and hybridized with labeled plasmid DMA probes as outlined in Methods. Anther and pistil mRNAs were isolated from stage 6 flower buds (Figure 1), whereas petal mRNA was isolated from stage 12 flowers (Figure 1). Leaf, stem, and root mRNAs were isolated from plants described in Methods. One microgram of each mRNA was used for the TA29 gel blot, and 0.5 ng of each mRNA was used for the TA13, TA20, and TA25 gel blots. By contrast, the TA26, TA35, TA51, and TA4 gel blots contained 0.1 ng of anther mRNA and 1 ^g of all other mRNAs. Film exposure times varied for each gel blot but, with the exception of the TA20 gel blot, were the same for all RNA lanes. Exposure times for the TA20 petal, leaf, stem, and root RNA lanes were approximately 30 times longer than that used for the anther and pistil RNA lanes.
but remained localized over the same circular cell cluster (Figures 6F, 6J, and 6N). No hybridization grains above background levels were observed over any other anther tissues at this stage, including the epidermis, connective, endothecium, tapetum, and wall. By stage 8, however, the TA56 mRNA localization pattern changed. Figures 6G, 6K, and 6O show that the TA56 mRNA was now localized over both stomium regions and was uniformly distributed over the connective separating the pollen sacs. By contrast, TA56 mRNA was undetectable in the circular cell cluster between the stomium and connective because these cells had degenerated (Figure 6K). Finally, at stage 11 after the connective degenerated (Table 1), the TA56 mRNA hybridization signal was reduced significantly but was still localized over the stomial cells (Figures 6H, 6L, and 6P). Together, these data indicate that the TA56 thiol endopeptidase mRNA is present in specific anther cell types and that the appearance of this mRNA occurs just before the degeneration of these cells in anther development.
The TA20 mRNA Is Distributed throughout the Anther and Is Localized in Specific Pistil Regions Figures 3 and 4B show that the TA20 mRNA is present throughout phase 2 of anther development and is also present in the pistil at a level 10-fold lower than that observed in anthers of the same stage flower bud. We hybridized a TA20 anti-mRNA probe with anther and pistil sections to localize TA20 molecules within both of these floral organ systems. Figure 7A shows that this probe produced an intense hybridization signal over most anther tissues at stage 2, including the connective, stomium, and wall layers. Highest concentrations of grains occurred over the connective and over cells immediately surrounding the tapetum. By contrast, the TA20 anti-mRNA probe did not produce any hybridization grains above background levels (Figure 7E) over the vascular bundle, the tapetum, or the circular cell cluster between the stomium and connective that contained the TA56 thiol endopeptidase mRNA (Figures 6M and 6N). Figures 7B to 7D show that at later developmental stages the TA20 mRNA remained localized within the same tissues, but beginning at stage 6 became progressively concentrated in connective regions adjacent to the vascular bundle (Figure 7C), and by stage 8 became less prevalent throughout the anther (Figure 7D). Figures 8A to 8C show bright-field photographs of ovary cross-sections from a stage 4 pistil (Figure 8A) and a stage 6 pistil (Figure 8B), as well as a stigma/style longitudinal section from a pistil at stage 6 (Figure 8C). Two carpels can be visualized within the ovary of each pistil, along with locules, placenta, vascular bundle, ovules, and the ovary wall (Figures 8A and 8B). A prominent stigma and a style with transmitting tissue were also visualized within the pistil (Figure 8C). Figures 8D and 8E show that the TA20 mRNA was localized within the ovary wall and a narrow cell layer that connects the ovules to the placenta. No TA20 hybridization grains above background levels (data
Anther Gene Expression Patterns
(A) cDNA
STAGE 1 2 3 4 5 6 7 8 9 10 11 Control
TA13 • • • TA29 • • •
TA1
•
•
TA32 • • • TA26 • • • TA33 • • TA36 TA39 TA45 TA46
•• • • • • • • • • • •
TA51
• • •
cDNA TA20 TA25 TAX TA54 TA56 TA57 TA30
STAGE 1 2 3 4 5 6 7 8 9 10 11 Control ••••••••••• ••••••••••• •••••••••• • • ••••• • • "• •_• • • • • • • • • ••••••
(B)
(C) cDNA TA26
TA32 TA56
• * • *
STAGE 1 2 3 4 5 6 7 8 10
•§••• tflff »-
Kb
-0.7 -0.6
-0.7 -1.5
Figure 4. Accumulation of Anther-Specific mRNAs during Anther Development. Polysomal poly(A) mRNAs were isolated from anthers at different developmental stages (Figure 1) and either spotted onto nitrocellulose paper [(A) and (B)] or fractionated on denaturing agarose gels and transferred to nytran [(C)]. Dot blots and gel blots were hybridized with labeled plasmid DMAs as outlined in Methods. Film exposure times differed for each dot blot or gel blot developmental series but were the same for each RNA hybridized with a given DNA probe. (A) Hybridization of anther cDNA plasmids with anther mRNAs at different developmental stages. The TA13 and TA29 dots contained 0.25 fig of mRNA; the other dots contained 0.05 »g of mRNA. Control dots contained an equivalent amount of soybean embryo polysomal poly(A) mRNA. (B) Hybridization of anther cDNA plasmids with anther mRNAs at different developmental stages. The TA20 and TA25 dots contained 0.25 ^g of mRNA; the other dots contained 0.05 //g of mRNA. Control dots contained an equivalent amount of soybean embryo polysomal poly(A) mRNA.
1209
not shown) were observed over the ovules, vascular bundles, and most of the placenta. Figure 8F shows that TA20 hybridization grains were also absent from the stigma and the transmitting tissue of the style. By contrast, TA20 mRNA molecules were localized within parenchyma tissue that extended from beneath the stigma surface through the style to the ovary (Figure 8F). Together, these data show that the TA20 mRNA is present in the majority of anther cells throughout phase 2 of development and is concentrated within specific regions of the pistil. We conclude from these data and those obtained with the other mRNAs (Figures 5 and 6) that temporal differences in anther gene expression programs correlate with the differentiation and degeneration of specific anther cell types. Most Anther Genes Are Represented only a Few Times in the Tobacco Genome We hybridized stage 6 anther 32P-cDNA with an excess of tobacco DNA in solution to estimate the copy number of genes expressed in the anther. We utilized an internal 3Hsingle-copy DNA standard to calibrate the hybridization kinetics (Goldberg et al., 1978, 1981). Figure 9A shows that 70% of the 32P-cDNA hybridized with a rate constant identical to that of the 3H-single-copy DNA (0.00045 M~1 sec"1). By contrast, 30% of the 32P-cDNA hybridized with a rate constant of 0.047 M~1 sec"1, suggesting that these sequences are reiterated approximately 100 times (0.047/ 0.0045) in the tobacco genome. These studies, and those presented previously (Kamalay and Goldberg, 1980), indicate that mRNAs comprising most of the stage 6 anther mRNA mass and sequence complexity are encoded by single-copy genes, or genes present only a few times (