596 • The Journal of Neuroscience, January 8, 2014 • 34(2):596 – 607
Behavioral/Cognitive
Differential Contributions of Infralimbic Prefrontal Cortex and Nucleus Accumbens during Reward-Based Learning and Extinction Jennifer Francois,1 John Huxter,1 Michael W. Conway,1 John P. Lowry,2 Mark D. Tricklebank,1 and Gary Gilmour1 1
Lilly Centre for Cognitive Neuroscience, Lilly Research Laboratories, Eli Lilly & Company Ltd., Erl Wood Manor, Windlesham GU20 6PH, Surrey, United Kingdom, and 2Department of Chemistry, National University of Ireland, Maynooth, County Kildare, Ireland
Using environmental cues for the prediction of future events is essential for survival. Such cue-outcome associations are thought to depend on mesolimbic circuitry involving the nucleus accumbens (NAc) and prefrontal cortex (PFC). Several studies have identified roles for both NAc and PFC in the expression of stable goal-directed behaviors, but much remains unknown about their roles during learning of such behaviors. To further address this question, we used in vivo oxygen amperometry, a proxy for blood oxygen level-dependent (BOLD) signal measurement in human functional magnetic resonance imaging, in rats performing a cued lever-pressing task requiring discrimination between a rewarded and nonrewarded cue. Simultaneous oxygen recordings were obtained from infralimbic PFC (IFC) and NAc throughout both acquisition and extinction of this task. Activation of NAc was specifically observed following rewarded cue onset during the entire acquisition phase and also during the first days of extinction. In contrast, IFC activated only during the earliest periods of acquisition and extinction, more specifically to the nonrewarded cue. Thus, in vivo oxygen amperometry permits a novel, stable form of longitudinal analysis of brain activity in behaving animals, allowing dissociation of the roles of different brain regions over time during learning of reward-driven instrumental action. The present results offer a unique temporal perspective on how NAc may promote actions directed toward anticipated positive outcome throughout learning, while IFC might suppress actions that no longer result in reward, but only during critical periods of learning. Key words: infralimbic cortex; nucleus accumbens; oxygen amperometry; reward learning
Introduction In dynamic environments, efficient goal-directed behavior depends on the formation of associations between cues and the predictability and value of contingent outcomes. At the simplest level, such associations likely drive two distinct processes to form goal-directed behavior: the selection and promotion of actions resulting in reward, and the inhibition of unnecessary or punished actions. Investigation of the neural bases underpinning the formation of environmental cue– outcome associations implicates a network of structures in the mesolimbic system. In particular, the dopaminergic projection from the ventral tegmental area to the nucleus accumbens (NAc) and the prefrontal cortex (PFC) has been extensively studied in this context (Berridge and Robinson, 1998; Wise, 2004). The NAc has long been considered a “limbic–motor interface” that is essential for translating motivation into motor action (Goto and Grace, 2005). In support of
Received June 3, 2013; revised Nov. 7, 2013; accepted Nov. 11, 2013. Author contributions: J.F. and G.G. designed research; J.F. and M.W.C. performed research; J.P.L. contributed unpublished reagents/analytic tools; J.F. and J.H. analyzed data; J.F., J.H., M.D.T., and G.G. wrote the paper. J.F., J.H., M.W.C., M.T., and G.G. are employees of Eli Lilly & Co Ltd. Correspondence should be addressed to Dr. Jennifer Francois, Lilly Centre for Cognitive Neuroscience, Eli Lilly & Co. Ltd., Erl Wood Manor, Sunninghill Road, Windlesham GU20 6PH, Surrey, United Kingdom. E-mail:
[email protected]. DOI:10.1523/JNEUROSCI.2346-13.2014 Copyright © 2014 the authors 0270-6474/14/340596-12$15.00/0
this, several electrophysiological studies in rodents have shown that NAc neurons are excited by cues signaling reward availability (Nicola et al., 2004a; Day et al., 2006; Wan and Peoples, 2006), and the magnitude of these electrophysiological responses correlates with both the predictive value of the cue and the action elicited (Taha et al., 2007; Ito and Doya, 2009; Roesch et al., 2009). These results are paralleled in human neuroimaging studies, which have shown an activation of the NAc during reward anticipation that correlates with the amount of the reward perceived (Knutson et al., 2001; Ballard and Knutson, 2009). The PFC is a principal glutamatergic projection region of the NAc (Brog et al., 1993), and PFC neurons have been shown to respond to reward-predictive cues during the expression of several types of goal-directed behavior (Schoenbaum et al., 1998; Jodo et al., 2000; Watanabe and Sakagami, 2007). More specifically, a growing body of evidence implicates the PFC as a key node involved in the suppression of unproductive actions. It has long been known that impaired PFC function leads to deficits in inhibitory control in animals and humans (Dalley et al., 2004; Bechara and Van Der Linden, 2005), and recent studies have demonstrated that lesions of the infralimbic region of the PFC (IFC) impair behavioral responding to reward-predictive cues by increasing the number of nonspecific or unrewarded responses (Ghazizadeh et al., 2012). Although in some regard the role of both the NAc and PFC in the expression of goal-directed behavior is quite well defined,
Francois et al. • Infralimbic Prefrontal Cortex, Accumbens, and Reward Learning
J. Neurosci., January 8, 2014 • 34(2):596 – 607 • 597
much remains unknown about their interaction during the learning phase of such behaviors. Animal studies performed to date have typically involved lesioning of, or electrophysiological recordings in those structures after the animals have been trained to stable performance levels of a given goal-directed behavior. The present study addressed how the NAc and IFC interact at different points during the learning of a goal-directed behavior by simultaneously recording regional activity during the acquisition and extinction of a cued lever-press task using in vivo oxygen amperometry, a technique shown to serve as a valid surrogate of functional magnetic resonance imaging in behaving animals (Lowry et al., 2010; Francois et al., 2012).
Materials and Methods Animals All experiments were conducted in accordance with the United Kingdom Animals (Scientific Procedures) Act 1986. Adult male Sprague Dawley rats (Charles River) were used in the present studies (n ⫽ 24). Before surgery, animals (250 –300 g) were housed in standard housing conditions (four per cage, 7:00 A.M. to 7:00 P.M. light phase, controlled temperature and humidity, ad libitum water). After surgery, animals were singly housed in the same environment. All animals were kept for a period of 7 d before any behavioral procedure started. During this time, rats were acclimated to the food restriction regime (i.e., maintained at no less than 85% of their free-feeding weight) and were handled regularly.
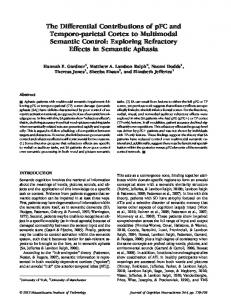
Figure 1. A, B, Reconstructions of electrode placements in the infralimbic cortex (A) and nucleus accumbens (B). Coronal sections for the reconstructions are taken from the atlas of Paxinos and Watson (1998), plates 8 (infralimbic cortex), and 11, 12, and 13 (nucleus accumbens). The tip of each CPE is represented by a black circle.
Electrode construction
Carbon paste electrodes (CPEs) were constructed from 8 T (200 m bare diameter, 270 m coated diameter) Teflon-coated silver wire (Advent Research Materials), as described previously (McHugh et al., 2011; Francois et al., 2012). The Teflon insulation was slid along the wire to create an ⬃2-mm-deep cavity, which was packed with carbon paste. Carbon paste was prepared by thoroughly mixing 7.1 g of carbon graphite powder and 2.5 ml of silicone oil (both from Sigma-Aldrich; O’Neill et al., 1982). Reference and auxiliary electrodes were also prepared from 8 T Tefloncoated silver wire by removing the Teflon from the tip. All electrodes were soldered to gold connectors, which were cemented into six-pin plastic sockets (both from Plastic One) during surgery.
Electrode calibration Before implantation, all CPEs were calibrated in vitro in a standard threeelectrode glass electrochemical cell (C3 cell stand, BASi), with an Ag/ AgCl reference electrode and a BASi platinum auxiliary electrode. Calibrations were performed in a 15 ml phosphate buffer saline solution, pH 7.4, saturated with nitrogen (N2) gas, atmospheric air (from a RENA air pump), or pure O2 at room temperature providing a 3-point calibration of known concentrations of 0 M (N2 saturated), 240 M (air saturated), and 1260 M (O2 saturated) oxygen. CPEs were chosen for implantation if their calibration curves were linear and the measured oxygen values from the saturated solutions were not greatly different from those expected (least square linear regression, R 2 ⱖ 0.98).
Surgery Animals were placed in vaporization chambers and anesthetized with 5% isofluorane (2 L/min O2) and maintained on 1–3% isofluorane (2 L/min O2) for the rest of the procedure. CPEs were implanted in the NAc [from bregma: anteroposterior (AP), ⫹1.9 mm; mediolateral (ML), ⫾0.8 mm; dorsoventral (DV), ⫺6.9 mm) and the IFC (from bregma: AP, ⫹3.2 mm; ML, ⫾0.7 mm; DV, ⫺4.2 mm)]. The reference electrode was inserted into the posterior cortex to a depth of 2 mm and secured with cement. The auxiliary electrode was wrapped round a skull screw positioned over posterior cortex. After all electrodes were cemented into place, the gold sockets of the electrodes were inserted into a six-pin plastic socket. All animals were administered Rimadyl (carprofen; 5 mg/kg, s.c.) both presurgically and postsurgically, and were allowed to recover in thermostatically controlled cages.
Amperometric techniques Changes in extracellular tissue oxygen concentration were measured using constant potential amperometry (CPA) at CPEs, as described previ-
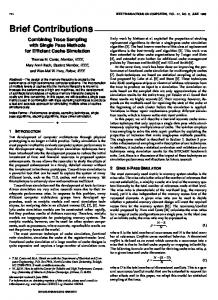
Figure 2. Behavioral performance during acquisition of a cued lever-press task. A, Percentage of HIT responses measured for S1⫹ and S2⫺ cues over 51 sessions of acquisition. The black line and dotted line represent performance criteria set for S1⫹ and S2⫺ cues, respectively. The task was considered fully acquired when those criteria were reached and remained stable for 2 more consecutive days. Here, these criteria were met after 49 d of acquisition despite a significant discrimination between S1⫹ and S2⫺ cues being observable after 10 d of acquisition. *p ⬍ 0.05 compared with the S2⫺ cue. B, DI between S1⫹ and S2⫺ cues as a function of the number of days in training. DI was calculated as the number of (S1⫹ HIT)/(number of S1⫹ HIT and S2⫺ HIT). The task was considered fully acquired when the DI reached a minimum value of 0.70, which in this case occurred after 48 d of acquisition.
ously (Lowry et al., 1997). Briefly, a negative potential (⫺650 mV) was applied to the CPE to allow the electrochemical reduction of dissolved oxygen to occur at the tip of the electrode. This potential is in the mass transport-limited region after the peak potential for O2 reduction (approximately ⫺500 mV) and has previously been shown to be appropriate for CPA O2 detection using cyclic voltammetry (Lowry et al., 1996). Changes in the measured current that are produced by the electrochemical reduction of O2 are directly proportional to the local extracellular tissue O2 concentration (Hitchman, 1978). Moreover, since the dimension of CPEs (typically 100 –200 m; Justice, 1987) is greater than the scale of a capillary zone (⬍100 m), an average extracellular tissue O2 level is detected regardless of the orientation of the electrode relative to the blood vessels and metabolically active sites, or the depth of penetration into the tissue.
598 • J. Neurosci., January 8, 2014 • 34(2):596 – 607
Francois et al. • Infralimbic Prefrontal Cortex, Accumbens, and Reward Learning
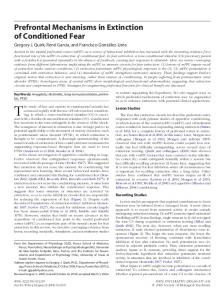
Figure 3. O2 signal recordings during the first 3 weeks of acquisition of a cued lever-press task. A, B, AUC extracted from the O2 signals recorded daily during the first 3 weeks of acquisition of the task simultaneously in the NAc (A) and the IFC (B). *p ⬍ 0.05 compared with the S2⫺ cue (global cue effect in the ANOVA). C, D, Representative O2 amperometry curves recorded at different time points during acquisition: the first day the animals are presented with the task (Day 1), and after 5, 11, and 17 d of training. Values are presented as an average ⫾ SEM of 30 rewarded trials (S1⫹, black circle) and 30 nonrewarded trials (S2⫺, open circle) presented during the 45 min session for both the NAc (C) and IFC (D). Each trial was analyzed for a 30 s period, including a 5 s baseline before cue onset (dashed line at 0 on the x-axis) and 25 s after. The second dashed line at 10 s corresponds to cue offset. On the first day of acquisition, both the NAc and the IFC show increases in the O2 signal for both S1⫹ and S2⫺ cues. From Day 5 onward, the O2 signal increase in the NAc is observed only for S1⫹, while the IFC is activated only during the S2⫺ cue presentation. Black bars: p ⬍ 0.05 compared with the S2⫺ cue.
In vivo signal validation To demonstrate the oxygen sensitivity and reliability of the electrodes in vivo, mild hyperoxia and hypoxia were induced by applying gaseous O2 (BOC Medical) or N2 (BOC Gases), respectively, to the snout of the animal before and after each experiment. Polyurethane tubing, connected to the appropriate gas cylinder, was held ⬃2 cm from the snout and the gas delivered for either 60 s (O2) or 30 s (N2) at a flow rate of 1 L/min. Electrodes were considered acceptable for analysis if they did not show any increase in response following two N2 inhalation challenges, and a reproducible increase to two O2 inhalation challenges.
O2 amperometry data recording Rats were connected to a four-channel potentiostat (Biostat, ACM Instruments) through a six-pin socket (Plastics One) via a flexible screened six-core cable (Plastics One). A PowerLab 8/30 Data Acquisition System was used for analog/digital conversion, and data were collected on a PC running Chart version 5 software (AD Instruments). The O2 signal was recorded at a sample rate of 200 Hz. For all test sessions where an amperometric signal was recorded, animals were tethered and a constant potential (⫺650 mV) was applied for the duration of the session.
O2 amperometry data analysis Current (in nanoamperes) recordings from each channel were analyzed separately. Linear interpolation was used to replace occasional missing data points and a biquad Butterworth filter (high pass 0.1 Hz) was used to suppress fast events representing noise artifacts. Time 0 was taken as the time of cue presentation. To compensate for different baselines between channels, data were normalized by subtracting the average value from the 1 s period preceding cue onset. A boxcar-averaging algorithm was used to downsample the data, keeping a single average from multiple 0.5 s non-
overlapping windows. Data were analyzed for 30 s post-cue onset. The area under the curve (AUC) was calculated as follows:
AUC ⫽
冉冘
n i⫽0
冊
aⴱd ,
where n is the number of samples in the curve, a is the value (in nanoamperes) at a given sample, and d is the interval between samples. For statistical analysis, the time course curves were subjected to repeatedmeasures ANOVA followed by a post hoc Fisher’s test for multiple comparisons. The extracted measures (AUC) were analyzed by two-way ANOVA followed a Fisher’s least significant difference post hoc test for multiple comparisons.
Behavioral experiments Apparatus. Operant boxes housed in sound- and light-attenuating chambers were used (Med Associates). Each chamber contained a house light (100 mA; ENV 215M, Med Associates) and two retractable levers. The levers were located on either side of a recessed magazine where food pellets (45 mg; Formula P, Noyes) were delivered from an automatic pellet dispenser. Auditory signals [a continuous tone (70 dB, 4000 kHz) and a clicker] were produced by a tone generator located on the wall opposite to the food magazine. Experimental sessions were controlled and data recorded using in-house programs written with MedPC-IV software (Med Associates), and data were prepared for analysis using an in-house Excel macro designed for each experiment. O2 amperometry recordings in the nucleus accumbens and infralimbic cortex during acquisition of cued lever-press task. Rats were trained to discriminate between two auditory cues (S1 and S2) to receive a food
Francois et al. • Infralimbic Prefrontal Cortex, Accumbens, and Reward Learning
J. Neurosci., January 8, 2014 • 34(2):596 – 607 • 599
Figure 4. O2 signal recordings during the last 4 weeks of acquisition of a cued lever-press task. A, B, AUC extracted from O2 signals recorded daily during Days 21–50 of task acquisition simultaneously in NAc (A) and IFC (B). *p ⬍ 0.05 compared with the S2⫺ cue (global cue effect in the ANOVA). C, D, Representative O2 amperometry curves recorded at different time points during acquisition: after 22, 28, and 35 d of training; and after the behavioral criteria were reached after 50 d of acquisition. Values are presented as an average ⫾ SEM of 30 rewarded trials (S1⫹, black circle) and 30 nonrewarded trials (S2⫺, open circle) presented during the 45 min session for both NAc (C) and IFC (D). Each trial was analyzed for a 30 s period, including a 5 s baseline before cue onset (dashed line at 0 on the x-axis) and 25 s after. The second dashed line at 10 s corresponds to cue offset. An increase in O2 signals in NAc was still evident between Days 22 and 50 for the S1⫹ cue. In the IFC, a significant increase for the S2⫺ cue was observed at 22 d of acquisition. From Day 28 to 50, no increases for any cues presented were observed. Black bars, p ⬍ 0.05 compared with the S2⫺ cue.
reward: a discriminative stimulus (S1⫹), which predicted the delivery of reward after an operant response (lever press) with 100% probability; and a nonrewarded stimulus (S2⫺), which had no response contingency or consequence. Auditory cues (tone or clicker) and rewarded lever position (left or right) were counterbalanced across the squad of animals. S1⫹ and S2⫺ cues were presented pseudorandomly in trains no greater than two. During all training steps, the session start was signaled by house-light onset, and its permanent offset indicated the end of a session. Training proceeded according to the following steps (adapted from Nicola et al., 2005). First, all animals were given a 30 min session to familiarize themselves with the recessed food magazine. Pellets were delivered on a variable interval (VI) 60 s schedule, and head entries were recorded. The next day, animals were trained to lever press for food pellets (45 min) on a concurrent VI 15 s–VI 15 s schedule. After 100 pellets were earned in a single session, cue association training began. From this point forward, a 30 min habituation period was added before the test session started to accommodate stabilization of the amperometric signal following application of the potential. S1⫹ and S2⫺ stimuli were presented during the test session for up to 60 s, where extension of the levers was coincident with stimulus onset. Pressing an active lever for S1⫹ terminated the cue, retracted both levers, and delivered a reward. Pressing for S2⫺ also terminated the cue and retracted both levers, but did not deliver reward. These sessions continued for 4 d. In subsequent sessions, stimulus presentation time was reduced to 10 s, again with lever extension coincident with stimulus onset. For each step of training, the percentages of HIT rate for the S1⫹ and S2⫺ cues was calculated as follows: percentage S1⫹ HIT ⫽ (number of S1⫹ correct lever presses/number of S1⫹ trails) ⫻ 100; and percentage S2⫺ HIT ⫽ (number of S2⫺ lever presses/number of S2⫺ trials) ⫻
100. Animals progressed to the final stage of training when they reached a criterion of ⬎75% of the S1⫹ HIT, while presentation of S2⫺ resulted in mainly omissions (⬍40% S2⫺ HIT). During the final stage of training, stimulus presentation time was maintained at 10 s, but the levers were only presented at cue offset. An active lever press after S1⫹ retracted both levers and delivered one pellet of food as a reward. This was followed by a 20 s interval (house light on) before the next trial started. An inactive lever press or omission was followed by a 20 s timeout (house light off) before the next trial began. Levers were available for 5 s before they retracted and an omission was recorded if neither was pressed in that time. As for S1⫹ presentation, both levers were also presented immediately following the S2⫺ stimulus. In this case, active or inactive lever presses, or withholding responding had no consequence. Following an S2⫺ presentation, there was a 20 s interval before the next trial. Animals were considered fully trained when they reached a criterion of ⬎75% active lever presses for S1⫹, while ⬍40% S2⫺ presentation resulted in a lever press for 3 consecutive days. Also, a discrimination index (DI) between the S1⫹ and S2⫺ cues was calculated as the number of (S1⫹ HIT)/(number of S1⫹ HITs and S2⫺ HITS). The task was considered as acquired when the DI reached the minimum value of 0.70. Amperometric recordings took place during each step of the training, and the O2 signal was recorded for the full length of the session. Behavioral performance was assessed by measuring the number of active (rewarded) and inactive (nonrewarded) lever presses, and the number of omissions for each stimulus. O2 amperometry recordings in the nucleus accumbens and infralimbic cortex during an extinction procedure. When animals were trained to successfully discriminate between a stimulus (S1⫹) that predicted the delivery of reward and a nonrewarded stimulus (S2⫺) with stable response ratios of ⬎75% for S1⫹ and ⬍40% for S2⫺ for 3 d, they were then
Francois et al. • Infralimbic Prefrontal Cortex, Accumbens, and Reward Learning
600 • J. Neurosci., January 8, 2014 • 34(2):596 – 607
subjected to an extinction procedure. During this procedure, the reward originally associated with the S1⫹ cue was no longer delivered, while the S2⫺ cue remained unrewarded as well. The S1⫹ cue–response association was considered to be fully extinguished when the animals exhibited a percentage S1⫹ HIT of ⬍10% following this cue. Amperometric recordings took place during each day of extinction, and the O2 signal was recorded for the full length of the behavioral session. As previously, behavioral performance was assessed by measuring the number of active and inactive lever presses, the number of omissions, and the response ratio for each stimulus.
Histology To confirm CPE placement at the end of experimentation, animals were deeply anesthetized with pentobarbital and perfused transcardially with 0.9% saline followed by 10% buffered paraformaldehyde. Brains were removed and placed in 10% buffered paraformaldehyde solution and shipped for histological processing (NeuroScience Associates), which involved coronal sectioning (40 m) through relevant brain areas using MultiBrain Technology (NeuroScience Associates) and staining with thionin for Nissl substance. Slides were viewed microscopically to assess the placement of electrode tips, and signals were obtained from any CPE with improper placement were excluded from all analyses.
Results Histology Following the exclusion of unstable or noisy signals, 9 animals had correct placements in the NAc and 10 animals had correct placements in the IFC that could be recorded from during the entire study. All graphs presented in this section represent the average responses of only those rats. Reconstructions of electrode placements in the infralimbic cortex and the nucleus accumbens are shown in Figure 1.
Figure 5. Deconstruction of behavioral responses associated with cue-dependent O2 signals recorded during task acquisition in the NAc. O2 signals were recorded during the whole course of acquisition, and average curves for representative days are depicted from the following time points: the first day of acquisition (DAY1); after 5, 11, 17, 22, 28, and 35 d of training; and when the animals were fully trained (DAY 50). O2 signal graphs have been presented as session averages according to the subtype of behavioral response exhibited for each cue: correct lever press (L⫹) following the S1⫹ cue (S1⫹/L⫹, black circles); omission (OM) following the S2⫺ cue (S2⫺/OM, white circles); incorrect lever press (L⫺) following the S1⫹ cue (S1⫹/L⫺, black circles); or lever press (LP) following the S2⫺ cue (S2⫺/LP, white circles). Each trial was analyzed for a 30 s period, including a 5 s baseline before cue onset (dashed line at 0 on the x-axis) and 25 s after. The second dashed line at 10 s corresponds to cue offset. On Day 1 of acquisition, the NAc responds to every lever press made by the animal regardless of the cue. On Days 5 and 11, NAc activation is specific for responses to the S1⫹ cue and disappears for responses to the S2⫺ cue. From Day 17, NAc activation is observed only for correct lever press following the S1⫹ cue. Black bars, p ⬍ 0.05 compared with the S2⫺ OM or LP; dashed bars, p ⬍ 0.05 compared with S1⫹/L⫺ response. Note that S1⫹/L⫺ responses include both incorrect lever presses and omissions following the S1⫹ cue and are highly underpowered due to the small number of these responses. These response types were therefore analyzed and represented only when a minimum of four animals could be averaged per session.
O2 amperometry recordings in the nucleus accumbens and infralimbic cortex during acquisition of a cued lever-press task After being trained to lever press for food, animals commenced acquisition of the cued lever-press task where they had to discriminate between S1⫹ and S2⫺ cues. Initially, rats responded to both the S1⫹ and the S2⫺ cues, but progressively learned to withhold responding to the S2⫺ cue. Indeed, after only one training session animals had reaching the a priori response criteria for the S1⫹ cue. However, discrimination between S1⫹ and S2⫺ cues only became significant after 11 d of training (repeated-measures ANOVA: main effect of CUE, F(1,16) ⫽ 50.921, p ⬍ 0.0001; main effect of DAYS, F(50,800) ⫽ 3.44; p ⬍ 0.0001; interaction, F(50,800) ⫽ 9.3; p ⬍ 0.0001; Fig. 2A). Animals were only considered as fully trained according to a priori response criteria after 49 d, when
they finally achieved press rates of ⬍40% to the S2⫺ cue for 3 consecutive days as well as a DI of ⬎0.7 (Fig. 2 A, B). O2 signals were recorded and analyzed every day during the whole course of task acquisition. For the AUC measure, a significant effect of cue (F(1,1) ⫽ 169.80, p ⬍ 0.05), days in training (F(46,46) ⫽ 1.63, p ⬍ 0.05), and their interaction (F(46,46) ⫽ 1.92, p ⬍ 0.01) was found for recordings from the NAc. For the IFC, a significant effect of cue (F(1,1) ⫽ 50.07, p ⬍ 0.01) but not of the days of training or the interaction was measured. The effect observed in the NAc was mainly driven by a greater activation of
Francois et al. • Infralimbic Prefrontal Cortex, Accumbens, and Reward Learning
J. Neurosci., January 8, 2014 • 34(2):596 – 607 • 601
1.54, p ⫽ 0.2; cue ⫻ time interaction, F(70,840) ⫽ 2.45, p ⫽ 0.2). This increase started at cue offset and reached its maximal amplitude 10 s after cue offset (Fig. 3C, DAY1). After 5 d of acquisition, this increase was still observed for the S1⫹ cue, starting as soon as 3 s after cue onset, while the S2⫺ cue no longer induced any change in the O2 signal (cue, F(1,19) ⫽ 12.8, p ⬍ 0.01; cue ⫻ time interaction, F(70,1330) ⫽ 7.37, p ⬍ 0.001; Figure 3C, DAY5). Similarly, at 11 d of acquisition, the O2 signal increase was observed only for the S1⫹ cue, and a significant difference between the signals induced by S1⫹ and S2⫺ signals could be observed during the onset of the cue (i.e., before extension of levers or reward delivery itself; cue, F(1,19) ⫽ 1.84, p ⬍ 0.01; cue ⫻ time interaction, F(70,1330) ⫽ 8.89, p ⬍ 0.001; p ⬍ 0.05 from 7 to 27 s after cue onset; Figure 3C, DAY11). For the remainder of acquisition, and after a significant behavioral discrimination was evident between S1⫹ and S2⫺ cues, the O2 signal remained qualitatively similar to that of day 11. An increase in O2 signal was observed only for the rewarded cue, beginning during cue presentation, although the magnitude of the response to the S1⫹ cue was relatively diminished by Day 17 (Figs. 3C, 4C). These data show that discrimination between S1⫹ and S2⫺ cues is reflected in differential O2 signals in the NAc as soon as after 5 d of acquisition, even if the behavioral indication of this discrimination becomes significant only after 11 d. As an analysis of amperometric signals with respect only to cues might be complicated in Figure 6. Deconstruction of behavioral responses associated with cue-dependent O2 signals recorded during acquisition in the part by differential behavioral responses IFC. O2 signals were recorded during the whole course of acquisition, and average curves for representative days are depicted from to those cues, a final analysis assessed O2 the following time points: the first day of acquisition (DAY1); after 5, 11, 17, 22, 28, and 35 d of training; and when the animals were signals on a behavioral basis, separated as fully trained (DAY50). O2 signal graphs have been presented as session averages according to the subtype of behavioral response (1) correct lever presses following S1⫹ exhibited for each cue: correct lever press (L⫹) following the S1⫹ cue (S1⫹/L⫹, black circles); omission (OM) following the S2⫺ cues, (2) incorrect lever presses and omiscue (S2⫺/OM, white circles); incorrect lever press (L⫺) following the S1⫹ cue (S1⫹/L⫺, black circles); or lever press (LP) sions following S1⫹ cues, (3) omissions following the S2⫺ cue (S2⫺/LP, white circles). Each trial was analyzed for a 30 s period including a 5 s baseline before cue onset following S2⫺ cues, and (4) lever presses (dashed line at 0 on the x-axis) and 25 s after. The second dashed line at 10 s corresponds to cue offset. On Day 1, IFC activation is observed for all response subtypes regardless of cue presentation. From Day 5 to Day 22, IFC activates mainly following the S2⫺ following S2⫺ cues. This analysis demoncue, regardless of response subtype. From Day 28 to 50, no significant difference could be observed between the different types of strated that on Day 1 of acquisition, the response. Black bars, p ⬍ 0.05 compared with the S2⫺ OM or LP; dashed bars, p ⬍ 0.05 compared with S1⫹/L- response. Note NAc was activated for every response that that S1⫹/L- responses include both incorrect lever presses and omissions following the S1⫹ cue and are highly underpowered involved a lever press regardless of the nadue to the small number of responses. They were therefore analyzed and represented only when a minimum of four animals could ture of the cue, while from Day 5 to Day 11 be averaged per session. only responses associated with the S1⫹ cue induced a NAc O2 signal increase (Fig. NAc for the S1⫹ cue. The cue effect observed in IFC was mainly 5). From Day 17 onward, NAc activation was observed only for driven by a greater activation for S2⫺ (Fig. 3 A, B). For ease of the S1⫹ cue and mainly for correct lever presses following this presentation, average O2 amperometric curves are shown only cue. NAc O2 increases could also be observed in some instances for representative days across the course of this acquisition pefollowing incorrect lever presses and omissions following S1⫹ riod. Days 1, 5, 11, and 17 have been chosen to represent the early cue presentations, but, due to the very small number of these phase of acquisition (Fig. 3), Days 22, 28, and 35 for the late phase response types, the data remain very difficult to interpret (Fig. 5). of acquisition, and Day 50 for when animals were fully trained In IFC, on the first day of acquisition a similar increase in O2 signal was observed for both S1⫹ and S2⫺ cues (F ⬍ 1). This (Fig. 4). In the NAc, on the first day of acquisition, an increase in O2 increase started at cue offset and reached maximal amplitude 12 s signal was observed for both the S1⫹ and S2⫺ cues (cue, F(1,12) ⫽ after (Fig. 3D, DAY1). After 5 d of acquisition, this increase in O2
602 • J. Neurosci., January 8, 2014 • 34(2):596 – 607
Francois et al. • Infralimbic Prefrontal Cortex, Accumbens, and Reward Learning
was still observed for the S2⫺ cue, while the increase associated with the S1⫹ cue was no longer present (Fig. 3D, DAY5). A significant difference was observed between S1⫹ and S2⫺ signals on that day (ANOVA: cue, F(1,16) ⫽ 4.2, p ⫽ 0.02; cue ⫻ time interaction, F(66,1056) ⫽ 2.60; p ⬍ 0.0001). After 11 d of acquisition, the O2 signal increase was still observed for the S2⫺ cue, and a significant difference between the signals induced by S1⫹ and S2⫺ cues could be observed during cue onset (ANOVA: cue, F(1,20) ⫽ 7.04, p ⫽ 0.01; cue ⫻ time interaction, F(70,1400) ⫽ 3.93; p ⬍ 0.0001; Figure 3D, DAY11). This effect persisted on Days 17 and 22, respectively (cue, F(1,20) ⫽ 4.1, p ⫽ 0.049; and cue ⫻ time interaction, F(70,1540) ⫽ 1.78, Figure 7. Behavioral performance during extinction. A, The percentage of HITs for S1⫹ cues (black circle) and S2⫺ cues (white p ⬍ 0.01), but for the remaining acquisi- circle), and the total number of lever presses regardless of cue (right). Values are represented as the mean ⫾ SEM. Cue discrimition sessions that were analyzed in detail nation is no longer observed after 3 days of extinction (left), and the total number of lever presses significantly decreases by Day 2 (right). *p ⬍ 0.05 compared with S2⫺ cue; #p ⬍ 0.05 compared with Day 0. B, Analysis of response subtype: number of trials, (Day 28, 35, and 53), no significant number of rewarded lever presses (L⫹), number of nonrewarded lever presses (L⫺), and number of omissions (OM) for S1⫹ cues changes in O2 signal could be observed for (black circle) and S2⫺ cues (white circle). Over the course of extinction, a decrease in the number of L⫹ responses is observed either cue (Fig. 4D). Altogether, these data concomitant with an increase in omissions, while the number of L⫺ responses remains unchanged. *p ⬍ 0.05 S⫹ response show a transient activation of the IFC dur- compared with ACQ day; #p ⬍ 0.05, S2⫺ compared with acquisition (ACQ) day. ing the first 3 weeks of acquisition for the S2⫺ cue, and only on the first day for the F(4,88) ⫽ 47.04, p ⬍ 0.0001; interaction, F(4,88) ⫽ 43.7, p ⬍ 0.0001; S1⫹ cue. As for the NAc, a final analysis separating each subtype Fig. 7A). Figure 7B details the performance of animals by reof behavioral response associated with cue-dependent O2 signals sponse subtype, illustrating that the decrease in S1⫹ HIT rewas performed. This showed that on Day 1 of acquisition, the IFC sponding results from a decrease in the number of correct lever was activated for every response regardless of the cue, while from presses and an increase in the number of omissions following the Day 5 to Day 22 only responses associated with the S2⫺ cue cue, while no significant changes were observed in the number of induced an IFC O2 signal increase (Fig. 6). IFC O2 increases could incorrect lever presses (behavioral response, F(3,44) ⫽ 483.7, p ⬍ also be observed in some instances following incorrect lever 0.0001; behavioral response ⫻ days interaction, F(12,176) ⫽ 122.6, presses and omissions following the S1⫹ cue, but, as for the NAc p ⬍ 0.0001). signals, the relative lack of such responses makes interpretation In terms of NAc O2 signal, repeated-measures ANOVA demdifficult (Fig. 6). From Day 28 onward, IFC activation was no onstrated a significant effect of cue (F(1,82) ⫽ 35.67, p ⬍ 0.0001), longer consistently observed for any response subtype following no significant effect of extinction day (F(4,82) ⫽ 1.12, p ⫽ 0.34), a the S1⫹ cue (Fig. 6). significant effect of their interaction (cue ⫻ days interaction, F(4,82) ⫽ 2.59, p ⬍ 0.05), and a triple interaction (time ⫻ cue ⫻ O2 amperometry recordings in the nucleus accumbens and day interaction, F(276,5658) ⫽ 2.18, p ⬍ 0.0001). At stable perforinfralimbic cortex during an extinction procedure mance (Day 0 of extinction), an increase in the O2 signal was After reaching stable response ratios of ⬎75% for the S1⫹ and observed in NAc in response to S1⫹ cue presentation, while no ⬍40% for the S2⫺ cues for 3 consecutive days on the task, anichanges were observed for the S2⫺ cue. On the first day of exmals underwent an extinction procedure. Food reward was no tinction, this increase was still observed for the S1⫹ cue and was longer delivered for a lever press following the S1⫹ cue, with no still significantly different from the S2⫺ signal (Fig. 8A, DAY1). change to the lack of contingency of the S2 cue. Four days of this From Day 2 onward, NAc O2 increases were no longer observed, procedure were necessary for the cue–response association to and the difference between S1⫹ and S2⫺ cue-induced signals fully extinguish, i.e., when animals reached a ratio of ⬍10% lever were no longer significant (Fig. 8A, DAY2, DAY3, DAY4). Howpresses to the S1⫹ cue. As shown in Figure 7A, the number of ever, a small but significant difference between O2 changes assocorrect lever presses following the S1⫹ cue (% HIT) progresciated with S1⫹ and S2⫺ cues could still be observed on Day 3, sively decreased across sessions, and a significant difference combut was mainly due to a decrease of the signal associated with the pared with stable performance (Day 0) was observed from Day 2 S2⫺ cue rather than an increase in the signal associated with the of extinction (repeated-measures ANOVA: cue, F(1,22) ⫽ S1⫹ cue. 22.77, p ⬍ 0.0001; days, F(4,88) ⫽ 71.16, p ⬍ 0.0001; interaction, In the IFC, a different pattern of activation was observed F(4,88) ⫽ 14.78, p ⬍ 0.0001). While a behavioral S1⫹/S2⫺ cue across extinction sessions compared with the NAc. A significant discrimination remained significant on Days 1 and 2 of extinceffect of cue (F(1,89) ⫽ 5.23, p ⬍ 0.05), no significant effect of tion, this was no longer observed on Days 3 and 4 (repeatedextinction day (F(4,89) ⫽ 1.8, p ⫽ 0.13), and no effect of their measures ANOVA: cue, F(1,22) ⫽ 22.77, p ⬍ 0.0001; days, F(4,88) ⫽ interaction (cue ⫻ days interaction, F(4,89) ⫽ 0.35, p ⫽ 0.83) or of 71.16, p ⬍ 0.0001; interaction, F(4,88) ⫽ 14.78, p ⬍ 0.0001; Figure the triple interaction (time ⫻ cue ⫻ day interaction, F(276,6141) ⫽ 7A). Similarly, the total number of lever presses remained un0.44, p ⫽ 1) was found. At stable performance (Day 0), no changed on the first day of extinction, but was significantly dechanges were observed in the O2 signal in the IFC for either cue creased from the second day of extinction onward (repeated(ANOVA: cue, F(1,18) ⫽ 0.28, p ⫽ 0.59; time, F(59,1062) ⫽ 2.94, p ⬍ measures ANOVA: cue F(1,22) ⫽ 107.91, p ⬍ 0.0001; days,
Francois et al. • Infralimbic Prefrontal Cortex, Accumbens, and Reward Learning
J. Neurosci., January 8, 2014 • 34(2):596 – 607 • 603
Figure 8. O2 signal recorded during 4 d of task extinction. A, B, O2 signal changes recorded simultaneously in NAc (A) and IFC (B) during extinction (Days 1– 4), with stable pre-extinction baseline presented as Day 0. Values are presented as an average of the 30 S1⫹ cue (black circle) and the 30 S2⫺ cue (white circle) trials. Each trial was analyzed for a 30 s period, including a 5 s baseline before cue onset (dashed line at 0 on the x-axis) and 25 s after. The second dashed line at 10 s corresponds to cue offset. NAc O2 signals to the S1⫹ cue progressively decrease during extinction, while IFC activates only on the first day of the procedure. Black bars, p ⬍ 0.05 compared with S2⫺ cue.
0.001; cue ⫻ time interaction, F(59,1062) ⫽ 1.02, p ⫽ 0.42). However, on the first day of extinction a significant O2 signal increase was observed following S1⫹ cue presentation (ANOVA: cue, F(1,18) ⫽ 2.38, p ⫽ 0.13; time, F(59,1062) ⫽ 2.71, p ⬍ 0.001; cue ⫻ time interaction, F(59,1062) ⫽ 2.16, p ⬍ 0.0001; Figure 8B). On subsequent days, this increase was no longer observed, and no significant difference between S1⫹ and S2⫺ cues could be observed (Fig. 8B). These data show that, in a manner similar to behavioral performance, NAc activation following S1⫹ cue presentation was maintained on the first day of extinction but was no longer observed during the subsequent extinction procedure. IFC had a completely different pattern of activation, with a pronounced increase in O2 signal only on the first day of extinction. These patterns of NAc and IFC activation can be observed at the level of the individual animal. As presented in Figure 9, A and B, progressive decreases in O2 signal amplitude in NAc and the transient IFC O2 increase on Day1 of extinction can clearly be observed in a representative animal. It appears that when comparing the AUC extracted from O2 signals to the total number of lever presses made by animals across extinction sessions, the pattern of NAc activation observed matches the behavior, while a totally different pattern is observed for the IFC (Fig. 9C), and a significant positive correlation was observed between NAc AUC and lever presses for S1⫹ cue, but not for IFC (Fig. 9D). Again, a final analysis considered the response subtypes exhibited during extinction, and O2 signals were analyzed according to the following: (1) correct lever presses following S1⫹ cues; (2) incorrect lever presses and omissions following S1⫹ cues; (3) omissions following S2⫺ cues; and (4) lever presses following S2⫺ cues. In NAc, repeated-measures ANOVA gave a significant effect of cue (F(3,153) ⫽ 12.7, p ⬍ 0.0001), no significant effect of extinction day (F(4,158) ⫽ 0.39, p ⫽ 0.809), a significant effect of
their interaction (cue ⫻ days interaction, F(12,158) ⫽ 1.89, p ⬍ 0.05), and no effect of the triple interaction (time ⫻ cue ⫻ day interaction, F(828,10902) ⫽ 0.89, p ⫽ 0.98). At stable performance before extinction commenced (Day 0), significant O2 increases were observed following a correct response to the S1⫹ cue (Fig. 10). During extinction, this increase remained significant during the first 3 d but was no longer observed on Day 4. No other changes in NAc O2 signal were significant during extinction (Fig. 10). In IFC, a significant effect of cue (F(3,191) ⫽ 3.16, p ⬍ 0.05), no significant effect of extinction day (F(4,191) ⫽ 1.77, p ⫽ 0.13) or their interaction (cue ⫻ days interaction, F(12,191) ⫽ 1.06, p ⫽ 0.39), and a significant effect of the triple interaction (time ⫻ cue ⫻ day interaction, F(828,13179) ⫽ 1.12; p ⬍ 0.01) were found. Before extinction, the IFC O2 signal did not significantly differ from baseline for any response subtype. However, on the first day of extinction a significant increase could be observed for both correct responses and omissions following the S1⫹ cue, while no changes occurred for signals related to the S2⫺ cue (Fig. 11). This increase was maintained until the fourth day of extinction for correct lever presses following S1⫹ cue, but was lost by the second day of extinction for omissions (Fig. 11).
Discussion During learning of a cue-rewarded lever press task, brain tissue oxygen levels increased in NAc specifically following the onset of the rewarded cue, both during acquisition and the first days of extinction. In contrast, IFC was activated predominantly to the nonrewarded cue during the early stages of acquisition and almost exclusively for the nonrewarded cue during extinction. These different activation patterns suggest different roles of NAc and IFC in reward-based learning over time, where NAc might be postulated to promote action toward anticipated positive out-
604 • J. Neurosci., January 8, 2014 • 34(2):596 – 607
Francois et al. • Infralimbic Prefrontal Cortex, Accumbens, and Reward Learning
comes and the IFC might be involved in the suppression of unrewarded actions at different points during learning. NAc activation during the anticipation phase of cued reward tasks in both humans and rodents is well known (Knutson et al., 2001; Nicola et al., 2004b). Our findings are consistent with previous reports that excitatory responses in the NAc are observed for reward predictive cues well before movement begins (McGinty et al., 2013). Indeed, as NAc activation persisted during the first day of extinction, and as lever pressing following the S2⫺ cue did not induce activation, activity in this region is consistent with coding of aspects of reward anticipation rather than motor response or reward receipt. By measuring regional activity during the entire learning process, NAc activation was observed even during the first day of acquisition for both cues presented. The NAc O2 signal significantly “discriminated” between S⫹ and S⫺ cues by Day 5 of acquisition, an effect that persisted as long as discrimination was subsequently tested. Consistent with such a potential role of NAc in the early phase of learning to promote rewarded motor actions are findings that dopamine release in the NAc invigorates behavioral responding (Berridge and Robinson, 1998; Robbins and Everitt, 2007), that neural activity in the NAc is related to learning of cue– outcome associations during odor discrimination acquisition (Setlow et al., 2003), that NAc microinjections of dopamine receptor an- Figure 9. Effect of the extinction procedure on the S⫹ cue-induced O2 signal in the NAc and the IFC. A, B, O2 signal changes tagonist can markedly reduce the ability of induced by the S⫹ cue presentation in the NAc (A) and the IFC (B) before extinction (Day 0) and after extinction (Days 1, 2, 3 and 4) for a single representative animal. C, Average AUC obtained in the NAc and the PFC (left and right graphs, respectively) analyzed animals to exhibit reward seeking in re- before extinction (day 0) and after extinction (Days 1, 2, 3, and 4). At the level of the population, a significant decrease in NAc AUC sponse to predictive cues (Nicola, 2007; was obtained for Days 2, 3, and 4 of extinction, while a significant increase in IFC AUC was observed only on Day 1 of extinction. Ambroggi et al., 2008), and that bilateral #p ⬍ 0.05 compared with last day of acquisition (Day 0). D, Correlation between the AUC measured in the NAc and the IFC and the lesion of NAc impairs second-order pav- number of lever presses associated with S⫹ cue performed by the each animal. A significant positive correlation was obtained only lovian conditioning (McDannald et al., for the NAc. 2013). The pattern of NAc activation observed during extinction in the present study substantiates this viewpoint, as the progressive decrease in ies in trained animals have clearly shown small NAc neuronal magnitude of the O2 signals induced by S⫹ cue was correlated responses to nonrewarding cues (Nicola et al., 2004a), which with the progressive decrease in behavioral output. Note, that were not detected in the present study. But, as for BOLD fMRI, NAc activation patterns are also compatible with another reO2 amperometry is believed to measure an integrated signal from a neuronal population, and may not always reflect excitation of a cently described hypothesis suggesting that accumbens dopasubset of that population (i.e., those neurons responsive to nonmine critically promotes behavioral engagement following cue rewarding cues) if, for instance, there was an equally large subset presentation when an action set has to be flexibly chosen from a of inhibitory neurons opposing this effect. Ambroggi et al. (2011) repertoire for each instance of reward availability (Nicola, 2010), show exactly this balance of excitatory and inhibitory responses which is consistent with the continued robust activation of NAc to nonrewarded stimuli in NAc core and shell, and it is difficult to when reward-predictive stimuli triggered behavioral responses in conclude at present what this might mean for a contingent hethis study. modynamic response. Finally, the apparent temporal lag between Several potential limitations of the amperometric technique NAc activation, as measured by electrophysiology, and ampershould be addressed. First, it might be thought that decreases in ometry might raise concern. The amperometric signal peaked at signal amplitude over time may simply result from decreases in ⬃18 s after cue onset in our study, although in previous studies electrode sensitivity. This is very unlikely as previous studies have neuronal firing has been shown to occur at cue onset (Nicola et confirmed that stable O2 responses are observable for several al., 2004b). However, it is well known that there is a temporal lag months in vivo (Fillenz and O’Neill, 1986; Bolger et al., 2011; Francois et al., 2012). Second, previous electrophysiological studbetween neuronal activity and traditional BOLD responses
Francois et al. • Infralimbic Prefrontal Cortex, Accumbens, and Reward Learning
J. Neurosci., January 8, 2014 • 34(2):596 – 607 • 605
Figure 10. NAc O2 signals for subtypes of behavioral response during extinction. O2 signal changes recorded during extinction (Days 1– 4), with stable pre-extinction baseline presented as Day 0. A, B, O2 signal graphs have been presented as session averages according to the subtype of behavioral response exhibited for each cue: correct lever press following the S1⫹ cue (A, S1⫹/L⫹, black circles), omission following the S2⫺ cue (A, S2⫺/OM, white circles), incorrect lever press following the S1⫹ cue (B, S1⫹/L⫺, black circles), or lever press (LP) following the S2⫺ cue (B, S2⫺/LP, white circles). Each trial was analyzed for a 30 s period including a 5 s baseline before cue onset (vertical line at 0 on the x-axis) and 25 s after. The second vertical line at 10 s corresponds to cue offset. NAc O2 signals decrease for correct lever presses to the S1⫹ cue on Day 1 of extinction and persist in this manner until Day 3. No changes in the O2 signal could be observed for both the incorrect responses and the omissions (OMs) to the S2⫺ cue. Black bars: p ⬍ 0.05, compared with the S2⫺/OM response.
Figure 11. IFC O2 signals for subtypes of behavioral response during extinction. O2 signal changes recorded during extinction (Days 1– 4), with stable pre-extinction baseline presented as Day 0. A, B, O2 signal graphs have been presented as session averages according to the subtype of behavioral response exhibited for each cue: correct lever press (L⫹) following the S1⫹ cue (A, S1⫹/L⫹, black circles); omission (OM) following the S2⫺ cue (A, S2⫺/OM, white circles); incorrect lever press (L⫺) following the S1⫹ cue (B, S1⫹/L⫺, black circles); or lever press (LP) following the S2⫺ cue (B, S2⫺/LP, white circles). Each trial was analyzed for a 30 s period including a 5 s baseline before cue onset (vertical line at 0 on the x-axis) and 25 s after. The second vertical line at 10 s corresponds to cue offset. The O2 signal in the IFC shows an increase to both the lever press and omission following the S1⫹ cue on Day 1 of extinction. This increase is maintained for a response to the S1⫹ until Day 4 of extinction, while the increase to the omissions is lost on Day 2. No changes could be observed for both the lever press and omissions to the S2⫺ cue. Black bars: p ⬍ 0.05, compared with the S2⫺/OM response.
606 • J. Neurosci., January 8, 2014 • 34(2):596 – 607
(Logothetis et al., 2001), and this same lag is likely to happen with amperometric signals. Further, there are notable differences in study protocols, where levers were only presented to animals 5 s after cue offset in our study, potentially making this event more salient than cue onset. If true, this might account for the apparent “delay” in O2 response relative to cue onset, though further studies would be required to definitively address this topic. In contrast to NAc, IFC activated during both acquisition and extinction predominantly in response to the S⫺ cue, perhaps suggestive of a role for this structure in suppression of unrewarded actions. These findings are consistent with other studies showing a similar role of IFC during performance of rewarded motor actions and their extinction. Inactivation of IFC increases impulsive choices during goal-directed actions for rewards of different magnitude (Gill et al., 2010), increases the number of unrewarded actions during a cued appetitive task (Ghazizadeh et al., 2012), and prevents extinction of cocaine-seeking behavior (Peters et al., 2008). Similarly, activation of IFC neurons has been shown to mediate extinction of tone–shock pairings in fearconditioning studies (Milad and Quirk, 2002). Compared with these studies assessing IFC activity during stable task performance, it may seem inconsistent therefore that IFC activation following the S⫺ cue occurred only during the early phase of learning and not consistently at stable performance in our study. However, the lack of IFC activity at stable performance might simply be explained by the length of training the animals had undergone by this stage. It would seem reasonable that after 55 training sessions, animals were likely performing a set of habitual actions that might not require any feedback control from the IFC. Alternatively, the present data may reflect potential dissociations between patterns and densities of neuronal firing in IFC and their ability to evoke a BOLD-like O2 response (i.e., the IFC could indeed be active throughout learning but only at certain time periods does its pattern of activation evoke a measurable amperometric O2 response). Such dissociations have been postulated in imaging literature, and would require combined electrophysiological and amperometric analyses to resolve. IFC activation was not always completely specific for the S⫺ cue. For instance, on the first day of acquisition where animals were initially exposed to cues, the IFC responded to both S⫺ and S⫹ cues. IFC activation was also observed for responses to the previously rewarded S⫹ cue (now S⫺ cue) during the first 3 d of extinction. These findings recall reports from neurophysiological studies during decision-making tasks where PFC activity has been postulated to encode error likelihood (Rushworth and Behrens, 2008). In this regard, IFC in our study will be under the greatest demand when novel contingences occur in the environment, such as when the discrimination rule is originally learned in the present study, and also when the extinction procedure is initially applied. An alternative explanation for IFC activation during early extinction could be that the animals were simply conflicted by a new situation (Coutureau and Killcross, 2003). However, this is likely not a sufficient explanation, as IFC activation was occasionally observable during stages of the study when behavioral conflict would not be anticipated (e.g., after 17 and 22 d of acquisition for the S2⫺ cue and for unrewarded responses following the S1⫹ cue as late as 35 d of acquisition). In conclusion, the longitudinal analysis offered by in vivo O2 amperometry has provided a novel insight into the temporal organization of NAc and IFC regional activity during learning. Amperometry revealed patterns of activation of the NAc and IFC suggesting differential roles of these structures during reward-
Francois et al. • Infralimbic Prefrontal Cortex, Accumbens, and Reward Learning
based learning. NAc activated during the entire learning process and likely coded for a cue-driven reward expectation signal that promotes actions leading to positive outcome. IFC activated during the earliest phases of new learning (i.e., when environmental contingencies emerged or changed), perhaps suggesting a “teaching” role with regard to accumbens-driven selection of action sets. IFC responses were also predominantly to nonrewarded cues, perhaps suggesting a role of this structure in suppressing currently unproductive actions (or alternatively reflecting activation to a conflicting situation). A recent human fMRI study has proposed such a model where dorsolateral PFC integrates and transmits representations of reward to the mesolimbic dopaminergic system, thereby initiating motivated behavior (Ballard et al., 2011). This idea is certainly supported by the neuroanatomical organization of these circuits (Sesack and Pickel, 1992), and, as dopamine alone does not directly excite NAc neurons (Nicola et al., 2000), it suggests that a facilitatory excitatory glutamatergic input from the PFC might be necessary here. O2 amperometric signals measured in this study share clear similarities to those measured in human fMRI studies and are also concordant with results from both previous neuroanatomical and electrophysiological studies performed in goal-directed tasks. This technique therefore offers a unique perspective when bridging between measures of neuronal activation and imaging in rats and humans.
References Ambroggi F, Ishikawa A, Fields HL, Nicola SM (2008) Basolateral amygdala neurons facilitate reward-seeking behavior by exciting nucleus accumbens neurons. Neuron 59:648 – 661. CrossRef Medline Ambroggi F, Ghazizadeh A, Nicola SM, Fields HL (2011) Roles of nucleus accumbens core and shell in incentive-cue responding and behavioral inhibition. J Neurosci 31:6820 – 6830. CrossRef Medline Ballard IC, Murty VP, Carter RM, MacInnes JJ, Huettel SA, Adcock RA (2011) Dorsolateral prefrontal cortex drives mesolimbic dopaminergic regions to initiate motivated behavior. J Neurosci 31:10340 –10346. CrossRef Medline Ballard K, Knutson B (2009) Dissociable neural representations of future reward magnitude and delay during temporal discounting. Neuroimage 45:143–150. CrossRef Medline Bechara A, Van Der Linden M (2005) Decision-making and impulse control after frontal lobe injuries. Curr Opin Neurol 18:734 –739. CrossRef Medline Berridge KC, Robinson TE (1998) What is the role of dopamine in reward: hedonic impact, reward learning, or incentive salience? Brain Res Brain Res Rev 28:309 –369. CrossRef Medline Bolger FB, McHugh SB, Bennett R, Li J, Ishiwari K, Francois J, Conway MW, Gilmour G, Bannerman DM, Fillenz M, Tricklebank M, Lowry JP (2011) Characterisation of carbon paste electrodes for real-time amperometric monitoring of brain tissue oxygen. J Neurosci Methods 195:135–142. CrossRef Medline Brog JS, Salyapongse A, Deutch AY, Zahm DS (1993) The patterns of afferent innervation of the core and shell in the “accumbens” part of the rat ventral striatum: immunohistochemical detection of retrogradely transported fluoro-gold. J Comp Neurol 338:255–278. CrossRef Medline Coutureau E, Killcross S (2003) Inactivation of the infralimbic prefrontal cortex reinstates goal-directed responding in overtrained rats. Behav Brain Res 146:167–174. CrossRef Medline Dalley JW, Cardinal RN, Robbins TW (2004) Prefrontal executive and cognitive functions in rodents: neural and neurochemical substrates. Neurosci Biobehav Rev 28:771–784. CrossRef Medline Day JJ, Wheeler RA, Roitman MF, Carelli RM (2006) Nucleus accumbens neurons encode pavlovian approach behaviors: evidence from an autoshaping paradigm. Eur J Neurosci 23:1341–1351. CrossRef Medline Fillenz M, O’Neill RD (1986) Effects of light reversal on the circadian pattern of motor activity and voltammetric signals recorded in rat forebrain. J Physiol 374:91–101. Medline Francois J, Conway MW, Lowry JP, Tricklebank MD, Gilmour G (2012) Changes in reward-related signals in the rat nucleus accumbens measured
Francois et al. • Infralimbic Prefrontal Cortex, Accumbens, and Reward Learning by in vivo oxygen amperometry are consistent with fMRI BOLD responses in man. Neuroimage 60:2169 –2181. CrossRef Medline Ghazizadeh A, Ambroggi F, Odean N, Fields HL (2012) Prefrontal cortex mediates extinction of responding by two distinct neural mechanisms in accumbens shell. J Neurosci 32:726 –737. CrossRef Medline Gill TM, Castaneda PJ, Janak PH (2010) Dissociable roles of the medial prefrontal cortex and nucleus accumbens core in goal-directed actions for differential reward magnitude. Cereb Cortex 20:2884 –2899. CrossRef Medline Goto Y, Grace AA (2005) Dopaminergic modulation of limbic and cortical drive of nucleus accumbens in goal-directed behavior. Nat Neurosci 8:805– 812. CrossRef Medline Hitchman ML (1978) Measurement of dissolved oxygen, p 103. New York: Wiley & Sons. Ito M, Doya K (2009) Validation of decision-making models and analysis of decision variables in the rat basal ganglia. J Neurosci 29:9861–9874. CrossRef Medline Jodo E, Suzuki Y, Kayama Y (2000) Selective responsiveness of medial prefrontal cortex neurons to the meaningful stimulus with a low probability of occurrence in rats. Brain Res 856:68 –74. CrossRef Medline Justice JB (1987) Introduction to in-vivo voltametry. In: Voltammetry in the neurosciences: principles, methods and applications. Clifton NJ: Humana. Knutson B, Fong GW, Adams CM, Varner JL, Hommer D (2001) Dissociation of reward anticipation and outcome with event-related fMRI. Neuroreport 12:3683–3687. CrossRef Medline Logothetis NK, Pauls J, Augath M, Trinath T, Oeltermann A (2001) Neurophysiological investigation of the basis of the fMRI signal. Nature 412: 150 –157. CrossRef Medline Lowry JP, Boutelle MG, O’Neill RD, Fillenz M (1996) Characterization of carbon paste electrodes in vitro for simultaneous amperometric measurement of changes in oxygen and ascorbic acid concentrations in vivo. Analyst 121:761–766. CrossRef Medline Lowry JP, Boutelle MG, Fillenz M (1997) Measurement of brain tissue oxygen at a carbon past electrode can serve as an index of increases in regional cerebral blood flow. J Neurosci Methods 71:177–182. CrossRef Medline Lowry JP, Griffin K, McHugh SB, Lowe AS, Tricklebank M, Sibson NR (2010) Real-time electrochemical monitoring of brain tissue oxygen: a surrogate for functional magnetic resonance imaging in rodents. Neuroimage 52:549 –555. CrossRef Medline McDannald MA, Setlow B, Holland PC (2013) Effects of ventral striatal lesions on first- and second-order appetitive conditioning. Eur J Neurosci 38:2589 –2599. CrossRef Medline McGinty VB, Lardeux S, Taha SA, Kim JJ, Nicola SM (2013) Invigoration of reward seeking by cue and proximity encoding in the nucleus accumbens. Neuron 78:910 –922. CrossRef Medline McHugh SB, Fillenz M, Lowry JP, Rawlins JN, Bannerman DM (2011) Brain tissue oxygen amperometry in behaving rats demonstrates functional dissociation of dorsal and ventral hippocampus during spatial processing and anxiety. Eur J Neurosci 33:322–337. CrossRef Medline Milad MR, Quirk GJ (2002) Neurons in medial prefrontal cortex signal memory for fear extinction. Nature 420:70 –74. CrossRef Medline Nicola SM (2007) The nucleus accumbens as part of a basal ganglia action selection circuit. Psychopharmacology 191:521–550. CrossRef Medline Nicola SM (2010) The flexible approach hypothesis: unification of effort and cue-responding hypotheses for the role of nucleus accumbens dopa-
J. Neurosci., January 8, 2014 • 34(2):596 – 607 • 607 mine in the activation of reward-seeking behavior. J Neurosci 30:16585– 16600. CrossRef Medline Nicola SM, Surmeier J, Malenka RC (2000) Dopaminergic modulation of neuronal excitability in the striatum and nucleus accumbens. Annu Rev Neurosci 23:185–215. CrossRef Medline Nicola SM, Yun IA, Wakabayashi KT, Fields HL (2004a) Firing of nucleus accumbens neurons during the consummatory phase of a discriminative stimulus task depends on previous reward predictive cues. J Neurophysiol 91:1866 –1882. CrossRef Medline Nicola SM, Yun IA, Wakabayashi KT, Fields HL (2004b) Cue-evoked firing of nucleus accumbens neurons encodes motivational significance during a discriminative stimulus task. J Neurophysiol 91:1840 –1865. CrossRef Medline Nicola SM, Taha SA, Kim SW, Fields HL (2005) Nucleus accumbens dopamine release is necessary and sufficient to promote the behavioral response to reward-predictive cues. Neuroscience 135:1025–1033. CrossRef Medline O’Neill RD, Gru¨newald RA, Fillenz M, Albery WJ (1982) Linear sweep voltammetry with carbon paste electrodes in the rat striatum. Neuroscience 7:1945–1954. CrossRef Medline Paxinos G, Watson C (2004) The rat brain in stereotaxic coordinates, 5th edition. Burlington, MA: Elsevier Academic. Peters J, LaLumiere RT, Kalivas PW (2008) Infralimbic prefrontal cortex is responsible for inhibiting cocaine seeking in extinguished rats. J Neurosci 28:6046 – 6053. CrossRef Medline Robbins TW, Everitt BJ (2007) A role for mesencephalic dopamine in activation: commentary on Berridge (2006). Psychopharmacology 191:433– 437. CrossRef Medline Roesch MR, Singh T, Brown PL, Mullins SE, Schoenbaum G (2009) Ventral striatal neurons encode the value of the chosen action in rats deciding between differently delayed or sized rewards. J Neurosci 29:13365–13376. CrossRef Medline Rushworth MF, Behrens TE (2008) Choice, uncertainty and value in prefrontal and cingulate cortex. Nat Neurosci 11:389 –397. CrossRef Medline Schoenbaum G, Chiba AA, Gallagher M (1998) Orbitofrontal cortex and basolateral amygdala encode expected outcomes during learning. Nat Neurosci 1:155–159. CrossRef Medline Sesack SR, Pickel VM (1992) Prefrontal cortical efferents in the rat synapse on unlabeled neuronal targets of catecholamine terminals in the nucleus accumbens septi and on dopamine neurons in the ventral tegmental area. J Comp Neurol 320:145–160. CrossRef Medline Setlow B, Schoenbaum G, Gallagher M (2003) Neural encoding in ventral striatum during olfactory discrimination learning. Neuron 38:625– 636. CrossRef Medline Taha SA, Nicola SM, Fields HL (2007) Cue-evoked encoding of movement planning and execution in the rat nucleus accumbens. J Physiol 584:801– 818. CrossRef Medline Wan X, Peoples LL (2006) Firing patterns of accumbal neurons during a pavlovian-conditioned approach task. J Neurophysiol 96:652– 660. CrossRef Medline Watanabe M, Sakagami M (2007) Integration of cognitive and motivational context information in the primate prefrontal cortex. Cereb Cortex 17 [Suppl 1]:i101–i109. CrossRef Wise RA (2004) Rewards wanted: molecular mechanisms of motivation. Discov Med 4:180 –186. Medline