March 15, 2006 / Vol. 31, No. 6 / OPTICS LETTERS
775
Diffraction phase microscopy for quantifying cell structure and dynamics Gabriel Popescu George R. Harrison Spectroscopy Laboratory, Massachusetts Institute of Technology, Cambridge, Massachusetts 02139
Takahiro Ikeda Hamamatsu Photonics K.K., 5000 Hirakuchi, Hamamatsu, Shizuoka, 434-8601, Japan
Ramachandra R. Dasari and Michael S. Feld George R. Harrison Spectroscopy Laboratory, Massachusetts Institute of Technology, Cambridge, Massachusetts 02139 Received September 23, 2005; revised November 12, 2005; accepted December 5, 2005; posted December 5, 2005 (Doc. ID 64991) We have developed diffraction phase microscopy as a new technique for quantitative phase imaging of biological structures. The method combines the principles of common path interferometry and single-shot phase imaging and is characterized by subnanometer path-length stability and millisecond-scale acquisition time. The potential of the technique for quantifying nanoscale motions in live cells is demonstrated by experiments on red blood cells. © 2006 Optical Society of America OCIS codes: 180.0180, 170.1530, 170.1470.
Phase contrast (PC) and differential interference contrast (DIC) microscopy have been used extensively to infer morphometric features of cells without the need for exogenous contrast agents.1 These techniques transfer the information encoded in the phase of the imaging field into the intensity distribution of the final image. Thus the optical phase shift through a given sample can be regarded as a powerful endogenous contrast agent, as it contains information about both the thickness and the refractive index of the sample. From this point of view, mature erythrocytes [red blood cells (RBCs)] represent a very particular type of structure: they lack nuclei and major organelles and thus can be modeled as optically homogeneous objects, i.e., they produce local optical phase shifts that are proportional to their thickness. Therefore, measuring quantitative phase images of RBCs provides cell thickness profiles with an accuracy that corresponds to a small fraction of the optical wavelength. Such nanoscale topographic information provides insight into the biophysical properties and health state of the cell.2 Since traditional optical microscopy techniques, such as DIC and PC, render only qualitative information about the phase shifts associated with the sample, 3D quantitative erythrocyte shape measurements have been limited to atomic force and scanning electron microscopy. However, because of the limitations imposed by sample preparation, these techniques have minimal applicability to cells under physiological and dynamic conditions.3,4 Fourier phase microscopy (FPM) has been developed in our laboratory as a modality to extract quantitative phase images with subnanometer pathlength sensitivity over time periods from seconds to a cell life cycle.5 To quantify rapid biological phenomena, such as millisecond-scale RBC membrane fluctuations, Hilbert phase microscopy (HPM) has also 0146-9592/06/060775-3/$15.00
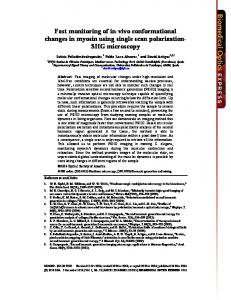
been developed in our laboratory as a complementary technique to FPM.6 HPM extends the concept of complex analytic signals to the spatial domain and measures quantitative phase images from only one spatial interferogram recording. Due to its single-shot nature, the HPM acquisition time is limited only by the recording device and thus can be used to accurately quantify nanometer level path-length shifts at the millisecond time scale or less, where many relevant biological phenomena develop.7 In this Letter we introduce diffraction phase microscopy (DPM) as a novel quantitative phase imaging technique. DPM combines the single-shot feature of HPM with the common path geometry associated with FPM. As a result, it provides quantitative phase images that are inherently stable to the level of the subnanometer optical path length and at an acquisition speed limited only by the detector. The experimental setup is shown in Fig. 1. The second harmonic 共 = 532 nm兲 radiation of a Nd:YAG laser was used as illumination for an inverted microscope (Axiovert 35, Carl Zeiss, Inc.), which produces a magnified image of the sample at the output port. The microscope image appears to be illuminated by a virtual source point (VPS). A relay lens (RL) was used to collimate the light originating at the VPS and replicate the microscope image at the plane (IP). A phase grating G is placed at this image plane (IP), which generates multiple diffraction orders containing full spatial information about the image. We isolate the zeroth and first diffraction orders to be used a sample and reference fields, respectively, similar to typical Mach– Zender interferometry. To accomplish this, a standard spatial filtering lens system L1 – L2 is used to select the two diffraction orders and generate the final interferogram at the CCD plane. The zerothorder beam is low-pass filtered by using the spatial filter (SF) positioned in the Fourier plane of L1, such © 2006 Optical Society of America
776
OPTICS LETTERS / Vol. 31, No. 6 / March 15, 2006
Fig. 1. Experimental setup. VPS, virtual source point; G, grating; IP, image plane; L1,2 lenses (f1,2, respective focal distances); SF, spatial filter (expanded in the inset).
that at the CCD plane it approaches a uniform field. The spatial filter allows passing the entire frequency content of the first diffraction order beam and blocks all the other orders. The first order is thus the imaging field and the zeroth order plays the role of the reference field. The two beams traverse the same optical components, i.e., they propagate along a common optical path, thus significantly reducing the longitudinal phase noise. The direction of the spatial modulation was chosen at an angle of 45° with respect to the x and y axes of the CCD, such that the total field at the CCD plane has the form E共x,y兲 = 兩E0兩ei关0+共x+y兲兴 + 兩E1共x,y兲兩ei共x,y兲 .
共1兲
In Eq. (1), 兩E0,1兩 and 0,1 are the amplitudes and the phase of the orders of diffraction 0, 1, respectively, while  represents the spatial frequency shift induced by the grating to the zeroth order. Note that, as a consequence of the central ordinate theorem, the reference field is proportional to the spatial average of the microscope image field, 兩E0兩ei0 ⬀
1 A
冕
兩E1共x,y兲兩ei共x,y兲dxdy,
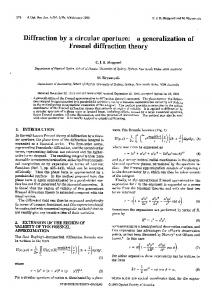
the cross term, 兩E0兩兩E1共x , y兲兩cos关共x , y兲 − 共x + y兲 − 0兴. For the transparent objects of interest here, E1共x , y兲 is expected to have a weak spatial dependence. The spatially resolved quantitative phase image associated with the sample is retrieved from a single CCD recording via a spatial Hilbert transform, as described in Ref. 6. Droplets of whole blood were simply sandwiched between coverslips with no additional preparation. Figure 2a shows a quantitative phase image of live blood cells, where the normal, discocyte shape can be observed. To quantify the stability of the DPM instrument and thus the sensitivity of cell topography to dynamic changes, we recorded sets of 1000 no-sample images, acquired at 10.3 ms each, and performed noise analysis on both single points and the entire field of view. The spatial standard deviation of the path length associated with the full field of view had a temporal average of 0.7 nm and a temporal standard deviation of 0.04 nm, as shown in Fig. 2b. Also shown in Fig. 2 is the temporal path-length trace of an arbitrary point P (3 ⫻ 3 pixel average), characterized by a standard deviation of 0.53 nm. To illustrate the ability of DPM to provide detailed information about single cell structure and dynamics, we analyzed the RBC indicated by a square in Fig. 2a. Figure 3b shows the thickness profile h共x兲 across the direction indicated by the arrow in Fig. 3a. The phase information was transformed into thickness by using a refractive index contrast of 6% between the
共2兲
where A is the total image area. The spatial average of an image field has been successfully used before as a stable reference for extracting spatially resolved phase information.5 The CCD (C7770, Hamamatsu Photonics) has an acquisition rate of 291 frames/ s at the full resolution of 640⫻ 480 pixels. To preserve the transverse resolution of the microscope, the spatial frequency  can be chosen to match or exceed the maximum frequency allowed by the numerical aperture of the instrument. Throughout our experiments, the microscope was equipped with a 40⫻ (0.65 NA) objective that is characterized by a diffraction-limited resolution of 0.4 m. The microscope–relay lens combination produces a magnification of approximately 100, thus the diffraction spot at the grating plane has a size of approximately 40 m. The grating pitch is 20 m, which allows us to take advantage of the full resolution given by the microscope objective. The L1 – L2 lens system has an additional magnification of f2 / f1 = 3, such that the sinusoidal modulation of the image is sampled by 6 CCD pixels per period. The interferogram is spatially high-pass filtered to isolate
Fig. 2. a, Quantitative phase image of whole blood smear. The gradient bar represents the optical path length in nanometers. b, Temporal fluctuations of the spatial standard deviation associated with the no-sample field of view and of a single point 共P兲 in the field of view, as indicated. The temporal standard deviations, , for these two signals are also shown.
March 15, 2006 / Vol. 31, No. 6 / OPTICS LETTERS
777
In summary, we have developed diffraction phase microscopy that is capable of measuring quantitative phase images of cells at the subnanometer path length and millisecond time scales. The inverted geometry makes the new instrument particularly appealing for quantitative cell biology. The instrument presented here requires significantly less computational work than digital holography12 and provides faster images than reported with other quantitative phase imaging techniques.13–15 This work was carried out at the MIT Laser Biomedical Research Center, supported by NIH P41 RR 02594, and partially supported by Hamamatsu Photonics K.K. G. Popescu’s e-mail address is
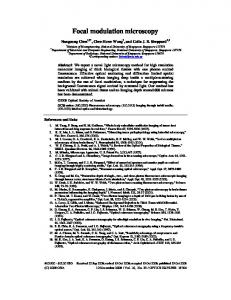
[email protected]. References Fig. 3. Quantitative assessment of the single cell shape and dynamics. a, DPM image of a single RBC (the color bar represents the path length in nanometers). b, Thickness profile of the cell in a. c, Local thickness fluctuations at the three points on the cell indicated in a. The respective average thickness 具u典 and standard deviations are indicated.
hemoglobin contained in the cell and the surrounding plasma.8 This type of topographic image with submicrometer accuracy is similar to atomic force microscopy (AFM) measurements, but unlike AFM, DPM is a full-field imaging technique that does not require sample preparation.3 RBCs are dynamic systems that exhibit membrane fluctuations on the scale of tens to hundreds of nanometers.9 This phenomenon, also referred to as RBC flickering, was observed many years ago, and significant effort has been concentrated on developing models to describe such motion.10,11 However, the nature of these fluctuations and whether they are meant to accomplish a certain physiological task are not yet fully understood. A noncontact, preparation-free technique to quantify these membrane displacements will be instrumental in testing various hypotheses and extracting useful physical parameters. The capability of DPM to quantify RBC membrane fluctuations was established by monitoring the fluctuations of various points on the cell. Figure 3c displays the time traces corresponding to the points indicated in Fig. 3a. The respective standard deviations of these signals indicate that the cell membrane fluctuates with lower amplitudes in the center of the cell than at its rim.
1. D. J. Stephens and V. J. Allan, Science 300, 82 (2003). 2. A. Zilker, H. Engelhardt, and E. Sackmann, J. Phys. (Paris) 48, 2139 (1987). 3. R. Nowakowski, P. Luckham, and P. Winlove, Biochim. Biophys. Acta 1514, 170 (2001). 4. P. Matarrese, E. Straface, D. Pietraforte, L. Gambardella, R. Vona, A. Maccaglia, M. Minetti, and W. Malorni, FASEB J. 19, 416 (2005). 5. G. Popescu, L. P. Deflores, J. C. Vaughan, K. Badizadegan, H. Iwai, R. R. Dasari, and M. S. Feld, Opt. Lett. 29, 2503 (2004). 6. T. Ikeda, G. Popescu, R. R. Dasari, and M. S. Feld, Opt. Lett. 30, 1165 (2005). 7. G. Popescu, T. Ikeda, C. A. Best, K. Badizadegan, R. R. Dasari, and M. S. Feld, J. Biomed. Opt. Lett. 10, 060503 (2005). 8. M. Hammer, D. Schweitzer, B. Michel, E. Thamm, and A. Kolb, Appl. Opt. 37, 7410 (1998). 9. F. Brochard and J. F. Lennon, J. Phys. (Paris) 36, 1035 (1975). 10. R. Lipowski and M. Girardet, Phys. Rev. Lett. 65, 2893 (1990). 11. N. Gov, A. G. Zilman, and S. Safran, Phys. Rev. Lett. 90, 228101 (2003). 12. P. Marquet, B. Rappaz, P. J. Magistretti, E. Cuche, Y. Emery, T. Colomb, and C. Depeursinge, Opt. Lett. 30, 468 (2005). 13. G. A. Dunn and D. Zicha, eds., Using DRIMAPS System of Transmission Interference Microscopy to Study Cell Behavior (Academic, 1997). 14. M. A. Choma, A. K. Ellerbee, C. H. Yang, T. L. Creazzo, and J. A. Izatt, Opt. Lett. 30, 1162 (2005). 15. C. Joo, T. Akkin, B. Cense, B. H. Park, and J. E. de Boer, Opt. Lett. 30, 2131 (2005).