Apr 22, 2010 - Duccio Fanelli1 and Alan J. McKane1,2. 1Dipartimento di Energetica, University of ..... [5] G. M. Zaslavsky, Phys. Reps. 371, 461 (2002).
Diffusion in a crowded environment Duccio Fanelli1 and Alan J. McKane1,2
arXiv:1003.3760v2 [cond-mat.stat-mech] 22 Apr 2010
1
Dipartimento di Energetica, University of Florence and INFN, Via S. Marta 3, 50139 Florence, Italy and 2 Theory Group, School of Physics and Astronomy, University of Manchester, Manchester M13 9PL, U.K. We analyze a pair of diffusion equations which are derived in the infinite system–size limit from a microscopic, individual–based, stochastic model. Deviations from the conventional Fickian picture are found which ultimately relate to the depletion of resources on which the particles rely. The macroscopic equations are studied both analytically and numerically, and are shown to yield anomalous diffusion which does not follow a power law with time, as is frequently assumed when fitting data for such phenomena. These anomalies are here understood within a consistent dynamical picture which applies to a wide range of physical and biological systems, underlining the need for clearly defined mechanisms which are systematically analyzed to give definite predictions. PACS numbers: 05.60.Cd, 05.40.-a, 87.15.Vv
Almost all discussions relating to the modeling of diffusion assume Fick’s law — that the rate at which one substance diffuses through another is directly proportional to the concentration gradient of the diffusing substance [1]. There is a good reason for this: it is empirically very well supported, at least at not too high concentrations, and is part of the wider theoretical framework of linear nonequilibrium thermodynamics [2]. However one might expect nonlinear corrections in various situations e.g. if obstacles are present or if there is more than one species at high concentrations, and indeed many reports of anomalous behavior can be found in the literature [3–11]. These studies are mainly experimental, or involve numerical simulations, and the theory which is given mainly consists of phenomenological fits to the data. Many of the fits suggest that the mean-square displacement of the diffusing species grows with time, t, like tα , where α < 1. The phenomena described go under various names such as “molecular crowding” [12–14] and “single-file diffusion” [15–18] , all indicating that the increased concentration impedes the flow of particles in some way, leading to a violation of Fick’s law. There are relatively few first-principles studies of these effects. Those that do exist include hydrodynamical models with nonlinear constitutive relations [19] and simple symmetric exclusion processes in one dimension [18]. In this Letter we propose a modification of Fick’s law which is based on a physically motivated microscopic theory. Unlike previous theories of single-file diffusion [20, 21] it holds in arbitrary dimensions, since it is not a consequence of the physical ‘jamming’ of the particles, rather it is due to the depletion of resources on which the particles rely. This resource may be space to move, but could also be a chemical substrate required for the system to remain viable. The phenomenon we describe is seen in experiments which trace the motion of tagged particles. This is equivalent to assuming the existence of two types of particle with the same diffusion constant. We begin with a generic microscopic system in a given volume of d−dimensional space which is divided into a
large number, Ω, of small (hypercubic) patches. Each patch, labeled by α, can contain up to N particles: nα of type A, mα of type B, and vα = N − nα − mα vacancies, denoted by E. We will assume that the particles have no direct interaction, however there will be an indirect interaction in that the mobility of particles will be affected if neighboring patches have few vacancies. To model this more concretely we assume that the particles move only to nearest-neighbor patches, and then only if there is a vacancy there: µ1
Aα + Eβ −→ Eα + Aβ , µ2
Bα + Eβ −→ Eα + Bβ .
(1)
Here α and β label nearest-neighbor patches with Aα , Bα , and Eα being the respective types of particles in patch α, and µ1 and µ2 being the reaction rates. The state of the system will be characterized by the number of A and B particles in each patch, that is, by the vector n = (n1 , . . . , nΩ ), where nα = (nα , mα ). The rate of transition from state n′ , to another state n, is denoted by T (n|n′ ) — with the initial state being on the right. The transition rates associated with the migration between nearest-neighbor patches take the form µ1 n α N − n β − m β , zΩ N N µ2 m α N − n β − m β , T (mα − 1, mβ + 1|mα , mβ ) = zΩ N N (2) T (nα − 1, nβ + 1|nα , nβ ) =
where z is the number of nearest neighbors that each patch has and where within the brackets we have chosen to indicate only the dependence on those particles which are involved in the reaction. It is the presence of the factor vβ = N − nβ − mβ , which reduces the transition rate if there are few vacancies in the target patch, and which modifies Fick’s law in the macroscopic theory. This is a Markov process, and the probability of finding the system in state n at time t, denoted by P (n, t), is
2 given by the master equation X dP (n, t) = [T (n|n′ )P (n′ , t) − T (n′ |n)P (n, t)] , dt ′ n 6=n
(3) where the allowed transitions are those given by Eq. (1). This defines the microscopic process, but we are interested in the macroscopic equations that this process generates. To find these we need to find the dynamical equations for the ensemble averages hnα i and hmα i. Multiplying Eq. (3) by nα and summing over all n gives, after shifting some of the sums by ±1, X dhnα i = [hT (nα + 1, nβ − 1|nα , nβ )i dt β∈α
− hT (nα − 1, nβ + 1|nα , nβ )i] , (4) P where the notation β∈α means ‘sum over all patches β which are nearest-neighbors of the patch α’. A similar equation holds for dhmα i/dt. The averages in Eq. (4) are carried out by using the explicit forms (2) and replacing the averages of products by the products of averages, which is valid in the limit N → ∞. Then scaling time by a factor of N Ω one finds [22] dφα = µ1 [∆φα + φα ∆ψα − ψα ∆φα ] , dt dψα = µ2 [∆ψα + ψα ∆φα − φα ∆ψα ] . dt (5) Here φα = lim
N →∞
hmα i hnα i ; ψα = lim , N →∞ N N
(6)
(10)
where ρ(k − p, 0) is the initial value of ρ in Fourier space. This equation is linear in σ which allows us to make further analytic progress. We have considered two types of particle for simplicity; the above discussion can easily be extended to three or more types. We will first analyze Eq. (10) in one dimension. The calculation in d−dimensions is not much more difficult, and we will give the main result later, but is less clear due to the number of indices involved in the intermediate steps. We begin by noting that ρ(k, t) is even in k and σ(k, t) is odd in k, so that σ(0, t) = 0. So the first non-trivial term in the expansion of σ(k, t) is hx(t)iσ ≡ −i∂σ(k, t)∂k|k=0 . From Eq. (10) one finds that √ Z dp 2 dhx(t)iσ i =2 2 pρ(p, 0)e−p t σ(p, t). (11) dt 2π In order to evaluate the integral we need to know something of the behavior of σ(p, t). Numerical simulations (see later) indicate that the ratio of hx2n+1 (t)iσ to hx2n−1 (t)iσ , n = 1, 2, . . ., is proportional to t, for large t, to a very good approximation. Therefore ∞ X (ip)2n+1 hx2n+1 (t)iσ ∼ ihx(t)iσ pf (p2 t), (2n + 1)! n=0 (12) for large t where
f (y) =
∞ X (−1)n an y n , (2n + 1)! n=0
(13)
and where the an are constants. Substituting Eq. (12) into Eq. (11) and scaling p2 by t gives dhx(t)iσ A1 = 3/2 hx(t)iσ , dt 2t
(7)
where ∇2 is the usual Laplacian. We can give a quite complete analysis of Eqs. (7) in the case when the diffusion constants are equal. Let D1 = D2 ≡ D and absorb D into the definition of the time. Then adding the two equations gives 1 ∂ρ = ∇2 ρ, ρ ≡ √ (φ + ψ) , ∂t 2
2
×ρ(k − p, 0)e−(k−p) t σ(p, t),
σ(p, t) =
and ∆ is thePdiscrete Laplacian operator defined by ∆fα = (2/z) β∈α (fβ − fα ). Finally taking the size of the patches to zero, and scaling the rates µ1 and µ2 appropriately [22] to give diffusion constants D1 and D2 , gives partial differential equations for φ(x, t) and ψ(x, t): � � ∂φ = D1 ∇2 φ + φ∇2 ψ − ψ∇2 φ , ∂t � � ∂ψ = D2 ∇2 ψ + ψ∇2 φ − φ∇2 ψ , ∂t
We will take initial conditions such that ρ(−x, 0) = ρ(x, 0) and σ(−x, 0) = −σ(x, 0). Solving Eq. (8) for ρ and going over to Fourier space gives for Eq. (9): √ Z dp � 2 � ∂σ(k, t) 2 = −k σ(k, t) + 2 p − (k − p)2 ∂t (2π)d
(8)
√ whereas the equation for the difference σ ≡ (φ − ψ)/ 2 is √ � ∂σ = ∇2 σ + 2 σ∇2 ρ − ρ∇2 σ . (9) ∂t
(14)
where A1 =
4V1 π
Z
2
dp f (p2 )p2 e−p .
(15)
This scaling implies that √ ρ(p, 0) is replaced by ρ(p = R 0, 0) = dxρ(x, 0) ≡ 2V1 , for large t. Solving the differential equation (14) gives � � A1 (16) hx(t)iσ = c exp − √ , t where c is a constant.
3
Using Eq. (16) the integration in Eq. (17) can be carried out for large t. This gives hx2n+1 (t)iσ ∼ 2(2n + 1)an−1 tn hx(t)iσ and so an = 2(2n + 1)an−1 . Therefore√from Eq. (13) f (y) = e−y and from Eq. (15) A1 = V1 / 2π. Finally, from Eqs. (12) and (16) we find that � � � V1 exp −k 2 t , (18) σ(k, t) ∼ ikc exp − √ 2πt for large t. Taking the inverse Fourier transform gives � � � cx V1 2 √ σ(x, t) ∼ exp −x /4t . (19) exp − 4π 1/2 t3/2 2πt
The corresponding calculation in d−dimensions can in principle be carried out in a similar way. This will be discussed in more detail elsewhere and here we only give the generalization of Eq. (16): � � Ad (20) hxi (t)iσ = ci exp − d/2 , t where the ci , i = 1, . . . , d, are constants and Ad is given by Z dp 2 −2p2 Vd 8Vd p e = (3d−2)/2 d/2 . Ad = 2 (21) d d (2π) 2 π d Returning to the one-dimensional case, we may use the results we have obtained to characterize the time evolution of the variance of the original distributions φ and ψ. Since ρ has only even moments and σ only odd moments, hxn iφ = (−1)n hxn iψ , for any integer n. It follows that hhx2 iiφ = hhx2 iiψ , where the symbol hh·iif stands for the variance of function f . Using the result (16) for the first moment and the standard diffusion result for the second moment, we have for the normalized mean–square displacement: " � �1/2 # 2 c hx2 (0)iρ 2 hhx2 (t)iiφ,ψ = 2t − + √ exp −V1 . 2V1 πt 2V1 (22) For large enough times, the system displays normal diffusion: the variances scale linearly with time, and are shifted by a constant factor. For relatively short times, of the order of the inverse of the diffusion coefficient, here absorbed in the definition of t, deviations from the usual behavior are predicted to occur due to the exponential factor in Eq. (22), which reduces the diffusion.
3 2
σ
2
dhx2n+1 (t)iσ ∼ 2n(2n + 1)hx2n−1 (t)iσ dt ∼ 2n(2n + 1)an−1 tn−1 hx(t)iσ . (17)
4
ψ,φ
The coefficients an in Eq. (13) may be found by differentiating Eq. (10) (2n + 1) times with respect to k and then setting k = 0. In the resulting differential equation for hx2n+1 (t)iσ use of Eq. (12) shows that the p−integral is down by powers of t on the contribution coming from the term −k 2 σ(k, t) for n > 0. So for large t,
2
1
1 0
0
2.5
5
Dt
0 0
1
2
3
Dt
4
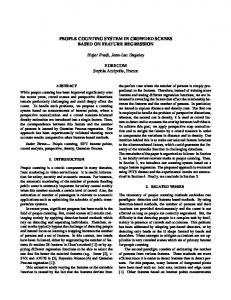
FIG. 1: (Color online) Main panel: the variances hhxiiφ and hhxiiψ are plotted as a function of the rescaled time, Dt. Symbols refer to the numerical simulations, diamonds and pluses stand respectively for φ and ψ. The dashed line represents the normal diffusion prediction, while the thick solid line refers to formula (22) where c = 2.035. Here D = 0.003 and V1 = 1. Inset: The first moment hxiσ is represented as a function of rescaled time, Dt. Symbols refer respectively to D = 0.003 (circles) and D = 0.008 (triangles). The solid line is the asymptotic prediction (16) with c = 2.035.
The validity of the approximations we have made in the above analysis have been checked by carrying out numerical simulations for the one-dimensional case. We used Euler discretization, both in the space and time coordinates of Eq. (7) and assumed identical diffusion constants for both species, so as to make contact with the analysis. In the main panel of Fig. 1 the time evolution of the measured variances, for both φ and ψ, are displayed. The variances are seen to grow more slowly than
φ
0.6
0.6
0.4
0.4
0.2
0.2
0 -6
-3
0
x
3
6
-6
-3
0
x
3
ψ
0 6
FIG. 2: (Color online) Left panel: three profiles of the distribution φ are plotted (thin line), corresponding to successive instants of the dynamics. From top to bottom, the snapshots are taken at rescaled time Dt = 0.3, 0.9, 1.5. The theoretical profile at Dt = 1.5 is represented with a thick line (red online). Right panel: Same as in left panel, but for the distribution ψ. The analytical prediction is plotted with a thick line (blue online). The simulations refer to D = 0.003 and V1 = 1.
4
2
ψ,φ
4
2
0 0
1
Dat
2
3
FIG. 3: (Color online) The variances hhxiiφ (diamonds) and hhxiiψ (pluses) are plotted as a function of their respective rescaled time, Da t, with a = 1, 2. In both cases the variances grow slower than predicted by the standard diffusion theory (dashed line). Here, D1 = 0.003, D2 = 0.008 and V1 = 1.
predicted from standard diffusion theory. The agreement between the theoretical prediction (22) and the simulations is excellent, even at quite short times. The constant c is determined by fitting the late time evolution of hxiσ from simulations to the asymptotic profile (16), see inset of Fig. 1. The form of the time evolution of the first moment hxiσ given by Eq. (16) has also been checked numerically for a range of parameters, and is always in excellent agreement. As a further check, Fig. 2 shows φ and ψ found from numerical simulations for a range of times. The recorded snapshots at the largest time show good agreement with the theoretical curves at that time. These considerations all point to the validity of the analysis for the case when the diffusivities of the two species are equal. To shed light on the more general setting where D1 6= D2 , and so broaden the range of applicability of our conclusions, we rely on numerical simulation. In Fig. 3, we show the time evolution of the variance of
[1] J. Crank, The Mathematics of Diffusion (OUP, Oxford, 1975). Second edition. [2] S. R. de Groot and P. Mazur, Non-equilibrium Thermodynamics (Dover, New York, 1984). [3] J. P. Bouchaud and A. Georges, Phys. Reps. 195, 127 (1990). [4] R. Metzler and J. Klafter, Phys. Reps. 339, 1 (2000). [5] G. M. Zaslavsky, Phys. Reps. 371, 461 (2002). [6] T. J. Feder et al., Biophys. J. 70, 2767 (1996). [7] E. D. Sheets et. al., Biochemistry 36, 12449 (1997). [8] E. B. Brown et al., Biophys. J. 77, 2837 (1999). [9] M. J. Saxton, Biophys. J. 81, 2226 (2001). [10] M. Weiss, H. Hashimoto, T. Nilsson, Biophys. J. 84, 4043 (2003). [11] G. Guigas and M. Weiss, Biophys. J. 94, 90 (2008). [12] M. Weiss et al., Biophys. J. 87, 3518 (2004). [13] D. S. Banks and C. Fradin, Biophys. J. 89, 2960 (2005).
φ (resp. ψ) vs. the rescaled time D1 t (resp. D2 t). As in the symmetric case, the growth of the variances is slower than for standard diffusion. This again reflects the presence of the finite carrying capacity imposed at the level of the microscopic dynamics. Remarkably, the function hxiσ is again found to empirically obey Eq. (16), the undetermined factor A1 depending on the individual diffusivities. The modified diffusive behavior we have found is derived from a general principle formulated at the microscopic level, not from a phenomenological fit. It is important to stress this fact, since virtually all the work on molecular crowding, and related phenomena, to date has postulated that the mean-square displacement increased in time like a power: hhx2 ii ∼ tα . There has been much discussion of whether α < 1 (called ‘subdiffusion’) or α > 1 (called ‘superdiffusion’). Our results can be fitted by either, depending on when the time-window for the fit is taken; if taken at early times subdiffusion is found, at late times superdiffusion is found. Indeed by picking suitable time-windows a wide range of values of α can be found. This ambiguity shows the necessity of starting with a clearly defined mechanism, which can be precisely implemented (not phenomenologically invoked) and from which clear predictions can be systematically derived. The approach we have described, and the results we have obtained, in this Letter follow this philosophy closely and we expect that comparison of our results with experiments in the future will help to clarify the effect of molecular crowding and of resource depletion on diffusion.
Acknowledgments
We thank Tommaso Biancalani, Andrea Gambassi and Gunter Sch¨ utz for useful discussions.
[14] J. A. Dix and A. S. Verkman, Annu. Rev. Biophys. 37, 247 (2008). [15] T. T. Perkins, D. E. Smith, S. Chu, Science 264, 819 (1994). [16] F. J. Keil, R. Krishna and M-O. Coppens, Rev. Chem. Eng. 16, 71 (2000). [17] Q-H. Wei, C. Bechinger, P. Leiderer, Science 287, 625 (2000). [18] A. Brzank and G. M. Sch¨ utz, J. Stat. Mech. P08028 (2007). [19] J. E. Adkins, Philos. Trans. Roy. Soc. (Lond) 255, 607; 635 (1963). [20] T. E. Harris, J. Appl. Prob. 2, 323 (1965). [21] J. K. Percus, Phys. Rev. A 9, 557 (1974). [22] A. J. McKane and T. J. Newman, Phys. Rev E 70, 041902 (2004).