INTERNATIONAL JOURNAL OF GEOLOGY
Issue 3, Volume 2, 2008
Digital geologic mapping methods: from field to 3D model M. De Donatis, S. Susini and G. Delmonaco software 2DMove and 3DMove by Midland Valley Exploration Ltd. This paper reports a case study of digital mapping carried out in the Southern Apennines. This work is part of an ENEA project, funded by the Italian Ministry of University and Research, devoted to heritage sites prone to landslide risk where local-scale geologic and geomorphic mapping is fundamental in the preliminary stage of the project.
Abstract—Classical geologic mapping is one of the main techniques used in geology where pencils, paper base map and field book are the traditional tools of field geologists. In this paper, we describe a new method of digital mapping from field work to buiding three dimensional geologic maps, including GIS maps and geologic crosssections. The project consisted of detailed geologic mapping of the are of Craco village (Matera - Italy). The work started in the lab by implementing themes for defining a cartographic base (aerial photos, topographic and geologic maps) and for field work (developing symbols for outcrops, dip data, boundaries, faults, and landslide types). Special prompts were created ad hoc for data collection. All data were located or mapped through GPS. It was possible to easily store any types of documents (digital pictures, notes, and sketches), linked to an object or a geo-referenced point. Immediate thematic categorization of mapped objects, correct dimensions and positions allow to collect, interpret, and interpolate all data directly in the field. After field, the lab work was carried out keeping data separate from interpretation thanks to database opportunities. Finally, the geological map was interpreted in order to draw geologic sections and to build three-dimensional geologic model of the area.
II. Study area The study area (Fig. 1) is located in the Southern Apennines, around Craco, a small village in the Matera Province along a ridge between the Bruscata and Salandrella stream.
Keywords— Field mapping, Mobile GIS, GPS, Tablet PC, Southern Apennines, 3D geologic modeling. I.
INTRODUCTION
n the last decade, new digital methods for field mapping have Ibeen implemented along with traditional ones [1], [2]. These new methods allow better accuracy in positioning at the same time different types of data, as well as the possibility to manage them [3].However, the nature of field geology and the restrictions of some digital tools do not allow pen and paper to be abandoned definitively. Data collection and interpretation are usually done simultaneously during field work. The character of interpretations is typically subjective and field analysis usually results in preliminary mapping supplemented by notes, sketches, plots, and photos. Nevertheless, practical work is often hindered by the lack of flexibility of most of digital mapping systems [3]. At the same time, traditional mapping loses part of the collected data, as well as the methodological approach that brings the final outcome. LINEE, the Lab of Info-tech for Earth and Environmental Sciences (Urbino University-Italy), has been working with a hardware-software system that enables geologists to carry out field mapping with digital tools [4], [5]. These have improved the efficiency and precision of data collection. The system hardware is a rugged tablet pc. The computing power, dimensions, and good quality screen readability allow the geologist to visualize geologic databases and maps directly in the field. LINEE has implemented and developed a new mobile GIS software that merges both professional GIS tools and other new tools for field surveys and mapping experts. After digital surveys, data and field interpretations can be used for 2D maps and cross sections and 3D models [6] using the dedicated
Fig.1 (a) and (b) Geographic location of the study area; (c) picture of the Craco village. In the last decades, the re-activation of a large landslide that has progressively involved the village area, have forced inhabitants to leave their homes and to move down into the valleys, making Craco one of the most impressive ghost villages of the Basilicata region [7], [8]. The landscape has the typical features of badlands, made up mainly of clay and sand deposits that have experienced intense erosion. Landslides are promoted by the adverse geological, structural and geomorphological characteristic of the area. The historical village of Craco, located on the top of a conglomerate hill overlying gentle sloping clayey rocks, is deeply affected by the large and diffuse slope instability phenomena. Various landslide typologies can be recognized, such as rock-falls in the upper part of the hill, and rotational and translational earth slides, earth flows, and rock lateral spreading [8]. Geologically, the allochtonous units: CretaceousOligocene and Miocene formations (Sicilide Clays) are unconformably covered, with a transgressive contact, by lower
Pliocene conglomerates (cycle 1) and arenites and by lower to late Pliocene clay and sand marine deposits (cycles 2). All
47
INTERNATIONAL JOURNAL OF GEOLOGY
Issue 3, Volume 2, 2008
previous geological map.
these outcropping units were involved in folding and faulting related to NE-verging thrust systems [9]-[11].
V. FIELD WORK: DIGITAL MAPPING III. DIGITAL TOOLS
Traditional geologic mapping involves paper maps, a notebook, and colored pencils. The tools required for digital mapping are a tablet PC and a GPS receiver.
In order to use methods as close as possible to classical field work, the following tools have been selected [3]: - Mobile-GIS software developed by our research group (LINEE); - Tablet PC: a rugged model for use in any field conditions; - GPS device (a very cheap bluetooth receiver); - Digital Camera (any photo camera USB connected). IV.
The tablet PC actually includes all these traditional tools and makes it possible for all the data to be managed at the same time through a dedicated software. Connected to a GPS receiver, it gives the geologist his exact position at any time and lets him capture geometric data within his project with remarkable accuracy. The tablet PC operating system includes several extremely useful pieces of software, such as Windows Journal. This software shows a blank sheet on the screen where it is possible to take notes or make drawings using the digital pen. It has the same approach as the traditional notebook and, in addition, offers a number of tools (i.e. the geologist can choose the color and the thickness of the pencil, select exact areas and highlight them, and import documents in this sheet to work on). The last functions are not found in a traditional notebook. As mentioned earlier, the first part of this project takes place in the laboratory (importing base cartography). Data to be acquired and symbols to be used have to be defined and forms for guided data input must be prepared. The GIS project created is deliberately simple. The aim is to modify and improve it while working in the field, trying to cater to every geologist’s needs. In this way, the project can be considered a work in progress, a work that changes according to demands and events. Geologic mapping is divided into three parts, according to different configurations of the system used. In the first phase (“Basic” configuration) the digital system, is used for traditional geologic mapping. The second (“Intermediate” configuration) provides additional tools, in order to improve digital mapping. In the last configuration, named “Advanced,” more complex functions are taken into consideration, referring both to digital mapping in the field and to project customization and data processing.
LAB WORK: PROJECT ORGANIZATION
The first part of this project, which takes place in the laboratory, includes searching for base cartography, maps and data entry within a new project. Imported cartographies are the following (Fig. 2): [1] No. 1 topographic map at a 1:10,000 scale in vector format (.dxf) supplied by IGM (Istituto Geografico Militare) (Fig. 2a); [2] No. 1 aerial photograph at a 1:33,000 scale in raster format (tiff) (Fig. 2b); [3] No. 1 geologic map at a 1:50,000 scale in raster format (jpg) (Fig. 2c), [10]; [4] No. 1 geologic map at a 1:10,000 scale in vector format (.shp) (Fig. 2d). Both the aerial photograph and the geologic maps in raster format are geo-referenced through dedicated tools of the software making reference to the IGM map. Imported maps are stored in this GIS project on different levels.
A. “Basic” configuration In this first step, the geologist has on the tablet PC’s screen all the previously imported maps. The screen dimensions are appropriate for visualizing a large part of the territory, and zoom and panning tools make it possible to set the map scale to fixed values (such as 1:50,000 or 1:10,000), as needed. It is even possible to reach a scale of 1:1; this makes it possible to draw and take notes on the map with the highest accuracy.
Fig.2 Imported cartography within mobile-GIS project (see text): (a) IGM topographic map; (b) aerial photograph; (c) raster published geological map (after [12]); (d) vector
48
INTERNATIONAL JOURNAL OF GEOLOGY
Issue 3, Volume 2, 2008
Fig.3 (a) Inserted IGM map, outcrop and stop number 1; (b) Windows Journal window showing drawings and notes linked to the related stop number. Fig.4 Screen-shot showing themes window, Geonote with related files of Windows Journal notes and interpreted picture.
The geologist can draw or write directly on the maps or on the blank sheet (in Windows Journal document) with the digital pen. All the data captured in these two documents are linked through the stop number (Fig. 3), as the geologist used to do with a topographic map and traditional notebook. In this way he does not have to change his modus operandi, because
A valid alternative to hand drawing or editing drawing tools is offered by GPS. It is possible to acquire points, arcs, and polygons according to positioning data received by the GPS antenna connected to the tablet PC: when close to the object, one can simply select the tool “capture point from GPS” (or arc or polygon), in order to obtain the representation of this object in the GIS project. Obviously this tool offers the highest accuracy possible. When inserting digital picture files, it is possible to write comments or make sketches on the image (Fig. 4), that means a significant advantage compared to traditional systems. Moreover, because in this way the software offers the possibility of storing a huge quantity of data connected to geographic objects, it is easier for another geologist to understand the whole interpretative path made, that is to say, what evidence and considerations have led to a specific geologic interpretation of the study area.
he can easily draw observations on the digital map and write his notes in the digital sheet. With the help of a GPS receiver the geologist can constantly check his position and visualize it at any time in the digital map. This “basic” configuration does not require a special computer or GIS software skills. A basic knowledge of the main tools (zoom, panning, show/hide theme, take notes, start GPS, etc.) is enough to work properly. The system tablet PC - mobile GIS offers many advantages. First, the possibility of visualizing several maps at once helps the geologist in his analysis and interpretations, giving him at any time all the information referring to a peculiar area or to a single point. Second, the user can visualize the maps at a very large scale, and he can put care into every detail without the limits of a fixed-scale paper map. Finally, the captured data are already in a digital format, removing the need to transfer them from paper to computer, avoiding loss of time and information or errors.
C. “Advanced” configuration After having achieved a deeper familiarity both with the tablet PC and the software, the last part of this project is dedicated to the “advanced” configuration test. The Form Editor is an important tool that allows the user to create custom forms for data collecting, usually used when organizing the GIS project. These forms can suit every kind of activity thanks to the width of functions offered by the software. As an example, the combo box containing a list of values can help data input and avoid mistakes during field activity.
B. “Intermediate” configuration The mobile GIS software offers several tools that can be extremely helpful to the geologist during field work. In order to have a better organized GIS project, it is possible to set up different thematic levels and to assign them a precise type of data. In this case the following themes are created: “attitude”, “outcrops”, “stratigraphic boundaries”, “faults” and “landslides”. In order to avoid confusing observed data with the geologist’s interpretations, two further themes are added: “interpreted stratigraphic boundaries” and “interpreted faults.” As with every GIS software, geologic objects are represented as points, arcs, and polygons. While in the “basic” configuration these objects are freely drawn by the user with the digital pen, in this configuration the geologist can use editing tools and differentiate these objects within the three geometric classes of a GIS (add point, add arc, and add polygon). In this way, field mapping and digitization are done at the same time without any further complicated process or specialized technicians.
49
INTERNATIONAL JOURNAL OF GEOLOGY
Issue 3, Volume 2, 2008
activity step. Furthermore, its large number of functions gives it flexibility and offers several tools that can help a geologist facing unpredictable situations; this software makes a GIS project a perfectly editable and customized project according to the geologist’s need.
Fig.5 Screen shot showing the lithozone form.
VI. LAB WORK: AFTER FIELD Even if map improvement could be done directly in the field using GIS and CAD tools to produce a map consistent with all the collected data, a revision of the interpretations is often suggested.
Fig.6 Screen-shot showing the bedding data form. In this case study, an ad hoc form for bedding attitude (type, dip, and dip direction) (Fig. 5), landslides and outcrops lithozone classifications (Fig. 6) was created. For the landslide data input form, the IFFI (Italian national project for landslide data base) form has been adopted [13]-[15] (Fig. 7). A typical GIS function is the possibility to associate a specific symbol to the inserted feature. This is extremely useful while mapping because it permits the geologist to create a geologic map characterized by pre-defined and appropriate symbols when inserting points, arcs, and polygons. At the end of a mapping day it is now possible to print a first map that gives a wider view of the study area and helps in improving further analysis.
Fig.8 Screen-shot showing final geological map of the Craco area. Black segments are two of the cross-sections traces used for 3D model building. Therefore, during post-fieldwork, the interpreted features can be more clearly separated from data, and first interpretations are stored in other layers and database of the GIS. The lab work can be performed with other digital tools to obtain a 3D model from a 2D geological map.
A. Drawing a map with GIS When the field work is done, the geologist has a complete GIS project, with base maps, real geologic objects observed in the field, and his/her interpretations separated into different thematic levels. In the laboratory, after having made a backup copy, all the collected data are usually checked (i.e. erroneously acquired information are deleted and incomplete databases are filled in). Once the geologist has an overview of the study area, he can proceed with map creation. Basic topological tools make all the data captured during field work consistent with topological GIS rules. Now the geologist only has to confirm the limits and build up and color litho-stratigraphic areas. Finally outcrops, attitude of bedding planes, and landslides are visualized (Fig. 8).
Fig.7 Screen-shot showing IFFI form for landslide data collection with Geonote and interpreted picture.
B. Drawing geologic cross-sections Digital tools can easily catch and export any data and
The in-house developed mobile-GIS software, includes advanced management and analytic tools useful at every
50
INTERNATIONAL JOURNAL OF GEOLOGY
Issue 3, Volume 2, 2008
information useful for drawing geologic cross-sections. After exporting the final map in .dxf format from mobile GIS
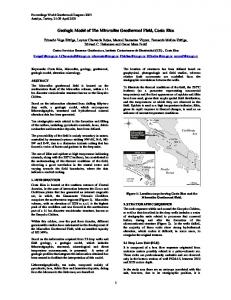
Fig.10 3D geologic model: in parallel views and UTM boxes with grid intervals of 500m; (a) 3D anatomical view with 2D cross-section; (b) 3D model with 2D cross-section trace s; (c) DEM, limits and cross-section trace
software and importing it into 2DMove (Midland Valley Exploration Ltd.), a number of traces almost perpendicular to the main structural axis trend were chosen and drawn [6]. The projection tools of 2Dmove allow to capture altitude values at intersected topographic contour lines in order to draw a topographic profile. Stratigraphic boundaries, fault segments, fold axis traces, and bedding measurements can also be projected and drawn with the slopes of their surfaces. From map view we can pass all these elements in section view and easily draw geologic cross-sections using classical geometric and geologic rules, aided by tools in 2Dmove.
From the elevation contour lines a digital elevation model (DEM) was built on which the vector geologic map was draped, obtaining a 2.5 dimension map. Interpolating corresponding features of the parallel crosssections and interpreting structural changes (fault tips, axial plunging of folds, etc.), structural and stratigraphic boundaries were transformed from lines to surfaces. These surfaces were corrected/edited using 2.5D geologic maps, extending and cutting those surfaces. The final result of this work is a three dimensional geologic model/map of the study area. VII. CONCLUDING REMARKS This project confirms the efficiency and validity of the digital system producing maps-models. From early lab work to field work and finally again conclusive lab work, digital systems can replace traditional ones with many advantages: 1. Easy management of any kind of base and thematic maps, orthophoto and satellite images as base and reference maps; 2. This system can be used even by the less “digital” geologist (with poor skill in digital mapping) because of its similarity to traditional methods (i.e. it is possible to draw directly on the digital map as it was possible to do on the paper map). Mobile-GIS basic functions, such as visualization of several maps, data input, GPS stored info, and Easy-Note are easy to learn and help the geologist in his field work. 3. In its “advanced” configuration, mobile-GIS project management from its organization to the final elaboration of the collected data. The Form Editor tool is of particular help in creating forms for data input. 4. When field work is completed, the geologist has a well-organized GIS project, where data and interpretation are separate and where it is possible to proceed with further elaboration, such as data transfer (to different computers or software) or map printing. 5. Data, elaborations and interpretations can be easily imported in other software to prepare geologic crosssections and three dimensional models. Finally, this experience shows how digital systems can easily and efficiently substitute the traditional mapping methods. This flexibility makes these methods suitable for every kind of mapping activity.
Fig.9 Geologic cross-sections created with 2DMove from field data. Topographic profile, stratigraphic boundaries, fault segments, and bedding are drawn with the same colors as in the 3D model. The results of this work are 2 main geologic geo-referenced cross-sections almost parallel to each other (Figs. 8, 9). C. Building the 3D geologic model/map In the virtual 3D space of 3DMove (Midland Valley Exploration Ltd.), we geo-referenced and imported (Fig. 10) [6]: elevation contour lines and points from a topographic map at a scale of 1:10,000; lines and polygons from a geologic map with bedding measurements; the geologic cross-sections.
51
INTERNATIONAL JOURNAL OF GEOLOGY
Issue 3, Volume 2, 2008
Geological Sciences in 1987. He also received a post-graduate qualification in Geological Cartography in Bologna (1988) and a M.Sc. degree in Basin Evolution and Dynamics from Royal Holloway (University of London, 1996). He has been consultant for regional and national geological cartography projects and oil companies. His current research is mainly focused on methodology for advanced geological mapping with GIS and 3D models. Former-President of the Council of Study of Environmental Sciences, he leads LINEE- Laboratory of Information-technology for Earth and Environmental Sciences. Coordinator of GIT – Geology and Information Technology Group, section of Italian Geological Society.
ACKNOWLEDGMENT HP Technology for Higher Education Award: project on “Learning territorial data capture and analysis for Applied Computer Sciences, Earth and Environmental Sciences Courses” (resp. Prof. Mauro De Donatis – Academic Year 2008-2009). Member of Field Mapping Initiative by MVE-Glasgow UK. REFERENCES [1]
[2]
[3]
[4]
[5] [6]
[7]
[8]
[9]
[10]
[11]
[12] [13] [14]
[15]
[email protected] [email protected]
R.R. Jones, K.J.W. McCaffrey, R.W. Wilson and R.E. Holdsworth, “Digital field data acquisition: towards increased quantification of uncertainty during geological mapping,” in Geological Prior Information, Geol. Soc. Spec. Publ., A. Curtis and R. Wood Eds., 2004, pp. 43-56. K.J.W. McCaffrey, R.R. Jones, R.E. Holdsworth, R.W. Wilson, P. Clegg, J. Imber, N. Holliman and I. Trinks “Unlocking the spatial dimension: digital technologies and the future of geosciences fieldwork,” J. Geol. Soc., London, vol. 162, 2005, pp. 1-12. P. Clegg, L. Bruciatelli, F. Domingos, R.R. Jones and M. De Donatis, “Digital geological mapping with tablet PC and PDA: a comparison,” Comp. & Geosc., vol. 32, 2006, pp. 1682–1698. M. De Donatis, L. Bruciatelli and S. Susini, “Map IT: A GIS/GPS Software Solution For Digital Mapping,” in Digital Mapping Techniques ‘05 - Workshop Proceedings, 97-101. U.S. Geological Survey Open File Report, D.R. Soller Ed., 2005, p. 1428. M. De Donatis and L. Bruciatelli, “Map IT: the GIS software for field mapping with tablet PC,” Comp. & Geosc., vol. 32, 2006, pp. 673-680. M. De Donatis, F. Borraccini and S. Susini, “Sheet 280 – Fossombrone 3D: A study project for a new geological map of Italy in three dimensions,” Comp. & Geosc., vol. 35, 2009, pp. 19-32. M. Bentivenga, M. Coltorti and G. Prosser , “Il movimento gravitativo profondo in Craco (Basilicata Ionica), It. J. Quatern. Sc., vol 17, 2004, pp. 613-625. G. Delmonaco, L. Falconi, G. Leoni, C. Margottini, C. Puglisi and D. Spizzichino, “Multi-temporal and quantitative geomorphological analysis on the large landslide of Craco village (M118)”, in Landslides: risk analysis and sustainable disaster management: proceedingsof the First general Assembly of the International Consortium on landslides, Kyoji Sassa, Springer Ed., 2005, pp. 113-118. M. Del Prete and D. J. Petley, “ Case history of the main landslide at Craco, Basilicata, South Italy”, Idro.Appl. E. Idrog., vol 17, 1982, pp. 291-304. S.Carbone, S. Catalano, S. Lazzari, F. Lentini and C. Monaco, "Presentazione della carta geologica del bacino del fiume Agri (Basilicata),” Mem. Soc. Geol. It., vol. 47, 1991, pp. 129-143. M. Bentivenga, L.M. Foresi, A. Prestera, G. Prosser and M. Sabia, “Structural setting at the front of a thrust and fold belt: the Craco area (Southern Apennines, Italy),” Boll. Soc. Geol. It., vol. 124, 2005, pp. 367-376. F. Lentini, “Carta Geologica del Bacino del Fiume Agri. Scala 1:50.000,” S.E.L.C.A., Firenze, 1991. APAT (2004) “Inventario dei fenomeni franosi: il Progetto IFFI”. Avaible: http://www.apat.gov.it/site/it-IT/Progetti/IFFI/. G. Gallerini, M. De Donatis, D. Baioni and L. Bruciatelli, “Landslide field mapping with tablet pc: a new integrated approach,” in Landslides and Avalanches: ICFL Norway, K. Senneset & J.O. Larsen Eds., 2005, pp. 107-113. G. Gallerini and M. De Donatis “Rilevamento digitale delle frane: applicazione della scheda IFFI,” Rend. Soc. Geol. It., vol. 4, 2007, pp. 31-35.
Mauro De Donatis is associate professor at Department of Earth, Life and Environmental Sciences of Urbino University where he received a Degree in
52