6 31002 (2010) EPJ Web of Conferences 6, DOI:10.1051/epjconf/20100631002 © Owned by the authors, published by EDP Sciences, 2010
Digital Image Correlation accuracy: influence of kind of speckle and recording setup Y. Barrangera, P. Doumalin, J.C. Dupré, and A. Germaneau Institut Pprime UPR 3346, CNRS – Université de Poitiers – ENSMA, 86962 Futuroscope Chasseneuil Cedex, France Abstract. Digital Image Correlation (DIC) is a popular optical technique which allows the measurement of displacement and strain fields on an object surface showing a random speckle pattern. To use its extension to 3D cases (called Digital Volume Correlation, DVC), it is often necessary to include particles in the material in order to have a sufficient contrast. However, as these particles are more rigid than the material, it is not sure that the correlation technique is able to follow exactly strains on the speckle pattern made of powder. As the digital recording process by CCD camera and correlation algorithms are the same between 2D and 3D cases, this study is then conducted in 2D cases in order to show the influence of the powder in the speckle pattern on the evaluation of displacement by DIC linked to the choice of the type of interpolation, of CCD cameras and lighting. In displacement tests, only the recording setup seems to have a strong influence on the accuracy of measurements. For strain experiments, powder has an effect on strain measurements over 10%.
1 Introduction In experimental solid mechanics, bulk measurement techniques are developed thanks to the improvements on investigation devices. The extension of Digital Image Correlation (DIC) to threedimensional cases, called Digital Volume Correlation (DVC), is one of these bulk measurement techniques. DVC is based on the same developments as DIC (for minimisation procedures, (interpolations, material transformation…), which means that DVC encounter the same kind of difficulties as DIC to quantify measurement errors. Previous studies allowed the evaluation of DVC from experimental displacements and strains [1-3]. Their results gave same tendencies as the one obtained in 2D with DIC, like the well-known sinusoidal evolution or the error amplitudes. To perform correlation techniques, it is necessary to create a contrast from a speckle pattern, which is most of the time synthetic [4,5], and sometimes manufactured [6-9]. For 3D studies, particles are included in the material to create a 3D distribution of grey levels according to the method used to generate volume image. Particles have generally a higher rigidity than the one of the material. In the mechanical point of view, other studies showed that with the small amount of particles included in the material, mechanical gradients involved by them remain localised to particle scale and does not have an influence on the global behaviour of the material [10]. Besides, we do not a
e-mail :
[email protected]
This is an Open Access article distributed under the terms of the Creative Commons Attribution-Noncommercial License 3.0, which permits unrestricted use, distribution, and reproduction in any noncommercial medium, provided the original work is properly cited.
Article disponible sur le site http://www.epj-conferences.org ou http://dx.doi.org/10.1051/epjconf/20100631002
EPJ Web of Conferences know whether correlation technique is able to follow exactly displacements and strains on a speckle pattern made of a deformable material and rigid particles. Also in 2D, there are several ways to make speckle patterns (paint, powder,…). So, the same question can be studied: in the case of powder speckle patterns, this is not sure that correlation gives exactly the same results as in cases of deformable speckle with painted patterns. In this work, we study the influence of each type of speckle on displacement and strain measurements linked to correlation algorithm parameters like interpolation types. To simplify the study, experiments are conducted in 2D and to know the contribution of the sensor non-synthetic speckle patterns are used.
2 Experimental procedure 2.1 Digital Image Correlation To perform DIC, two digital images need to be recorded. Each image represents a mechanical state: a reference and a deformed one. These images are composed of several pixels, each one containing a grey level value linked to the random pattern at the surface of the material, called speckle pattern. Subsets containing pixels are defined in the reference image, containing a large variation of grey levels. In each image, subsets are located by their coordinates. To calculate the local displacements at the surface of the material, DIC matches subsets between both images by recognition of the grey level distribution. A correlation coefficient is defined in the DIC process to quantify the degree of similarity of the grey level distribution between the subsets in the two images. This coefficient depends on a material transformation φ which links the coordinates of the reference state and the one of the deformed state (respectively X and x) by the formulation x= φ (X). For a subset D centred on the point X0 in the reference state, the material transformation is approximated by its Taylor expansion at the first order corresponding to a rigid body motion combined with a homogenous gradient:
φ ( X ) = X + u( X ) ≈ X + u( X 0 ) +
∂u ( X 0 ).( X − X 0 ) ∂X
(1)
The displacement u(X0) of the subset centre gives the components of the rigid body translation. The local displacement gradient contains the rigid body rotation and the local deformation of the subset. To have the best approximation, the chosen parameters are those which minimize the correlation coefficient. The chosen formula for the correlation factor is a normalised one which is insensitive to small contrast and brightness fluctuations:
C = 1−
∑
X ∈D
( f ( X ) − f D ).( g (φ ( x)) − g D )
∑ X ∈D ( f ( X ) − f D )² .
(2)
∑ X ∈D ( g (φ ( x)) − g D )²
where f and g correspond to the grey levels for the reference and the deformed states, fD and gD are the averages of grey levels on D and φ (D). A good match between the subsets in both images is then obtained for a correlation coefficient close to 0. In this study, the minimisation elected is the first-gradient one for strain measurements, and the least square minimisation for the displacement tests. To be able to reach a subpixel accuracy, it is necessary to estimate grey level values between each pixels, which is performed in DIC technique by mean of an interpolation function. In this work,
31002-p.2
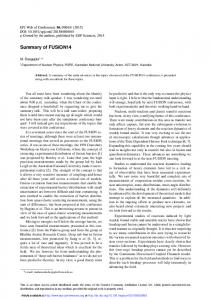
14th International Conference on Experimental Mechanics two interpolations are compared to assess on their influence on the accuracy of the DIC: bilinear and bicubic interpolations. 2.2 Displacement and strain experiments To perform this study, speckle patterns were created on the surface of a transparent silicone specimen. It was manufactured in-situ and has a section of 6x10 mm². To conduct experiments, straight lights on the specimen surface were avoided. Indeed, shadow phenomenon appears on speckle patterns made of powder with straight lights oriented directly it, which would have generated variations on grey levels at the surface of the specimen between reference and deformed images. Then, only diffused lights were used for these experiments. Three different kinds of speckle patterns were manufactured on the specimen: black paint, white paint, and spread of 150µm calibrated polyamide particles (Figure 1).
(a)
(b)
(c)
Fig. 1. Black paint (a), white paint (b), and spread powder (c) speckle patterns
With these speckle patterns, both displacement and strain experiments were conducted. For the displacement tests, the grey level distribution linked to the type of CCD camera, as well as the interpolation type, were tackled to see their influence on the accuracy of displacement measurement. Displacements were imposed by a micro-translation stage guided by computer so as to perform 10µm increments. For these experiments, three different CCD cameras were used: 8-bits, 10-bits and 12-bits cameras. In order to be compared, all the cameras were placed so as to have a 0.10 mm/pixels in-plane scale factor. 20 images were recorded for each camera to have a total displacement of 2 pixels for each experiment. From these images, DIC was performed to obtain the experimental displacements to be plotted versus the imposed ones. A large part of the specimen was considered in the calculus area in order to be pertinent. Correlation subsets of 32x32 pixels² with a 32 pixels interval were chosen to perform DIC calculation. For strain tests, a mechanical tension machine with mobile jaws was used. Each jaw had a displacement speed of 0.5 mm/min along the x-axis. To test the different speckle patterns, only the 10-bits CCD camera was used during these experiments. It was arranged so as to have an in-plane scale factor of 0.06mm/pixels. Strains were imposed up to 55% for each experiment with an acquisition speed of one image every five seconds. For these strain tests, bilinear and bicubic interpolation were used in the DIC process on a calculus area which takes into account almost the whole surface of the specimen as for the displacement tests. Correlation subsets of 16x16 pixels² with a 16 pixels interval were elected. 2.3 Displacement and strain measurement accuracy For displacements tests, as displacements are assumed to remain homogenous on the whole surface of the specimen, gaps between imposed and measured displacements are calculated for each subset
31002-p.3
EPJ Web of Conferences centre. The average gap is then calculated so as to obtain the systematic error, as well as the standard deviation σα of the gaps to calculate the uncertainty ∆α=2σα for a level of confidence of 95%. This process is performed for each imposed displacement in order to take into account the errors relative to all subpixel displacements. For strain experiments, the mark tracking technique [11] has been performed exactly in the same conditions as for the speckle patterns used by DIC. The obtained strains with the mark tracking technique are assumed to be the imposed one and are compared to the ones obtained with DIC.
3 Displacement results As the displacement results of painted and powder speckle patterns were equivalent, only the results obtained for the powder are presented here to see the influence of the other parameters. Figure 2 shows the results obtained for a specific case: 10-bits camera with a bilinear interpolation. Differences between measured and imposed displacements are plotted in Figure 2.a on a 2 pixels imposed displacement. The well-known sinusoidal evolution of the systematic error can be seen in this figure [3,5,12]. In Figure 2.b, the evolution of the standard deviation is plotted according to the imposed displacement, which shows that the minimum of deviation are for the integer pixel displacements. (a)
Error (pixel)
0.04 0.02 0 -0.02
0
0.5
1
1.5
-0.04
2
Standard deviation
(b) 0.02 0.015 0.01 0.005 0 0
-0.06
Imposed displacements (pixel)
0.5
1
1.5
2
Imposed displacement (pixel)
Fig. 2. Displacement error (average and uncertainty) assessment according to the loading direction for the case of bilinear interpolation applied on images recorded with the 10-bits camera
All the CCD cameras and types of interpolation previously cited were tested. As they present the same type of behaviour as the case presented in figure 2, only the plots for this specific case is presented in this paper and the obtained results for each case are presented in table 1. From this table, it can be assumed that the type of interpolation does not have a strong influence on the measurement uncertainty compared to the camera used. Indeed, it can be seen through these results that the 8-bits camera gives results 1.6 times larger than the one obtained with the 10-bits camera. Nevertheless, the 10-bits camera gives also better results than the 12-bits one for all the studied cases. In first approach, the accuracy should be equal to the inverse of the grey level dynamic, which means that the 12-bits camera should have given better results than the 10-bits ones. Table 1. Maximal uncertainties obtained for the 6 studies cases
Bilinear interpolation Bicubic interpolation
Camera (bits) 8 10 12 8 10 12
31002-p.4
Uncertainty (pixel) 0.030 0.019 0.027 0.032 0.020 0.025
14th International Conference on Experimental Mechanics To understand this unexpected result, noise quantification has been performed. For each camera, 30 images were recorded successively for 10-bits and 12-bits cameras. Their grey level variations at the centre of images were then measured and plotted in figure 3 for a specific grey level value corresponding to the average of the previous experiments. On this figure, the 12-bits camera seems to be noisier than the 10-bits one. In the noise quantification experiment, the standard deviation of the grey level variation of the 10-bits camera is estimated at 0.757, whereas the 12-bits camera has 1.545. These results can explain the better uncertainty for displacement measurements obtained with the 10-bits camera compared to the one obtained with the 12-bits one. As the noise of this latter seems to be have a strong influence on accuracy, which corroborates results of previous studies [13] where the quantification of the noise is linked to the evaluation of accuracy. 4 3
Grey level
2 1 0 0
10
20
30
10 bits 12 bits
-1 -2 -3 -4
Number of image
Fig. 3. Grey level variation on a spot of images recorded with 10-bits and 12-bits cameras
4 Strain results Figure 4 shows results obtained for different speckle patterns on strain measurements. Through this figure, the type of speckle patterns has obviously a strong influence on strain measurements in the loading direction. Painted speckle patterns give similar results as the one obtained by the mark tracking technique, whereas the speckle patterns made of powder underestimate strain values. Contrary to the paint, particles remain rigid during the whole experiment, which means that the grey level distribution is not uniformly deformed. The material transformation described in equation (1) used in our DIC process can not estimate this nonhomogeneous transformation of the grey level distribution. Painted speckle patterns show also differences with the mark tracking technique but only over 50% strain. These results, slightly different, can be explained by the occurrence of cracks on the speckle patterns. For strains lower than 10% (figure 5), the type of speckle patterns does not have influence on strains measurements as results are similar between all the tested speckle patterns. For these strain values, the grey level distribution can be assumed to have a homogeneous transformation even with the powder speckle patterns. The material transformation shown in equation (1) is then best suited for this range of deformation whatever the speckle pattern.
31002-p.5
EPJ Web of Conferences
0.6 0.5
Principal strains
0.4
Mark Tracking
0.3
Powder (1)
0.2
Powder (2) Black Paint
0.1
White Paint 0 0
0.5
1
1.5
2
2.5
3
-0.1 -0.2
Load (daN)
Fig. 4. Influence of the speckle pattern on strain measurements
0.1
Principal strains
0.08
Mark Tracking Powder (1)
0.06
Powder (2) Black Paint
0.04
White Paint 0.02
0 0
0.1
0.2
0.3
0.4
0.5
0.6
Load (daN)
Fig. 5. Influence of the speckle pattern on strain measurements for strains