JOURNAL GEOLOGICAL SOCIETY OFEXNER INDIA CEES W. PASSCHIER AND ULRIKE Vol.75, January 2010, pp.32-42
32
Digital Mapping in Structural Geology – Examples from Namibia and Greece CEES W. PASSCHIER1 and ULRIKE EXNER2 1
Cees Passchier, Department of Earth Sciences, University of Mainz, D 55099 Mainz, Germany Ulrike Exner, Department for Geodynamics and Sedimentology, University of Vienna, Austria Email:
[email protected]
2
Abstract: Many problems in geology, especially structural geology, can only be solved by detailed mapping. Presently, mapping is still mainly carried out on paper using techniques from the 19th Century. However, tools are now available to carry out most mapping tasks on microcomputers in the field without any need of paper. This speeds up geological mapping and reduces the errors involved in the mapping process. Digital mapping also allows work in featureless areas and areas of great structural complexity that would not be possible using paper maps. We present two practical examples of the new technology of digital mapping using microcomputers, from Namibia and Greece. Keywords: Digital geological mapping, Differential GPS, Geospatial data, Field studies. INTRODUCTION
The natural sciences originated from our wish to understand the world around us, and from our curiosity as to why it is arranged the way we see it. In the course of time, most natural sciences have specialised to the extent that their questions can only be answered by carefully controlled experiments carried out in laboratories. The same happened to some branches of geology, but geology is similar to archaeology and other observational sciences in that it is hard or impossible to carry out experiments on the development of larger-scale structures; the processes involved are too large-scale in space and even more extensive in time. Therefore, geology makes progress by careful observation of features in outcrop and by elimination of a number of possible interpretations. Interpretation models are set up based on observations, which are then modified until new observations either invalidate them, or only refine them, after which a model is considered to be the most likely interpretation. Most large-scale geological processes can only be understood if sufficient data are collected in the field. Such data can include observations on lithology and mineral content of the rock, or structural observations on shape and orientation of sedimentary, igneous or deformation structures. In order to place such information in the right context and to understand their mutual relationship over a larger area, it is necessary to map their distribution in the terrain. Many areas on Earth have not yet been mapped
geologically in any detail, and in most areas the mapping that has been done is outdated because of progress in the understanding of geological structures and the way they form. For this reason, geological mapping of large areas for the simple purpose of producing geological maps is continuously necessary. For geological research, whether basic research or work for the mineral and oil industry, mapping plays an important role. Because of the complexity of geological observation, it is usually insufficient to simply take samples or make isolated observations if one has to understand the larger geological context. Even if a geological map is available, it may not be up to date or not show enough detail of the feature investigated; in all such cases, some degree of mapping is necessary to create a context for the new observations. Geological maps have been paper maps since the Turin papyrus of 1150BC (Harrell and Brown, 1992) and William Smith’s 1815 map of Great Britain (cf. Winchester, 2001). Besides the fact that paper maps are unwieldy and impractical in adverse weather conditions, their main limit is the concept of scale. Once a map scale is chosen, small details closely spaced together cannot be shown, and features outside the map must be found on other sheets. Geologically relevant data such as lithology, structure, mineral parageneses, magnetics, gravity and radiometric data must be shown on separate paper maps in order to avoid clustering. Even for small areas, several maps are usually
0016-7622/2010-75-1-32/$ 1.00 © GEOL. SOC. INDIAJOUR.GEOL.SOC.INDIA, VOL.75, JAN. 2010
DIGITAL MAPPING IN STRUCTURAL GEOLOGY – EXAMPLES FROM NAMIBIA AND GREECE
needed. These restrictions imposed by paper maps hamper geological understanding, especially if different types of maps are published with different scale, projection and datum. The onset of GIS (Geographic Information System) programs in the last decades, however, have finally liberated geologists from the concept of scale on the computers screen, since “zooming” options allow the observation of whatever detail is needed on any part of a map. In addition, different kinds of maps can be overlain in semitransparent mode, and adapted for scale, projection and datum. During the process of geological mapping, complex data must be collected, organised, and processed. Presently, GIS packages can help to organise and present data in an ordered, reproducible way. The main, unsolved problem of geology is how to smoothen the process of collecting the data. Presently, most geologists collect data the same way as was done in the 19th century; comparison of the maps and geological notebooks used by Charles Darwin (Herbert, 2005) show few differences with that of a modern geologist, nearly 170 years later. The reason is that geological data are extremely heterogeneous and difficult to order into simple systems and tables: additional sketches and descriptions
are usually necessary. A second problem is that new technology has not been of much use to geology because until recently computers were not portable and weatherproof enough to be used by field geologists. The liberty that GIS programs provide on the computer screen is generally lost when geologists proceed to do fieldwork – the GIS maps are printed to a fixed scale on paper, and carried into the field. Classical field mapping is carried out in two stages (Fig 1). During the field stage, paper maps are prepared with a GIS program. These are carried into the field, and boundaries and measurements are plotted on the map manually with the help of a GPS or topographic navigation. Notes on the geology and GPS coordinates of measurements are entered in a field notebook. In many cases, there is no time or opportunity to plot all on the map, and data are mostly collected in the notebook. During the second or lab stage, ideally in a base camp but usually back in the lab at the end of a complete field season, paper maps are scanned and georeferenced; lists of measurements are prepared and linked with their GPS positions and entered into a spreadsheet, then imported into the GIS program (Fig.1).
"Paper mapping" Field
Lab 23
23
GIS Final map and report
map map 23 ..
gps
measurements notes locations
23 ..
measurements
locations notes
notebook notebook missing data second, third ... field trip
"Digital mapping" Field
Lab
Digital field mapper (contains GPS and digital compass) maps measurements locations
Final map and report
GIS
notes
Fig.1. Typical work flows in classical paper-based field-mapping (top), and digital mapping (bottom). JOUR.GEOL.SOC.INDIA, VOL.75, JAN. 2010
33
34
CEES W. PASSCHIER AND ULRIKE EXNER
The disadvantages of this staggered system of work will be clear. The two-stage process of mapping inhibits a flexible link between observation and geological model; most of the data only become available in an intelligible way on a computer screen after data have been treated by the GIS step, which is normally in the lab, possibly hundreds or thousands of km away from the fieldwork area. Observation of the completed maps and ordered data normally brings up questions which could have been answered in the field by local detailed mapping; in the two-step process, these questions can only be answered by returning to the field for additional mapping, and renewed plotting, so that the cycle may have to be repeated several times. If geological mapping is carried out in a team, the problem sketched above becomes even more serious; it is harder to obtain an overview of geological structures in the field because of the several, separate, overlapping paper map slips and several non-coordinated sets of measurement data. Besides the problems sketched above, some types of mapping are simply hard to do on paper, e.g. plotting small structures such as tight complex folds in a lithological contact in flat terrain; numerous GPS measurements are necessary, which have to be laboriously plotted one by one on the map in order to reconstruct the structure. In such cases, it is easy to loose the overview of the feature involved and as a result, many interesting and important small complex structures remain unmapped. Finally, accuracy is limited since grids on a paper map are coarse and GPS locations are difficult to plot accurately by hand on paper maps. Exclusive storage of GPS positions and measurements in a field notebook or in the GPS device is no solution, since the results cannot be immediately used in the field to interpret the local geology. The obvious solution for the problem at hand is to use a computer in the field that allows direct entering and monitoring of GIS data. This paper treats the experience we obtained over the past five years using computers and GIS for field mapping. Other workers compared digital and paper mapping as well (e.g. McCaffrey et al. 2005; Maerten et al. 2001; Pollard and Fletcher, 2005; Pearce et al. 2006; Jones et al. 2009) but our methods differ from this earlier work by complete abolishment of paper maps and notebooks to a stage of full digital mapping. DIGITAL MAPPING
The use of computers in the field is restricted by the following requirements on hardware and software: a) the computer should be small and lightweight and allow the geologist to scramble over difficult terrain and
rocks or trees without being hampered by a big device; without maps, mobility should actually be improved; b) it should be shock-, water-, mud- and dustproof; c) it should have a reflective layer behind the screen so that it can be used in bright sunlight; d) it should be easy to operate without a keyboard and mouse; e) battery life should be at least one full working day; f) data should be saved on the fly so that no data are lost when the computer operating system “freezes” and has to be rebooted, or when the battery is drained. The geologist must be able to fully rely on the system without any fear of data loss tempting him to back-up on paper, which is highly time-consuming; g) the data collecting programs should communicate smoothly with the desktop GIS applications; h) the software should make life easier for a mapping geologist, not more difficult. Speed and ease of use are essential, and implication of personalised mapping methods should be possible. Fieldwork can be stressful enough because of weather conditions, animals, traffic or other diversions and it is essential that geologists can concentrate on the actual mapping, not on how the software works or should work. We are presently using pocket PC computers (PPC) from Trimble™ which are completely water, dust and shockproof, can be held in one hand or stored in a pocket like a paper notebook, and are operated with a stylus by writing on the screen. The devices contain a layer that reflects sunlight back through the active part of the screen, and are therefore perfectly readable in bright sunlight. In the dark, or in dark weather, a backlight makes working possible. The battery life is between 8 and 20 hours, even if backlight is used. The device uses MS Windows™ for PPC as an operating system, and is permanently switched on, i.e. the system is never shut down and rebooted. This has the advantage that one never has to wait to start working: like a paper notebook, it is ready when one needs it. Since data are saved when they are entered, no data can be lost when the computer occasionally “freezes” or is accidentally switched off. The software we use to monitor data in the process of normal mapping with a standard GPS with a resolution of 5-10m is Discover Mobile™ from the company Encom™, a program that is cloned on Pitney Bowes-MapInfo™ (Fig.2b). Discover Mobile™ is actually a simplified, pocket PC version of MapInfo, but adapted for geologists with added features such as geological symbols, and the possibility to enter measurement data of geological structures, well data, cross-sections etc. Files produced by JOUR.GEOL.SOC.INDIA, VOL.75, JAN. 2010
DIGITAL MAPPING IN STRUCTURAL GEOLOGY – EXAMPLES FROM NAMIBIA AND GREECE
35
Fig.2. Trimble Recon™ at left and life-size screen of the Trimble™ with a Discover-Mobile™ map at right.
Discover Mobile™ can be directly used as MapInfo files, and vice versa. For ArcGIS™ users, a similar pocket PC software exists called “Arc Pad™”. This functions in a similar way to Discover Mobile™ and allows direct exchange of files with Arc. Since our experience is largely with Discover Mobile™, we concentrate on the way it is operated below. ArcPad differs from this outline mostly in details of the graphic interface, and needs an additional piece of software to enter structural measurements, which is provided by the USGS under the name GDA (http://gcmd.nasa.gov/records/ USGS_GDA.html). Alternatives to our hardware setup are (1) any of the small standard pocket PCs commonly used as pocket diaries, or (2) a full scale portable laptop PC that runs standard Windows software and the standard GIS application that is also used in the office. Some of these portable PCs are also weatherproof, with a reflective screen and long-life batteries. However, both setups have their disadvantages (see also Clegg et al., 2006). (1) Small diary pocket PCs are cheap, and will operate the field-adapted GIS software mentioned above, but have short battery life, are not rugged enough for fieldwork, not water and dust proof, and lack a reflective screen so that they can only be used on the darkest of days or below a hood. (2) Portable PCs, even those without a lid, JOUR.GEOL.SOC.INDIA, VOL.75, JAN. 2010
are rather bulky and heavy; they can only be operated by taking them in and out of a bag, or carrying them on a strap; this is no problem if fieldwork is carried out close to a car or along roads, but inhibits the freedom of working in normal, more strenuous field conditions away from civilisation. In addition, the use of normal Windows software and GIS means that the computers have to be switched off and rebooted regularly, which is time consuming. Moreover, the use of a full-blown GIS package is not ideal in the field since it has too many options and buttons to operate, and commonly uses menus that are hard to operate with a stylus. The Windows and standard GIS software was designed for office workers behind a desk using a mouse and a big screen, not for fieldworkers in adverse weather with a small screen and a stylus. MAPPING PROCEDURE USING DISCOVER MOBILE™
In Discover Mobile™, geological and structural vector maps are constructed as part of the mapping process by drawing with a stylus on the screen. The program allows the use of bitmaps, which are projected in transparent mode over the geological or lithology vector maps. These can be topographic maps, satellite images, geophysical data,
36
CEES W. PASSCHIER AND ULRIKE EXNER
photographs, etc. Any already existing vector maps available as MapInfo files can be used, including lithology, faults, folds, structural measurements, well log data etc. Structural measurements appear as dip-strike or lineation symbols with dip/plunge values. All maps and information can be either stored in internal memory of the device, or on a flash card. Preparation for field mapping consists of preparing the maps, satellite images and other basic data that one wants to use in the field as MapInfo tables, and to upload these to the field device. Previously produced digital map files are also uploaded. Older scanned field notebooks, publications, figures, tables etc. can all be carried on the device as PDF or PowerPoint files, and used for reference in the field. Next, a number of new empty tables are created as clones from the existing map files; these serve to keep old and newly collected data separate, so that it will be possible to see what has changed. For the actual mapping process, the device is switched on, and the program started; from here on, it will not be switched off until the end of the field season, unless rebooting is necessary. A GPS (either integrated into the device or separate, connected via Bluetooth) is switched on and a connection between GPS and device is established. Like in standard navigation devices, the position of the operator is shown as a small, moving red dot on the screen. Mapping can start now including the following actions: a) draw new lithology, shear zones or faults with the stylus by hand from observations; b) modify or correct existing lithological contacts; c) enter structural measurements such as bedding, foliations and lineations after measurement with a compass; d) enter field notes, photograph or sample numbers and sketches on a particular outcrop (further discussed below). It is usually sufficient to use three layers to enter data on; (1) lithology and outcrop points; (2) structural measurements; and (3) walking tracks, as outlined below. Geologists normally enter lithological contacts in one of two ways; they walk along a contact and mark it in passing, or they sketch it in from a distance. Both techniques are used depending on detail needed, time available and how easy it is to move around for topographic reasons. It is not always possible or necessary to follow a contact exactly on foot. Both methods are possible with digital mapping, since topography or satellite maps are used as a background in the device, but especially the tracking of layers by walking is easy because the program can map out a contact automatically from the changing GPS position.
It is advisable to make any additions or changes to lithology in a separate layer from the one that already exists; this is not as pretty as making changes directly to an existing object, but it is in this way possible to monitor the mapping process. It is very hard to determine which nodes in a contact line have been shifted once corrections have been carried out to an existing object in presently available software, and if a geological contact is systematically modified along a trajectory, it will be hard to know what has already been done if changes are directly made to existing objects. Also, mapping errors are hard to correct if only one layer is used. Structural measurements are entered by activating a structure file; a page is opened where dip, strike and the type of measurement can be entered, and when the enterpage is closed, the dip-strike or lineation symbol appears on the spot of the GPS symbol. In this way, it is no longer necessary to enter measurements in a field notebook, or to enter them by hand on a map where they will either be inaccurate in orientation, because it is hard to draw a strike line at the exact angle by hand, or partly obscure other measurements which were monitored nearby. In this way, it is possible to see measurements in the correct orientation and to avoid clustering by changing the screen's scale. A layer that monitors the track walked during a day is a novelty in mapping. It is automatically created by the software in the background during mapping, and is extremely useful for the mapping process; it allows clear distinction between parts of the outcrops that have been visited and those that have been sketched in from a distance. Also, it allows to see at what time a specific feature was visited and as a result, it is no longer necessary to enter data on photographs taken; if the clocks in the mapping device and the camera are synchronised, a link can easily be established. Walking track layers are clearly an improvement on reliability diagrams or series of observation points produced in traditional mapping. One of the great advantages of digital mapping over paper mapping is the disappearance of the scale restriction; it is possible to enlarge or decrease the size of the map in the field of view without limits. On paper maps, it may be possible to carry a few overview maps, but the mapping itself is done on a paper map of a fixed scale. Because of this, it is difficult to map small details when this suddenly turns out to be necessary. With the digital mapping setup, small details can be entered anywhere, anytime, and the only limit to small-scale mapping is the resolution of the GPS (see example-II below). Field notes can be made in a separate paper notebook, but this is no longer necessary: it is a good option to use a word processor or notes program for this with the standard JOUR.GEOL.SOC.INDIA, VOL.75, JAN. 2010
DIGITAL MAPPING IN STRUCTURAL GEOLOGY – EXAMPLES FROM NAMIBIA AND GREECE
37
handwriting-recognition function that pocket PCs have, which transfers written notes directly to ASCI. Most notes and word processing programs also allow the entering of sketches, alternating with text, some even in colour. The result is a digital field notebook that can easily be transferred to the home computer, and carried into the field for future reference. In this way, the tools needed for mapping remain restricted to the Pocket PC and a compass. For outcrop numbers, it is easiest to use the ID number that is automatically created by the Discover Mobile when an item is entered in the layer of measurements. At the end of a field day or, if away from civilisation, after return to base, the layers and field notebook file used that day can be downloaded to a PC, either to serve as a backup or to add the new data to the existing map. It is also possible, however, to map an entire field season just on the pocket PC, without using a base PC. In that case, it may be wise to make a backup on a separate flash card. Since pocket PCs can use a special version of the Adobe™ PDF reader, pdf files of relevant maps and papers can be carried on the device into the field; the same applies to photographs of outcrops visited at earlier occasions, graphs, and spreadsheet files. One of the powers of digital mapping is that it is possible to build and update a geological map during the mapping process where it should happen, in the field. If time allows, it is therefore possible to add the new data to existing GIS layers every day. A useful method is to create new, amended versions of the maps regularly and to store these in dated folders. The amended maps can be uploaded as a background in the computer again, while new empty layers can be used to enter the new data. This technique of regular downloading, upgrading and uploading has the advantage that one always carries the most up-to date version of the maps. This is of special significance if mapping is carried out in a team, each member mapping part of an area in separate traverses. An updated map carrying the results of the work of all teams is very valuable in such situations.
c) All types of base maps and additional information can all be carried into the field in one small device, and alternated with the push of a button; satellite maps, magnetic maps, topographic maps, air photographs, well log data, geochemical data, etc. d) Mapping can be carried out in areas where, for political or other reasons, no or no proper base maps are available. e) Mapping can be done free of the limits of map scale – it is possible to zoom in and out to any required scale. f) Any number of structural measurements, but also symbols for fossil content, borehole data etc. can be stored on a digital map. On a paper map, the number of symbols that can be displayed is limited since dense clusters of symbols become unreadable; some have to be left out or displaced by necessity. On a digital map, symbols are also shown at a fixed size on the screen and can locally obscure other data and each other, but this is remedied by simply enlarging the map by “zooming in” to the required scale. g) Additional data such as older field notebooks, publications, figures, tables, pdfs of papers and spreadsheets can be used in the field. h) Position is monitored continuously, and information on movement during the day can be stored in walking track maps. i) Measurements can be entered rapidly at their correct position and can be seen and used for interpretation immediately during the mapping. j) All information is stored in one small device; there is no longer a need to carry loads of paper and several devices. k) Mapping can be continued regardless of weather. Rain, snow, sand or wind can only affect mapping to the extent that they hinder the geologist involved in the work. l) Data backup is safer and easier, and copies can easily be distributed; all data are stored on small flash cards.
ADVANTAGES OF DIGITAL MAPPING OVER PAPER MAPPING
DISADVANTAGES OF DIGITAL MAPPING
The advantages of the digital mapping over paper mapping can be summarised as follows: a) The need for a two-step mapping process, alternating mapping and entering of data into a GIS system disappears; mapping and GIS processing and ordering of data are integrated. b) The time needed for post-processing of GIS projects back in the lab is significantly reduced. JOUR.GEOL.SOC.INDIA, VOL.75, JAN. 2010
We can only think of the following minor disadvantages of digital mapping a) The map screen in a PPC is small; for those with reading glasses, and those people with large handwriting this may be a disadvantage. b) It is not easy to scribble notes on a digital map as one can do in the margin of a paper map. c) One has to remember to charge batteries and take spare batteries into the field.
38
CEES W. PASSCHIER AND ULRIKE EXNER
d) The geologist should preferably learn how to use the device before the first field season, in order to be timeefficient and not overwhelmed by the functionality of the new device. e) Extreme temperature conditions (below 0° and above 40°C air temperature) may limit the use of the device because it affects the electronics or battery life. Above we have sketched the process of digital mapping and how we have optimised it over the last five years during field mapping. We have mapped with this setup in desert terrains in Australia, Northern Africa and Saudi Arabia, including sand and dust storms; along coastal outcrops in southern Australia, Spain and Uruguay with seawater spray; in high mountain terrains in Argentina, Uganda and Chile up to 5000m; in forested terrains and along roads in Germany and France, and in the tropical rainforest in Brazil. Archaeological mapping of Roman aqueducts was carried out in Turkey, France, Germany and Northern Africa. Differential GPS for detailed mapping of structural geology was practiced in Greece; precise positioning of geophysical profiles (e.g. ground-penetrating radar) in Austria. From our experience and from speaking to other geologists about problems involved with mapping, we found that the digital mapping process should follow the process of paper mapping as close as possible, and should take away some of the disadvantages of paper mapping, not add new difficulties. For this reason we like to use a lightweight small device with the ‘feel’ of a field notebook, which allows one to scramble over rocks with the device in a pocket, rather than more powerful portable PCs. We have chosen to go for simplified GIS software instead of the full package that would run on a portable PC; one wishes to concentrate on the geology during mapping, not on how a complex program works. For the same reason, we have chosen for an option where one enters data in ‘field notebook’ fashion as much as possible; the other option, long pick lists to choose from, is time consuming and irritating since the pick lists are hard to customise. Of course, the situation is different for every geologist, but the system is flexible enough to allow everybody to set up their ideal combination of hard- and software. To illustrate the possible results of digital field mapping, we have added two examples, one of ordinary mapping with a GPS resolution of 5 m at best, and one of high-precision differential GPS work. EXAMPLE I – REGIONAL MAPPING: THE GOANTAGAB DOMAIN IN NAMIBIA
The Goantagab domain in Namibia is an area of complex
deformation at the junction of the NeoproterozoicOrdovician Kaoko and Damara Orogenic Belts (Gray et al. 2006, 2008; Passchier et al. 2007). It is an area of high structural complexity that is hard to map with traditional methods. The core of the area is shown in Fig.3. The area consists of metapelite, metapsammite and limestone deposits of Neoproterozoic age, intruded by granite and syenite plutons dated at 530 Ma (Passchier et al. 2007; Schmitt et al. 2008). All sediments are deformed by at least four overprinting deformation events, labelled D1, D2, D2b and D3, of which D2b and D3 postdate granite intrusion. All four events produce foliations, folds, lineations and other structures, but all were developed under similar greenschist facies conditions. In such cases, it is hard to distinguish the effects of different deformation phases. For a successful geological analysis, a large number of closely spaced measurements is necessary, and lithological contacts must be mapped in as much detail as possible. Digital mapping provides the necessary tools to do this rapidly and accurately. As an example, consider the core of the Goantagab Domain as shown in Fig.4. This is a flat, featureless desert area of almost continuous exposure, but without suitable topography for reference, and without suitable contrast between lithologic units on air- and satellite images because of thin calcrete formation. The only way to sort out the structure is to map lithology and structure in the greatest possible details, but this would be prohibitively time consuming using paper maps and a GPS. However, one person with a Trimble Recon™ device and Discover Mobile™ software as described above was able to map the area of Fig.4 in approximately four hours in the detail shown here; many small folds mapped in the contact are less than 20 metres long. The mapped lithologies were mainly marble (blue), micaschist (green), diamictite (pink) and calcrete deposits (brown). Mapping proceeded by walking the boundaries of schist and marble, including the smallest folds, while the GPS drew the trace on the screen of the device. At regular intervals, e.g. when boundaries approached those previously mapped, the data accumulation process was halted to consolidate the mapped boundary and colour part of the produced map. Mapping boundaries in this way was occasionally also interrupted to map in “islands” of different lithology within the main bodies and to enter measurements of bedding (black), S2 (green) and stretching lineation (red). Although it was generally possible to map the schistmarble interface because of the difference in weathering, the schist was mostly sand-covered and outcropping in few locations and as a result, no proper form-surface map of schistosity locations can be given. However, the shape of JOUR.GEOL.SOC.INDIA, VOL.75, JAN. 2010
DIGITAL MAPPING IN STRUCTURAL GEOLOGY – EXAMPLES FROM NAMIBIA AND GREECE
39
Amis River Formation Gemsbok River Formation Brak River Formation
Greenschist-metadiorite
Marble Schist
Diamictite
Brandberg-West Formation
Marble
Biotite granite Horblende syenite
Zebraputz Formation
Fig.3. Map of the Goantagab area (Namibia), at –20.768° S, 14.444° E (centre of image). The area was mapped over a period of six weeks using Trimble Microcomputers and Discover Mobile™.
the contact could be mapped in so much details that it alone shows that there must be three deformation phases affecting it, labelled D1-D2-D2b; in the fold interference structure at left, folds belonging to each phase are labelled in red. From this work we concluded that the central marble unit in Fig.3 (dark blue) with its core of diamictite (purple) is a km-scale D1-D2 sheath fold structure parallel to N-S trending stretching lineation in the area which was formed during N-directed nappe transport within the Damara Belt (Passchier et al. 2007). This was overprinted by D2b in the form of N-S trending open folds which probably formed because the granite-syenite plutons intruded late during development of the sheath folds. The presence of the solid granite lenses and sills caused changes in flow regime and formation of D2b structures (Passchier et al. 2007). D3, the JOUR.GEOL.SOC.INDIA, VOL.75, JAN. 2010
last deformation phase in the area, has only minor effects in the central Goantagab Domain. Clearly, the kind of mapping detail in Figs.3 and 4, which helps analysis of a complex structure, would be very hard to obtain with classical paper mapping, even using a GPS. EXAMPLE II – DETAILED DIGITAL MAPPING USING DIFFERENTIAL GPS – AN EXAMPLE FROM KEA ISLAND, GREECE
Some specific task during geological field work may require a more precise determination of global and relative position of the investigated features. Examples may be (1) high resolution mapping of geometric geological structures (e.g. fault systems, folds), (2) mapping of
40
CEES W. PASSCHIER AND ULRIKE EXNER
Fig.4. Map of central part of the Goantagab domain as reproduced in Fig.3. This map was produced by digital mapping. See text for details.
geomorphologic features (e.g. terraces, fault scarps) or (3) documentation of geophysical measurements. For such assignments, the spatial accuracy of a standard GPS field computer (usually 5-10 m) is not satisfactory. There are two types of high-precision GPS systems, which may be employed with different levels of spatial resolution. Differential GPS (DGPS) receivers provide the possibility of post-processing of the recorded data and yield final accuracy within the sub-meter range. Differential correction may be performed using corresponding data either recorded by a second stationary DGPS installed by the mapping team, or by downloading available correction data provided by global reference stations. Even better accuracy of only a few cm can be obtained by using Real-Time Kinematic GPS (RTK-GPS) systems, where the GPS signal is complemented by radio communication between the mobile recording unit and a nearby installed base station. Several recent studies that investigated the usefulness of digital mapping devices (e.g. Clegg et al. 2006), demonstrated the possibilities of integration of several datasets (e.g. McCaffrey et al. 2005; Jones et al. 2009), or employed high-resolution DGPS data for the construction of accurate structural models
(e.g. Maerten et al. 2001; Pollard and Fletcher, 2005; Pearce et al. 2006; Mynatt et al. 2007). Here, we want to present an application of DGPS on structural mapping of a fault related fold using a Trimble GeoXH™ device with a sub-meter spatial resolution (down to 15-30 cm horizontal and 30-60 cm vertical precision). An extraordinarily well exposed example of a fault-related fold was discovered during field work on the Cycladic island of Kea, Greece (Rice et al. 2008). The outcrop is located in the north of the island, along the rocky shore of the bay of Outzias. The field photograph from the across the bay (Fig.5) displays a conjugate set of faults crosscutting a unit of foliated greenschist facies metasediments and meta-volcanoclastic rocks. The foliation, which is parallel to the metamorphic layering, is conspicuously deflected near the fault planes, which we interpret as an expression of reverse fault drag (Grasemann et al. 2005). The displacement gradient along a fault induces a perturbation in the host rock, which compensates the discontinuous displacement along the fault by a gradual deflection of the host rock (Passchier et al. 2005). In this example on Kea, the deformation induced by the perturbation field is accommodated by ductile JOUR.GEOL.SOC.INDIA, VOL.75, JAN. 2010
DIGITAL MAPPING IN STRUCTURAL GEOLOGY – EXAMPLES FROM NAMIBIA AND GREECE
Fig.5 Outcrop view of the mapped structure from across the bay of Outzias (Cycladic island of Kea, Greece). Greenschist facies foliation planes are deflected along a set of conjugate fault zones.
folding, formation of crenulation cleavage in the fold hinges and small scale brittle faults and joints. This interpretation of the structure is supported by the fact that a similar orientation of folds has not been found anywhere else on the island. In order to generate a detailed three-dimensional model of the exposed structure, DGPS data were collected during a 5-days field campaign. Foliation traces of the deflected marker planes, as well as fault plane traces of major and secondary faults were mapped with a rover DGPS receiver, attached to an external high-precision antenna (Trimble Hurricane™, Fig.6a). The structure traces were recorded as line features using the Trimble software TerraSync™, connecting points with
41
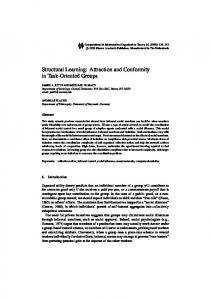
0.2-0.5 m average map distance. TerraSync™ provides the opportunity to map a line feature as a series of individual vertexes, which we favoured rather than mapping the line during slow walking at a constant speed, as the rugged outcrop surface and the sometimes strong wind made the task rather challenging. During data collection, a second GPS receiver was installed as immobile base station (Fig.6b), recording reference data for subsequent differential correction of the rover positions using the matching Trimble software package GPS Pathfinder Office™. The post-processing horizontal accuracy of the data was in the range of 15-40 cm, the vertical accuracy ranges between 30 and 80 cm, i.e. twice the horizontal precision. The corrected GPS-files were imported into the 3D structural modelling software Gocad™ (Paradigm™), which allows for additional data editing and construction of 3D-surfaces from the recorded dataset, according to the field measurements for azimuth and dip of the individual planes (Fig.7). A 3D reconstruction of the outcrop from the
Fig.7. Oblique view on the 3D structural model constructed from DGPS data. The constructed planes represent the deflected foliation planes (various colours) and fault planes (red). The outcrop topography is shown as a transparent grey surface. True dip and azimuth of the planes was constructed by integrating structural field measurements.
Fig.6. (a) Digital mapping using a Trimble GeoXH DGPS unit, with an external high-precision antenna (Trimble Hurricane™) mounted on a pole. (b) Setting-up the base station on a tripod for collecting autonomous reference data. JOUR.GEOL.SOC.INDIA, VOL.75, JAN. 2010
mapped fault and foliation traces shows the reverse drag of the foliation planes. A displacement gradient towards the fault tips corresponds to the variation in drag. The structural model may not only serve as a basis for structural interpretation, but also e.g. as natural input geometry for mechanical modelling. Digital mapping of outcrops with special structural interest has clear advantages over conventional detailed mapping, in that the geometries are recorded with much greater accuracy and precise relative and global position. Especially the three-dimensional distribution of structural patterns can be represented more precisely than on a paper
42
CEES W. PASSCHIER AND ULRIKE EXNER
map. Other methods of digital surveying, such as terrestrial laser scanning or digital stereoscopic photography (e.g. McCaffrey et al. 2005), may be more time-efficient during data recording. However, at some outcrops, like the one presented here close to the sea, these more rapid 3D surface mapping devices cannot be positioned in a stable and safe distance from the target, where resolution and view angel permit high quality measurements. Most importantly, DGPS mapping requires and facilitates geological interpretation during data recording. This may be crucial in many objectives, because any observation that is not supported by clear field evidence cannot be equivocally determined back in the office.
Acknowledgements: CWP thanks the Schürmann Foundation for financial support during several years of mapping in Namibia, the University of Western Australia and Klaus Gessner for a grant to test the equipment in WA, DAAD PROBRAL and JEBEL for financing fieldwork in Brazil and Egypt. This work is carried out by CP as a member of the research programs GEOCYCLES and CSM in Mainz. UE thanks E.Draganits for discovering the structure on Kea, and K. Voit, M. Mueller, M. Ebner, and B. Grasemann for helping hands and discussion during the measuring campaign. Fieldwork in Greece was funded by the projects T325-N14 and P18823 of the Austrian Science Fund FWF.
References CLEGG, P., BRUCIATELLI, L., DOMINGOS, F., JONES, R.R., DE DONATIS, M. and WILSON, R.W. (2006) Digital geological mapping with tablet PC and PDA: A comparison. Computers & Geosciences, v.32, pp.1682-1698. GRASEMANN, B., MARTEL, S. and PASSCHIER, C.W. (2005) Reverse and normal drag along a fault. Jour. Struc. Geol., v.27, pp.9991010. GRAY, D.R., FORSTER, D.A., GOSCOMBE, B., PASSCHIER, C.W. and TROUW, R.A.J. (2006) 40Ar/39Ar thermochronology of the Pan African Damara Orogen, Namibia, with implications for tectonothermal and geodynamic evolution. Precambrian Res., v.150, pp.49-72. G RAY , D.R., F OSTER , D.A., M EERT , J.G., G OSCOMBE , B.D., ARMSTRONG, R., TROUW, R.A.J. and PASSCHIER, C.W. (2008) A Damara orogen perspective on the assembly of southwestern Gondwana. Geol. Soc. London Spec. Publ., no.294, pp.257278. HARRELL, J.A. and B ROWN, V.M. (1992) The world’s oldest surviving geological map - the 1150 BC Turin papyrus from Egypt. Jour. Geol., v.100, pp.3-18. HERBERT, S. (2005) Charles Darwin, geologist. Cornell Univerist Press, 485p. JONES, R.R., M CCAFFREY, K.J.W., CLEGG, P., WILSON, R.W., HOLLIMAN, N., HOLDSWORTH, R.E., IMBER, J. and WAGGOTT, S. (2009) Integration of regional to outcrop digital data: 3D visualisation of multi-scale geological models. Computers & Geosciences, v.35, pp.4-18. MAERTEN, L., POLLARD, D.D. and MAERTEN, F. (2001) Digital mapping of three-dimensional structures of the Chimney Rock fault system, central Utah. Jour. Struc. Geol., v.23, pp.585592. MCCAFFREY, K.J.W., JONES, R.R., HOLDSWORTH, R.E., WILSON, R.W.,
CLEGG, P., IMBER, J., HOLLIMAN, N. and TRINKS, I. (2005) Unlocking the spatial dimension: digital technologies and the future of geoscience fieldwork. Jour. Geol. Soc., London, v.162, pp.927-938. MYNATT, I., BERGBAUER, S. and POLLARD, D.D. (2007) Using differential geometry to describe 3-D folds. Jour. Struc. Geol., v.29, pp.1256-1266. PASSCHIER, C.W., MANCKTELOW, N.S. and GRASEMANN, B. (2005) Flow perturbations: a tool to study and characterize heterogeneous deformation. Jour. Struc. Geol., v.27, pp.1011-1026. PASSCHIER, C.W., TROUW, R.A.J., GOSCOMBE, B., GRAY, D. and K RÖNER, A. (2007) Intrusion mecahnisms in a turbidite sequence: the Voetspoor and Doros plutons in NW Namibia. Jour. Struc. Geol., v.29, pp.481-496. PEARCE, M.A., JONES, R.R., SMITH, S.A.F., MCCAFFREY, K.J.W. and CLEGG, P. (2006) Numerical analysis of fold curvature using data acquired by high-precision GPS. Jour. Struc. Geol., v.28, pp.1640-1646. P OLLARD, D.D. and FLETCHER, R.C. (2005) Fundamentals of Structural Geology. Cambridge University Press, Cambridge, UK, 500p. RICE, A.H.N., TEAM ACCEL and IGME. (2008) Low-angled detachment geometry and evolution based on a new geological map of Kea,W. Cyclades, Greece. Geophysical Research Abstracts, 10, EGU2008-A-03182. SCHMITT, R.S., TROUW, R.A.J., VAN SCHMUS, W.R. and PASSCHIER, C.W. (2008) Cambrian orogeny in the Ribeira Belt (SE Brazil) and correlations within West Gondwana: Ties that bind underwater. Geol. Soc. London, Spec. Publ., no.294, pp.279296. WINCHESTER, S. (2001) The map that changed the world. Penguin Group.
(Received: 18 April 2009; Revised form accepted: 17 May 2009)
JOUR.GEOL.SOC.INDIA, VOL.75, JAN. 2010