Journal of Structural Geology 23 (2001) 585±592
www.elsevier.nl/locate/jstrugeo
Digital mapping of three-dimensional structures of the Chimney Rock fault system, central Utah Laurent Maerten* ,1, David D. Pollard, Frantz Maerten The Rock Fracture Project, Stanford University, Stanford, CA 94305-2115, USA Received 12 April 2000; accepted 18 August 2000
Abstract Part of the Chimney Rock fault system, located on the northern San Rafael Swell, Utah, was mapped by integrating air photograph interpretation and differential global positioning system (GPS) location data. Fault slip, slip directions, and hanging wall subsidence/footwall uplift were digitally recorded in the ®eld along and between the normal faults using Trimble PathFinder equipment and software. GPS was used to record (with sub-meter precision) the location of each measurement as well as the UTM coordinates and elevation of stratigraphic markers at the top of the Jurassic Navajo Sandstone and near the base of the overlying Carmel Formation. The fault system, as well as the associated deformation of the sedimentary layers within the fault blocks, have been precisely characterized using this technique. The geographic coordinates and local elevation were transferred to gOcad to produce a three-dimensional surface representation of a selected resistant limestone layer, by interpolating the elevation between the collected data points using imposed constraints such as the dips of the layers and the locations of the major faults. Separations of the selected horizon from the footwall to the hanging wall were used to calculate the dip-slip distribution along the faults. The digital ®eld data were compared with the results of numerical modeling based on continuum mechanics to study the mechanical interaction among intersecting normal faults and the effects of this interaction on slip distribution and direction. This project illustrates the complete circle from digital mapping to data analysis to numerical modeling to quantitative comparison of theoretical models and ®eld data. q 2001 Elsevier Science Ltd. All rights reserved.
1. Introduction In structural geology as in many geoscience disciplines, collecting precise (reproducible) data in a natural setting is one of the prime requirements for any quantitative ®eld investigation. This is usually done to understand the physical relationships between the geological features and the global tectonics, or to validate (Oreskes et al., 1994) theoretical conceptual models using ®eld data. Inevitably, there is a need for accuracy in measuring the location of the collected data and, generally, a three-dimensional perspective is indispensable. Conventional ®eld mapping techniques to locate data collection sites involve the compass, topographic maps, photographs or measuring tapes. However, such data are not digital, and usually they are presented without topographic information and projected onto a two-dimensional observation plane. Today, sophisticated * Corresponding author. E-mail address:
[email protected] (L. Maerten). 1 Now at the Institut FrancËais du PeÂtrole, 92852 Rueil-Malmaison Cedex, France.
tools such as electronic theodolites and distance meters provide quantitative means of recording the precise threedimensional location of measurements relative to a base station. Although these are accurate tools, they require team work, one person to operate the total station and one to hold the re¯ector staff at successive points along the geologic feature: they can be logistically challenging, and time consuming. We describe a technique used to carefully map threedimensional geological structures such as faults, folds, joints, deformation bands and deformed sedimentary strata at Chimney Rock, central Utah, using the differential global positioning system. We show that this method is an ef®cient and precise way to capture three-dimensional quantitative observations in the ®eld, store the data digitally, and prepare geologic maps, stratigraphic logs, and structure contour maps. Moreover, we aim to demonstrate the signi®cant advantages over traditional geologic ®eld mapping methods and we suggest that methods such as these will become part of the standard tools for the ®eld geologist in the 21st century. Our goal, in accurately mapping the Chimney Rock fault
0191-8141/01/$ - see front matter q 2001 Elsevier Science Ltd. All rights reserved. PII: S 0191-814 1(00)00142-5
586
L. Maerten et al. / Journal of Structural Geology 23 (2001) 585±592
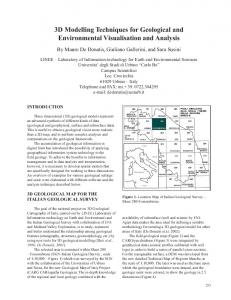
Fig. 1. Landsat image of central Utah showing the San Rafael Swell, the Chimney Rock fault array, the faults (black lines), and contours of the structure (yellow lines) drawn at interval of 300 m on top of the upper Triassic Chinle Formation (sea-level datum). Modi®ed from Baker (1935). Image courtesy of Atilla Aydin.
system, was to compare quantitative ®eld observations with the results of numerical modeling based on continuum mechanics. These comparisons enabled us to evaluate the mechanical interaction among contemporaneous intersecting normal faults in terms of their slip distributions and directions (Maerten and Pollard, 1997; Maerten et al., 1999). 2. Geological overview The Chimney Rock fault system occupies the gently ¯exed strata near the northern part of the San Rafael
Swell crest, central Utah. The swell is one of several Laramide uplifts in the Colorado Plateau province (Kelley, 1955), with a characteristic kidney shape in map view (Fig. 1). The gently dipping west ¯ank contrasts with a steep to vertical monocline bounding the east side. Although this asymmetric pro®le suggests that a major reverse fault may underlie the layered Phanerozoic cover sequence, a COCORP pro®le across the San Rafael Swell revealed folded basement and no re¯ection associated with the fault, at least at shallow levels (Allimendinger et al., 1986). Most of the faults at Chimney Rock are exposed as
L. Maerten et al. / Journal of Structural Geology 23 (2001) 585±592
587
Fig. 2. Detail of the fault pattern of the Chimney Rock area with the structure contour map of the mapped limestone layer (see Fig. 3) colored according to elevation. Black lines are faults dipping to the north and red lines are faults dipping to the south. Dashed lines are the inferred horizontal extent of the faults. Coordinates are UTM (zone 12 north), elevations are in meters above mean sea level, and contour interval is 10 m.
fault-line scarps and crop out in a region of about 25 km 2. Many of the faults can be traced from tip to tip, or from tip to intersection with other faults (see Fig. 2). Both the larger normal faults, with up to 38 m of dip-slip, and the smaller faults intersect each other to form a systematic pattern with orthorhombic symmetry, comprising four dominant sets: a pair striking west±northwest with one set dipping to the northeast and the other to the southeast; and a pair striking east±northeast with one set dipping northwest and the other dipping to the southeast. The 15 largest faults, traceable along the strike for 1±6 km, and the 30 to 40 lesser faults
displace the Jurassic Navajo Sandstone, a well-sorted, highly porous aeolian sandstone, and the overlying Carmel Formation, a Middle Jurassic thinly bedded limestone, siltstone and mudstone sequence (see Fig. 3). Faults exposed in the Navajo Sandstone present well-preserved slickensides with abundant polish and striations (Petit, 1987). The nearly complete exposure permits accurate measurements of fault striation orientations. The basal part of the Carmel Formation consists of beds of resistant limestone interbedded with shaley marls (see Fig. 3). Bedding is laterally continuous and thus provides the marker horizons that were used to
588
L. Maerten et al. / Journal of Structural Geology 23 (2001) 585±592 Table 1 Example of data dictionary used with GPS Features
Attributes
Options a
Layer (point)
Type Strike Dip Dip direction Comments Type Comments Strike Dip Dip direction Rake Surface quality Fault size Fault offset Faulted layer Comments Fault size Fault offset Faulted layer Comments ¼
C1, C2, C3 or Nav 0±1808 0±908 North, South, East or West
Layer (line) Fault (point)
Fault (line)
¼
C1, C2, C3 or Nav 0±1808 0±908 North, South, East or West 0±1808 Good, medium or poor Large, small or unknown 0±100 m C1, C2, C3, Nav or unknown Large, small or unknown 0±100 m C1, C2, C3, Nav or unknown ¼
a
C1, C2 and C3 relate to different stratigraphic markers in the Carmel Formation and Nav to the top Navajo Sandstone. Fault surface quality relates to the area exhibiting slickensides (good .1 m 2, medium 0.5± 1 m 2, and poor ,0.5 m 2). Large fault refers to one of the faults mapped by Krantz (1988) and small fault refers to the other faults. Unknown was used where the classi®cation was ambiguous.
3. Digital ®eld mapping Fig. 3. Detailed stratigraphic section of the basal section of the Jurassic Carmel Formation. Dashed horizontal line is the top of the mapped limestone layer.
tightly constrain the fault offsets and fault block deformation. The orthorhombic geometry of the Chimney Rock fault system is what originally inspired the work by Krantz (1988), following the early publications on orthorhombic systems (Oertel, 1965; Aydin and Reches, 1982) and three-dimensional strain by Reches (1983). Krantz's kinematic analysis of the faults at Chimney Rock is in agreement with four sets of faults developed contemporaneously in a three-dimensional strain ®eld, with a vertical contractional strain, an intermediate extensional strain oriented east± west, and the greatest extensional strain oriented north± south. Other projects have taken advantage of the exceptional fault exposures at Chimney Rock. Power (1988) studied fault surface roughness there, and Cowie and Shipton (1998) analyzed the slip pro®le along one of the main faults and relate the linear slip gradients at the fault tips to a positive stress feedback between sequential slip increments. Their work has also become part of the consortium effort lead by J. Evans at Utah State University to drill and core through one of the faults (Evans et al., submitted; Shipton and Cowie, submitted).
We used the ProXL Systeme, GPS equipment made by Trimble Navigation Limited, to collect the data in the ®eld. The ProXL is a portable GPS system that uses differential corrections to achieve submeter precision. The receiver and the antenna ®t in a small and light backpack. The hand-held data collector (TDC1e), a small computer that runs the Asset Surveyore software, is used to communicate with the GPS receiver, and to input, store, and transfer the collected data. We used the PathFinder Of®cee software installed on a portable personal computer to create and manipulate, on site, the data dictionary, to visualize the data, to process the data through differential corrections and to export the data. The project began with the air photograph interpretation of the area in order to help locate the main structures. Later, these photographs were used as a guide in the ®eld for ef®cient mapping. An electronic image of the air photograph was used as a reference in the Trimble PathFinder Of®cee software to check the daily work superimposing the corrected data. A speci®c template, called a data dictionary, was created and imported into the TDC1 to facilitate data collection in the ®eld (see Table 1). The data dictionary permits one to divide the geologic structures into standard GIS features such as point, line or area, to which one or more attributes can be assigned. Different types of attributes can be used to
L. Maerten et al. / Journal of Structural Geology 23 (2001) 585±592
589
associate any measurement or observation in the ®eld with the location of the geological structure. These can be a menu attribute, where a single value is selected from a list of possible values. For example, measurement of fault dip direction can be separated into north, east, south or west. Numerical attributes included values of the strike of a joint set or the dip of a fault plane. Text attributes allow descriptive information to be recorded. The creation of an appropriate data dictionary is a critical step for any ®eld mapping project. It has to be done with respect to the characteristics of the geological structures that one intends to map. It also conditions how the data are going to be collected and later stored in the database. Moreover, it has to be created with regard to the way in which the data are going to be analyzed. For instance, when dealing with fault striation rake measurements, we determined that it was important to weight the collected data by a criterion suitable for the use of a paleostress inversion program. For this particular case, we weighted the data by a fault surface quality factor that depends on the area of exposed surface exhibiting slickensides. When the area was more than 1 m 2, the quality was set to good, whereas a medium quality was for areas between 0.5 m 2 and 1 m 2, and a poor quality was for areas less than 0.5 m 2. Table 1 is part of the data dictionary created for the present project. It shows the attributes and options for the fault and layer features among other geological features, such as deformation bands, folds and joints, that are not represented. The data capture strategy consisted of walking along the main faults, and along a resistant limestone layer, which crops out almost everywhere along the edges of the gullies. A line feature, recording the UTM coordinates and elevation every 5 sec was used to map the layer while walking. When exposed, the contact between the Navajo and Carmel was also mapped, as well as other signi®cant stratigraphic markers within the Carmel Formation. Information on every minor fault and fold encountered was collected. Data on joints and deformation bands were collected occasionally. Where layers were substantially folded, point features were used to collect the location of the measured strike, dip angle and dip direction of the layer. Mapping of the major faults was done by using point features to collect the location of measured fault strike, dip angle, dip Fig. 4. Data visualization and interpretation. (a) Three-dimensional view of the collected data using GPS. Yellow dots are the recorded UTM coordinates and elevation of the mapped resistant limestone layer within the Carmel Formation. Red dots are the location of fault measurements. Vertical exaggeration is 8 £ . The area is the same as part (d) for scale. (b) Threedimensional model of the major faults (transparent blue) using measurement (red dots) of fault location, fault strike, and fault dip. Vertical exaggeration is 8 £ . (c) Three-dimensional view of the interpolated surface of the structure using recorded x, y and z co-ordinates (yellow dots) of the mapped limestone layer. Vertical exaggeration is 8 £ . (d) Three-dimensional structure contour map of the limestone layer colored according to elevation. Contour interval is 10 m. Vertically dashed blue surfaces indicate fault gaps at the mapped layer. Vertical exaggeration is 8 £ .
590
L. Maerten et al. / Journal of Structural Geology 23 (2001) 585±592
S-W
(a)
(b)
60o
N-E
50
70o
40
80o
30
90o -80o
20 ?
Fig. 7
10 0 3000
-70o
Slickenside rake (degrees)
Dip-slip (meters)
60
-60o 2500 2000 1500 1000 500 Distance from eastern tip of fault (meters)
0
Fig. 5. Calculated dip-slip distribution and measured striation rake along the Blueberry fault (see Figs. 2 and 3 for location). Dashed lines represent the location of intersection (named (a) and (b) to compare with Fig. 6) with two nearby major faults. To show that a slip vector is in the opposite direction to the strike (right hand rule), we used a value of the rake between 90 and 1808. 908 is pure dip-slip and 08/1808 is pure strike-slip.
direction, striation rake, fault quality, estimated fault offset and other fault related information (e.g. Table 1). Where the fault zones were complex with overlapping segments or when striations were not visible, a line feature was used to record the geometry of the fault traces. A total of 15 days was necessary for one person to map the geological features over the entire 20 km 2 of the Chimney Rock area. 14,863 points were collected to characterize the structure of the stratigraphic markers, 573 points to characterize the faults (e.g. strike, dip and rake), and 1768 points for fault traces. All of the collected coordinate data were improved to reach the submeter precision by comparing the locations with that of a ®xed base station (i.e. differential correction) located in Price, Utah, about 50 km away from the Chimney Rock. 4. Data analysis The data (Fig. 4a) were analyzed in the of®ce using gOcad, a three-dimensional surface interpolator developed at the National School of Geology, Nancy, France. Prior to the analysis, the fault and layer data were transferred from the Trimble PathFinder Of®cee software to gOcad using an internal export module. The fault surfaces were constructed in three-dimension including constraints provided by the measured strikes and dips (see Fig. 4b). Because data on the geometry of the faults were limited to only a few tens of meters of the stratigraphic section, their vertical extent was approximated and their shape idealized for the purpose of modeling. The surface reconstruction of the chosen limestone layer was done in three steps. First, the data points were subdivided into blocks bounded by the major faults. Within each block, precise stratigraphic logs of the lower Carmel Formation (see Fig. 3), measured in the ®eld throughout the area, were used to interpolate the elevation of the limestone layer where it did not crop out. Second, a three-dimensional surface was created for each block, by interpolating between
the data points (Fig. 4c). The surfaces were made of triangular elements with sizes chosen to re¯ect the level of detail. The strike and dip of the layer measured in the ®eld also were used to constrain the surface interpolation. The third and last step consisted of cutting the surface of each block by the bounding faults, or of extrapolating the surfaces to touch the fault surfaces. Fig. 4d shows the ®nal surface, colored according to the elevation, and the fault gaps (dashed blue surfaces). Slip distributions along each fault were calculated with gOcad using the elevation separation between the hanging wall and the footwall cutoffs and the local dip of the fault plane. The slip vector (measured striation rake), or its dip component, was used depending upon whether we were interested in the net-slip distribution, or the dip-slip distribution. Fig. 5 represents the dip-slip distribution and the measured striation rake (for surface quality good) along the Blueberry fault (see Fig. 4d). These detailed, quantitative ®eld observations show slip gradients and asymmetric slip distributions along the fault where a major intersecting fault (dashed vertical lines) is met. Similarly, the rake of the measured striations varies along the fault, especially as the intersection line with adjacent faults is approached. The characteristics of the variation in fault slip distribution and slip direction are similar to those computed using idealized numerical models (see Fig. 6, after Maerten and Pollard, 1997). The models show that signi®cant slip gradients away from fault tip lines and asymmetric slip distributions, commonly observed on intersecting faults, can be caused by mechanical interaction (Maerten et al., 1999). Likewise, the variation of slip direction over a single fault surface, especially near fault intersections, can also be ascribed to fault interaction. Maerten (2000) suggests, from numerical analysis and ®eld observations at Chimney Rock, that mechanical interaction between faults produces deviation from both the symmetric slip distribution and the expected constant slip vector on individual fault surfaces in response to a homogeneous remote stress ®eld. This mechanical interaction is attributed, at least in part, to
L. Maerten et al. / Journal of Structural Geology 23 (2001) 585±592
(a)
fault
(b)
A
fault 1.5
(a)
fault A
50o
1
A
fault A
(b)
50o
1 70o
0.5
90o
0
70o
0.5
90o
0
-70o
-1
-0.5 0 0.5 Distance from intersection
1
Rake (degrees)
Normalized dip-slip
1.5
591
-70o
-1
-0.5 0 0.5 Distance from intersection
1
Fig. 6. Computed slip distribution and slip vector along fault A for two different fault intersection patterns (a) and (b) studied along the Blueberry fault. The top ®gures show the model con®gurations and the bottom diagrams are the model results. Black circles dots are dip-slip distribution and gray squares are slip direction distribution. Vertical dashed lines are intersections with other major faults (modi®ed from Maerten and Pollard, 1997).
elastic deformation that modi®es the local shear stress acting on one fault as induced by slip on the other fault. The good correspondence between slip characteristics along the major faults at Chimney Rock and theoretical results (Maerten, 2000), not only provides insight into the mechanics of intersecting faults, but suggests that care is required when using standard inverse methods to compute paleostresses from slickenline data. The slickenline orientation near intersection lines will generally not be in the direction of the remote maximum shear stress as resolved on the fault plane. The technique used to collect data and calculate slip distributions along the faults has been compared with the technique used by Cowie and Shipton (1998) in Fig. 7. They used a Topcon total station, which gives x, y and z coordinates of a re¯ector relative to the instrument to survey the Navajo±Carmel boundary and stratigraphic markers in the Carmel Formation with centimeter to decimeter accuracy. 10 9
TS-C&S (top S)
8
TS-C&S (base F)
Dip-slip (meters)
TS-C&S (top Navajo)
7
GPS-M&P (Carmel1)
6 5 4 3 2
Vertical resolution = ±0.5m
1 0 500
400 300 200 100 Distance from eastern tip of fault (meters)
0
Fig. 7. Comparison of dip-slip pro®les from the eastern tip of the Blueberry fault measured with a total station (TS) by Cowie and Shipton (1998) and with the global positioning system (GPS) as described in this paper. See location on Fig. 5.
Then, by extrapolating the mapped layers, approximated by planar surfaces dipping ~48 to the east, they calculated the dip-slip distribution along the ®rst 500 m of the Blueberry fault from its eastern tip. Fig. 7 shows the dip-slip distribution along the Blueberry fault obtained with the two techniques and demonstrates that similar results are achieved within about 1 m precision. 5. Conclusions Considerable progress has been made in Earth Sciences by both the development of three-dimensional numerical models and the advance of three-dimensional graphics technology. Thus, accurately ªdigitizingº geological structures (sub-meter precision) in a natural setting, is becoming an essential part for any ®eld investigation, and the need for accuracy in measuring the location of the collected data and, generally, a three-dimensional perspective is indispensable. In this contribution we have aimed to demonstrate the signi®cant advantages of using tools such as GPS over traditional methods, such as mapping on a topographic-based map. The method is an ef®cient way, for one person, to collect and digitize ®eld observations and measurements and their precise spatial location. The data can be stored in a database and then exported for further analysis. On site, improvements could easily be made by using software or Java scripts and a portable computer to form threedimensional images of the collected data of the day, and thus begin the task of understanding the structure of the area, interpret the data, and plan the next day of ®eld work. We suggest that methods such as these will become part of the standard tools for the ®eld geologist in the 21st century. Acknowledgements This work was carried out under the sponsorship of the
592
L. Maerten et al. / Journal of Structural Geology 23 (2001) 585±592
Stanford Rock Fracture Project and a McGee grant from the Department of Geological and Environmental Sciences covered the ®eld expenses. We thank Robert Krantz who provided useful information about the Chimney Rock area and a review of the manuscript, Taixu Bai for his companionship and help in the ®eld, and Isabelle Duvinage for helping us with gOcad. Finally, we thank Bruce Trudgill and Jim Evans for reviewing the manuscript. References Allimendinger, R.W., Farmer, H., Hauser, E., Sharp, J., Von Tish, D., Oliver, J., Kaufman, S., 1986. Phanerozoic tectonics of the Basin and Range-Colorado Plateau transition from COCORP data and geologic data. A review. In: Barazangi, M., Brown, L. (Eds.). Re¯ection Seismology: The Continental Crust. 14. American Geophysical Union Geodynamics Series, pp. 257±268. Aydin, A., Reches, Z., 1982. Number and orientation of fault sets in the ®eld and in experiments. Geology 10, 107±112. Baker, A.A., 1935. Geologic structure of southeastern Utah. AAPG Bulletin 19, 1472±1507. Cowie, P.A., Shipton, Z.K., 1998. Fault tip displacement gradients and process zone dimensions. Journal of Structural Geology 20, 983±997.
Kelley, V.C., 1955. Monoclines of the Colorado Plateau. Geological Society of America Bulletin 66, 789±804. Krantz, W.R., 1988. Multiple fault sets and three-dimensional strain: theory and application. Journal of Structural Geology 10, 225±237. Maerten, L., 2000. Variation in slip on intersecting normal faults: Implication for paleostress inversion. Journal of Geophysical Research 105, 25553±25565. Maerten, L., Pollard, D.D., 1997. Fault slip characteristics near fault intersection lines: numerical modeling and ®eld observations. Fall Meeting American Geophysical Union 78, F702. Maerten, L., Willemse, M.J., Pollard, D.D., Rawnsley, K., 1999. Slip distributions on intersecting normal faults. Journal of Structural Geology 21, 259±271. Oertel, G., 1965. The mechanism of faulting in clay experiments. Tectonophysics 2, 343±393. Oreskes, N., Shrader-Frechette, K., Belitz, K., 1994. Veri®cation, validation, and con®rmation of numerical models in the Earth Sciences. Science 263, 641±646. Petit, J.-P., 1987. Criteria for the sense of movement on fault surfaces in brittle rocks. Journal of Structural Geology 9, 597±608. Power, W.L., 1988. Roughness and wear during brittle faulting. Journal of Geophysical Research 93, 15268±15278. Reches, Z., 1983. Faulting of rocks in three-dimensional strain ®elds. II: Theoretical analysis. Tectonophysics 95, 133±156.