SPECIAL R o c k SECTION: p h y s i R c s o c k
P h y s i c s p
Digital rock physics: 3D imaging of core material and correlations to acoustic and flow properties MARK A. KNACKSTEDT, SHANE LATHAM, MAHYAR MADADI, ADRIAN SHEPPARD, and TROND VARSLOT, Australian National University CHRISTOPH ARNS, University of New South Wales
3
D X-ray microtomographic imaging and visualization of core material at the pore scale and subsequent analysis of petrophysical properties can give important insight to understanding properties of reservoir core material. 3D images allow one to map in detail the pore and grain structure and interconnectivity of core material. Numerical calculations on image data are in agreement with experimental data for flow and elastic properties on simple core material. This development forms the basis for developing more meaningful structure property correlations in rock. In this paper we discuss the further development of this emerging technology to complex clastic and carbonate reservoir core. In particular we describe the coupling of 3D imaging data to more conventional petrographic analysis; this allows one to incorporate fabric and mineralogy information from thin section studies into 3D data and to probe the pore scale structure in reservoir core in 3D from nanometers to centimeter scales. Results of the analysis allow one to better understand reasons for scatter in elastic and other petrophysical data in terms of rock type, pore structure, texture and interconnectivity. Examples for clastic and carbonate reservoir cores are discussed. Background The elastic and flow properties of porous sedimentary rocks are determined by the properties and microgeometry of constituents. Complete description of the microgeometry includes information about shapes, sizes, mutual positions, connectivity, etc., of the pore and granular phases. Relevant properties for elastic properties include information on the granular mineral phase composition and micromechanics of the grain contacts. Flow properties are primarily determined by the size, shape and connectivity of the pore phase. Conventional methods for analyzing the pore and grain structure of rock material (e.g., mercury injection, sieving, petrographic thin section) have limitations in quantitatively describing the full 3D granular and porous microstructure. Recent developments in microtomographic imaging coupled with conventional petrographical analysis allow one to directly measure rock fabric and texture, grain contacts and the pore structure of rocks in 3D. This ability, coupled with the numerical predictions of elastic and flow properties on the resultant digitized images, have shown that a range of petrophysical properties of porous rocks can be derived directly from 3D images (Arns et al., 2005). This development allows a new numerical approach to the study of reservoir core which should allow one to better understand the correlations between microstructure and the physical properties of porous rocks. Micro-CT imaging is capable of acquiring 3D images of 260
The Leading Edge
January 2009
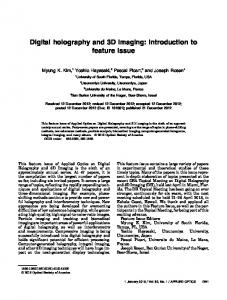
Figure 1. (a) Slice from tomographic image of a clean sandstone sample. This slice is identified from within the 3D image as optimally matching the SEM image of the same rock shown in (b). (c) Shows the phase partitioning of the image in (a) into pore (black), solid grain (white) and clay (grey) regions. (d) Illustrates a colour map with the grain partitioning of the white phase in (c). The grain partitioning of the 3D image is visually similar to grain boundaries observed in the thin section in (b). (e) Gives a representation of the topology and geometry of a subset of sandstone pore structure in 3D based on a pore network representation. (f ) Shows the pore and throat size distributions measured directly from the image data.
the pore structure of sedimentary rock with resolutions down to the micron scale. In Figure 1, we give an example of a slice through a 3D tomographic image of a sandstone sample of 5 mm in diameter. The sample was imaged at resolution of 2.8 microns per voxel to produce the resultant image composed of 20483 (> 8 billion) voxels. To illustrate the quality of the 3D image data, thin sections are prepared from within the volume imaged by micro-CT; the thin sections are then imaged via SEM and optical microscopy. In Figure 1, we give the example of an SEM image of a thin section of the same slice of the tomogram shown in Figure 1 imaged at a scale of
R o c k
p h y s i c s
1995; Auzerias et al. 1996; Arns et al., 2002, 2005) have illustrated the feasibility of combining digitized images with numerical calculations to predict petrophysical properties of porous rocks. From images of the pore space one can make predictions of permeability, resistivity and drainage capillary pressure. As an example for the sample shown in Figure 1 the permeability derived from the image was 240mD; this data compares favorably to the experimentally derived value of 160 mD. From pore and grain phase information (including mineralogy) acoustic, NMR response and multiphase flow properties can also be probed. Results to date have shown the feasibility of combining digitized images with numerical calculations to predict petrophysical properties of homogeneous core material. In this paper we discuss the ongoing challenge to improve predictive capabilities of the method to more complex samFigure 2. (a) 3D image of a lightly sintered monodisperse grain pack imaged via ples and to extend the methodology to a wider microtomography. (b–c) 2D slices of the 3D image with sintering via growth of the solid phase at the grain boundaries (φ =34% and 27% respectively). The images are range of properties. We first discuss the use of a similar to the SEM images of sintered monodisperse glass beads shown in Figure 2 of digital technique to predict the acoustic response Berge et al., 1995. The comparison of the numerical simulation of (d) bulk (K) and of sandstones; we illustrate the ability to predict (e) shear (G) modulus of the model sintered glass bead packs to data of Berge et al., the elastic properties of simple (idealized) granu1995. The simulation data is in excellent agreement. lar materials and then show the need to integrate the digital rock physics methods with higher (~3500)2 with 1.3 micron pixels. The visual match of the SEM resolution image data and petrographical information to esimage to the tomographic slice is excellent. This illustrates the timate acoustic properties of reservoir sands. We then discuss ability of micro-CT to accurately quantify the 3D pore-space the prediction of acoustic response of carbonate samples. The structure of reservoir core at the 2–3 micron scale. heterogeneity of carbonates requires one to probe structure From the X-ray image (attenuation map) one can separate at scales from ten of nanometers to centimeters; methods to the voxels into distinct pore and mineral phases. In Figure 1, do this are described. The importance of incorporating pore we show a slice of the phase separation of the 3D image into level details at multiple scales are then illustrated for a set of grains, clay, and the pore phase. From the phase separated oomoldic samples. images descriptions of rock fabric and texture and pore scale structure and topology can be made. Textural descriptions, Acoustic properties of clastics Prediction of elastic properties of idealized sintered granular traditionally obtained via 2D petrographic analysis, are directly measured on 3D digital images of core material (Saa- media. We first illustrate the ability to predict elastic propdatfar et al., 2006). An example of the grain partitioning of erties directly from 3D image data by comparing numerical the sandstone sample is given in Figure 1. Visual comparison simulations on images of sintered glass sphere packs. Four of the digital grain partitioning to the thin section image is images of a lightly sintered monodisperse sphere pack are good. Moreover, one can obtain comprehensive grain shape obtained via microtomography. The porosity of the original data; over 100 000 grains are directly identified in a typical packs varied from 36–41% (Figure 2). Sintering of this 3D 3D image and a number of petrological grain descriptors can packing of particles is then numerically simulated by growth be obtained (e.g., grain shape, contact areas, grain orienta- of the solid phase at the grain/pore interface into the pore. A microstructure defined by a digital image is already discretized tion) in 3D. Pore network descriptions can also be derived by parti- allowing one to directly perform numerical computation of tioning of the pore space within the tomographic images. any number of properties. A finite element method (FEM) This partitioning allows one to quantify the complex geomet- is used to estimate the elastic properties (Arns et al., 2002). rical and topological properties of the pore space; connectiv- FEM uses a variational formulation of the linear elastic equaity, shape and sizes of pore bodies and pore interconnections tions and finds the solution by minimizing the elastic energy. can be derived directly. An example of the 3D pore network Each voxel in the digital image is taken to be a trilinear finite for the sandstone sample is illustrated in Figure 1. The pore element. A strain is applied, with the average stress or elastic body and pore throat or pore constriction size distribution for energy giving the effective elastic modulus. Simulations are over 300,000 pore elements within the 3D image are given undertaken on grid sizes of up to (1200)3. The structure of the bead pack is reminiscent of the synin Figure 1. A number of papers (Adler et al., 1992; Fredrich et al. thetic sandstones described in Berge et al., 1995. Simulations January 2009
The Leading Edge
261
R o c k
p h y s i c s
Figure 3. (a) Subsection of an SEM image of reservoir sand; quartz, feldspar, authigenic and detrital clays are evident in the small section. The image size shown is 940×768 and the pixel size is 1.25 microns. (b) shows the registered slice from the tomogram with a voxel size of 2.8 microns. The grain contacts obtained from the tomographic image are shown by the coloured lines in the image. (c) Illustrates the phase separation of the slice in (b) based on X-ray attenuation information alone for the granular (red), pore (black) and clay (green) phases. The mapping of mineralogy, clay distribution and grain contact information from quantitative petrographic studies of the thin section onto the tomographic data will assist in developing more realistic acoustic modeling studies. (d) Gives the bulk modulus: porosity relationship for a simple sandstone data assuming perfect cementation between grains (circles) and a weaker (60% of perfect) grain contact stiffness (squares).
of the elastic properties are undertaken on the image data (Kglass=46.1 GPa, Gglass=29.1 GPa) across a range of porosities with the grains assumed to be perfectly cemented. We compare the predictions of the modulus-porosity relationships obtained from the image data and simulation to the Berge et al., 1995 experimental data set in Figure 2. The simulation results for the bead cementation model are in excellent agreement with experiment across the full range of porosity. This illustrates that numerical simulation of elastic properties on image data where the elastic contact modulus is accurately estimated leads to a good match to experiment. Elastic simulation data from 3D images of Fontainebleau sandstone (well sorted and well cemented quartz sand) assuming well cemented grains has also previously been shown (Arns et al., 2002) to give reasonable agreement with experimental data. Prediction of elastic properties of reservoir core. While the assumption of perfect cementation may be appropriate for sintered granular packs and ideal clay free sands, recent studies by Kittridge et al. (2004, 2006) have shown that these idealized data sets are not appropriate geological analogs for many reservoir sandstone samples. These studies, which summarize an extensive range of public domain laboratory-based elastic data sets, have shown that real sandstones tend to be much weaker than the idealized media. This behavior can be more appropriately modeled by incorporating realistic (weaker) micromechanical properties at the grain contacts. To in262
The Leading Edge
January 2009
corporate direct experimental measurement of grain contact stiffness remains extremely difficult. However, the analysis of 3D image data coupled with detailed petrographical evaluation may allow a more robust evaluation of acoustic properties of sandstones. Figure 3 shows an SEM slice of a more complex reservoir sandstone and the registered slice from the 3D tomographic data. Quantitative petrography allows one to incorporate fabric and mineralogical information from thin section; mineralogy, mineralogy of contact points as well as grain size and shape information and location of grain contacts are quantified. Geometrical quantities can be directly compared to the grain partitioning of the 3D image data. The ability to directly couple 3D image and 2D SEM data will allow one to populate individual grain contacts in the 3D image with appropriate grain contact stiffnesses. The inclusion of realistic contact mineralogy and frequency can then be used to understand velocity variations in different sands. To illustrate the role of weaker micromechanical properties at grain contacts we simulate data for the modulus:porosity relationship for a simple Fontainebleau sandstone data assuming firstly perfect grain cementation and secondly a weaker grain contact stiffness. Individual grains and grain:grain contacts throughout the 3D image are identified (see examples in Figures 1 and 3). In the first case, the perfect cementation model, the contacts are assumed to have the same modulus as the grains. In the second case the grain contacts are assigned a weaker stiffness than the grains; we assign 60% of the grain modulus at the grain:grain contacts. The latter case gives a significantly weaker modulus:porosity relationship; this is consistent with modulus:porosity characteristics for reservoir core (Kittridge et al., 2004). Acoustic properties of carbonates The heterogeneity of carbonate reservoirs at multiple scales makes it extremely difficult to characterize these reservoirs. This heterogeneity leads to complicated relations between porosity, acoustic properties and permeability. Anselmetti and Eberli (2003) illustrated that carbonates exhibit poorly defined velocity porosity trends with deviations from general correlation trends as high as 2500 m/s observed. The description of the pore and solid phases in carbonate rocks remains challenging; extreme variability in carbonate depositional environments and susceptibility to a range of postdepositional processes results in complex pore and grain structures comprising length scales from tens of nanometers to several centimeters. Combining experimental techniques including micro-computed tomography, backscattered scanning electron microscopy (BSEM), and Focussed ion beam SEM (FIBSEM) allows one to directly probe the pore scale structure in carbonates in a continuous range across over six decades of length scales (from nm to cm scales). Characterization of carbonate structure at multiple scales. In Figure 4 we show an SEM slice of a thin section of a limestone sample (1.25 microns per pixel); the registered tomographic slice is also shown (2.8 microns per voxel). The porosity resolved directly in the images is 2000 m/s) scatter in the experimental velocity-porosity relationship (Baechle et al., 2007) were chosen; half the samples exhibited slower velocities while half were stiffer. Tomographic imaging and analysis was undertaken on the samples to attempt to comprehend the scatter in the data. Initial data is given here. In Figure 5, we show slices of two tomographic images; one fast and one slow velocity sample; both samples exhibit φ~20%. A clear visual difference in the images can be noted; the fast sample exhibits primarily resolved porosity within the image volume, while the slower sample exhibits a significant proportion of porosity below image resolution. Modelling the acoustic properties of the two samples requires one to assign the effective elastic properties of the unresolved or microporous regions. To investigate this, images were obtained of these regions via thin section (Figure 5). The microporous matrix in the slower sample consists primarily of cemented micrite crystals; a structure not unlike a cemented grain pack. Berge et al., 1995 show that the self consistent (SC) theory gives a good estimation of velocities of well cemented granular media. Voxels in the microporous phase are therefore assigned an effective elastic modulus based on SC theory and the overall elastic response of the two samples simulated. Numerical predictions for Vp correlate well with experiment and capture the observed scatter in the data: Fast sample; Vpsim =5834 m/s, Vpexp=5710 m/s; slow sample; Vpsim =4641 m/s, January 2009
The Leading Edge
263
R o c k
p h y s i c s
Vpexp=4326 m/s. Incorporation of the cemented calcite crystal microporous regions within the simulation was crucial in accurately predicting the elastic properties of the samples. Correlating acoustic properties to structure. A range of factors directly influence the elastic moduli of carbonates. Pore shape and the amount of microporosity have been used to correlate elastic moduli of carbonate core (Bächle et al., 2008). 3D imaging studies enable one to directly extract detailed 3D pore scale structure and quantify pore shape parameters directly on pores > 2 micron in size (recall Figure 1). The role of micropores can also be integrated into pore scale descriptions in 3D. These analyses, coupled with numerical simulation on 3D image data and experimental data, should improve our understanding of how the effective elastic properties of carbonate rocks is influenced by pore structure. Conclusions The potential to estimate petrophysical properties from digitized tomographic images of small samples of reservoir core is an exciting development. This development allows for a new numerical approach to the study of reservoir core which should allow one to better understand the correlations between microstructure and the physical properties of porous rocks. Unlike conventional analysis, digital analysis requires only small rock fragments, allowing data to be potentially obtained from side-wall cores, damaged, friable, thinly bedded and unconsolidated samples. In this paper we have discussed the development of this technology to modeling the elastic properties of clastic and carbonate reservoir core. The coupling of 3D imaging data to more conventional petrographic analysis is shown to be crucial to advance the predictive nature of this emerging technology. Suggested reading. “The formation factor of reconstructed porous media” by Adler et al., (Water Resources Research, 1992).
264
The Leading Edge
January 2009
“Quantitative characterization of carbonate pore systems by digital image analysis”by Anselmetti et al. (AAPG Bulletin, 1998). “Computation of linear elastic properties from microtomographic images: Methodology and agreement between theory and experiment” by Arns et al. (Geophysics, 2002). “Digital core laboratory: Petrophysical analysis from 3D images” by Arns et al. (Petrophysics, 2005). “Transport in sandstone: A study based on three dimensional microtomography” by Auzerias et al., (Geophysical Research Letters, 1996). “Oomoldic carbonates: pore structure and fluid effects on sonic velocity” by Baechle et al. (SEG 2007 Extended Abstracts). “Effects of microporosity on sonic velocity in carbonate rocks” by Bächle et al., (TLE, 2008). “Ultrasonic velocity-porosity relationships for sandstone analogs made from fused glass beads” by Berge et al. (Geophysics, 1995). “Imaging the pore structure of geomaterials” by Fredrich et al., (Science, 1995). “Geologically-consistent rock physics modeling for sandstones: Modulus-based prediction of in situ elastic properties” by Kittridge et al. (EAGE 66th Conference & Exhibition, 2004). “Modulus-domain rock physics diagnostics: New Insights in Realistic granular media” by Kittridge (SEG 2006 Extended Abstracts). “Probing pore systems in carbonates: Correlations to petrophysical properties” by Knackstedt et al. (SPWLA 49th Annual Logging Symposium, 2008). “Rock fabric and texture from digital core analysis” by Saadatfar et al. (SPWLA 46th Annual Logging Symposium, 2005). Acknowledgments: We acknowledge collaborations and discussions with Gregor Bächle, Gregor Eberli, Klaas Verwer, Mark Kittridge, and Lori Hathon on parts of this work. We thank the sponsors of the Digital Core Consortium (ADCO, Baker Hughes, BHP, BP, Chevron, ExxonMobil, JOGMEC, Maersk, Saudi Aramco, Schlumberger, Shell, Total) for their continued support of this research. Corresponding author:
[email protected]