Digital Signal Processing for Gene Prediction. Vikrant Tomar, Dipesh Gandhi, C. Vijaykumar. Dhirubhai Ambani Institute of Information and Communication ...
1
Digital Signal Processing for Gene Prediction Vikrant Tomar, Dipesh Gandhi, C. Vijaykumar Dhirubhai Ambani Institute of Information and Communication Technology (DA-IICT) Gandhinagar, Gujarat, India e-mail: {vikrant tomar, dipesh gandhi, vijaykumar chakka}@daiict.ac.in
Abstract—Identification of gene locations in a DNA sequence is one of the important problems in the area of genomics. Nucleotides in exons of a DNA sequence show f = 1/3 periodicity. The period-3 property in exons of eukaryotic gene sequences enables signal processing based time-domain and frequencydomain methods to predict these regions. Identification of the period-3 regions helps in predicting the gene locations within the billions long DNA sequence of eukaryotic cells. Existing nonparametric filtering techniques are less effective in detecting small exons. This paper presents a Harmonic Suppression filter and parametric Minimum Variance Spectrum estimation technique for gene prediction. We show that both the filtering techniques are able to detect smaller exon regions and adaptive MV filter minimizes the power in introns (non-coding regions) giving more suppression to the intron regions. Furthermore, 2-simplex mapping is used to reduce the computational complexity. Index Terms—DNA, gene prediction, 3-periodicity, sliding window DFT, antinotch filter, harmonic suppression filter, Minimum Variance spectrum estimation technique.
I. I NTRODUCTION Genomic information is digital in a very real sense; it is represented in the form of sequences of which each element can be one out of a finite number of entities. Such sequences, like DNA and proteins, have been represented by character strings, in which each character is a letter of an alphabet. In case of DNA, the alphabet is of size 4 and consists of the letters A, T, C and G. For example ...ATCGCTGATAGGATGGTTAACC... For proteins, the size of the corresponding alphabet is 20. The required background in Biology i.e., definitions of terms like DNA sequences, genes, exons, protein-coding (which feature repeatedly in this document) can be found in [3], [5], [10], [9]. ‘Gene Prediction’ refers to detecting locations of the protein-coding regions (exons) of genes in a long DNA sequence. The problem constitutes one of the first steps in understanding life processes. For most prokaryotic DNA sequences, the problem is to determine which ORFs, in the given sequence, are really coding sequences coding for proteins. For eukaryotic DNA sequences, the problem is to determine how many exons and introns (non-coding regions) are there in the given sequence and what are the exact boundaries between the exons and introns. For the last few decades, the major thrust of DNA and protein analysis, has been on string matching, either with a goal of obtaining a precise solution, e.g., with dynamic programming, or more commonly a fast solution, e.g., with heuristic techniques such as BLAST and several versions
of FAST [11]. But any of the string matching methodologies could not lead to satisfactory results [4], [5], [6]. Signal processing techniques offer a great promise in analyzing genomic data because of its digital nature. However, signal processing analysis of bio-molecular sequences is hindered by their representation as strings of characters. If numerical values are assigned to these characters, the resulting numerical sequences are readily amenable to digital signal processing. A Brief Background: For most of DNA sequences, one of the principal features is the periodic 3-nucleotide pattern which has been known phenomenon for eukaryotic exons [14], [21]. DNA periodicity in exons is determined by codon usage frequencies. This periodicity reflects correlations between nucleotide positions along coding sequences which is caused by the asymmetry in base composition at the three coding positions [15]. There has been a great deal of work done in applying signal processing and statistics methods to DNA recently. In [2], Tiwari et al. utilized Fourier analysis to detect the probable coding regions in DNA sequences, by computing the amplitude profile of this spectral component which is evidenced as a sharp peak at frequency f = 1/3 in the power spectrum. The strength of the peak depends markedly on the gene [1], [2]. Anastassiou [3], [4] proposed a mapping technique to optimize gene prediction using Fourier analysis and introduced color spectrogram for exon prediction. Although this mapping technique gives comparatively good results than DFT but it is DNA sequence dependent and thus requires computation of the mapping scheme before processing for gene prediction. Rao and Shephard, in [13], assumed the DNA sequence to be generated from a white random process through an all pole system and thus used Auto-Regressive modeling to replace Fourier analysis for exon prediction. To improve the filtering through DFT computation, P.P. Vaidyanathan, in [5], [6], proposed digital resonator (antinotch filter) to extract the period-3 components. Kotlar and Lavner [8] proposed a modification to the DFT-based spectral content measure. They found that the distributions of the DFT phase angle at frequency 2π/3 for coding regions (i.e., exons) are narrower around a center value than those of non-coding regions, which are almost uniform, within genomic sequences of one particular organism. Mahmood Akhtar et al. [17] introduced time domain approaches like Avg. Magnitude Difference Function (AMDF), Time Domain Periodogram (TDP) for gene prediction using smaller frame length. Conclusively, the antinotch filter proposed for gene prediction has been so far most successful in gene prediction. However, all techniques
Proc. Int. Conf. IEEE Tencon 2008
2
mentioned could not attenuate the harmonics of frequency 2π/3 thus giving false estimate of the power spectral density (PSD) of the DNA sequence. Due to the above limitation these methods fail to detect the short and closely spaced exons. In the paper we propose techniques to suppress these harmonic frequencies. For comparison purpose, throughout this paper the commonly used sequence ‘F56F11.4’ (indices 2858700-2865376) from ‘Chromosome III’ of the organism ‘C.elegans’(Accession Number AF 099922 [19], [20]) is used having five exons, as shown in Table I.
III. P ROPOSED H ARMONIC S UPPRESSION F ILTER The antinotch filter, proposed by Vaidyanathan in [5], [6] also passes the harmonics of the frequency 2π/3 along with the 2π/3 frequency components. These harmonic frequencies contributes towards the peak strength in exons and introns, giving false measure of the 3-periodicity in output. Thus notches at these frequencies are needed to suppress the harmonics. For this purpose, a Harmonics Suppression (HS) filter having
TABLE I E XON
LOCATIONS IN CHROMOSOME
exon # 1 2 3 4 5
Start location 1000 2600 4186 5537 7327
III OF C. ELEGANS
End location 1111 2929 4449 5716 7677
The mapping of nucleotide character string onto number sequence is discussed in section II. Section III explains the proposed Harmonic suppression filter followed by MV spectrum estimation technique in section IV. Qualitative comparison of existing and proposed techniques is done in section V and finally section VI concludes the paper.
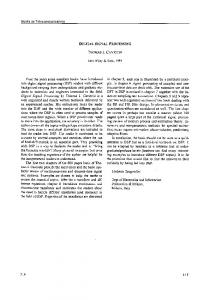
Fig. 1. plot.
(a) Magnitude of frequency response of HS filter, and (b) pole-zero
II. R EPRESENTATION OF DNA S EQUENCE AS S IGNAL The simplest form of representation of DNA sequences is the Fasta representation that uses the alphabet A, C, T, G showing a DNA sequence as a string of characters but to apply signal processing algorithms we need to assign numerical values to these characters. Many rules have been proposed for this purpose, for example, the AA rule, the Voss mapping [12], the hydrogen bond energy (SW) rule, hybrid rules, and so on [3]. A comprehensive study of these mapping functions can be found in [16]. In this paper, newly proposed mapping technique, called 2-simplex mapping, is used which reduces the computational complexity for identifying protein coding regions in the DNA [18]. Simplex is defined as a Euclidean geometric spatial element having the minimum number of boundary points, such as a line segment in one-dimensional space, a triangle in two dimensional space, or a tetrahedron in three-dimensional space. 2-simplex mapping means triangle based mapping. Any of the three bases of A, T, C and G are assigned to the three vertices of an equilateral triangle (whose center is at the origin) and the remaining one is assigned to the origin. The vectors from the origin to each vertex represent three nucleotides and the fourth one is ’0’. For example one such 2-simplex mapping is A = 1ˆ y , C = 0, G = 0.5ˆ x − 0.866ˆ y , T = −0.5ˆ x − 0.866ˆ y. Given the DNA sequence, each symbol is replaced with its associated vector. Now the DNA sequence is a sequence of 2dimensional vectors. Xx , Xy are the two indicator sequences for the 2-simplex mapping, where Xx and Xy represents the collection of x and y components in the above mentioned vector sequence.
dominant zeros at the multiples of frequency 2π/6 except at 2π/3 and dominant pole at 2π/3 is designed which perceptibly suppresses the samples of harmonic frequencies of 2π/3 while allowing the samples of frequency 2π/3 to pass. Fig.1(a) shows the magnitude of frequency response of the proposed HS filter fulfilling the above mentioned criteria on a digital frequency scale of 24 KHz. The peak at 16 KHz is evidence of the pole at angular frequency 2π/3 radians. A pole-zero plot of designed filter is shown in Fig.1(b) having poles of magnitude 0.898, 0.898, 0.998, 0.898 at angular frequencies ω = 0, 2π/6, 2π/3, π radians, respectively, and zeros of magnitude 0.998, 0.998, 0.898, 0.998 at angular frequencies ω = 0, 2π/6, 2π/3, π radians, respectively. Thus the transfer function of the above filter can be written as, 1−2R cos θ z −1 +R2 z −2 Q3 1−2R cos θ z −1 +R2 z −2 H(z) = 1−2R12 cos θ22 z−1 +R22 z−2 i=1 1−2R12 cos θii z−1 +R12 z−2 1
2
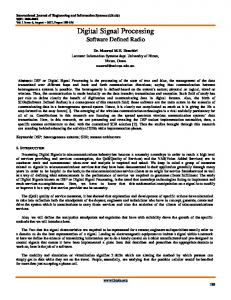
where θi = (0, 2π/6, π) for i = 1, 2, 3 and R1 = 0.998 and R2 = 0.898. Here it is important to note that it is enough to suppress the harmonics of 2π/6 and suppression of the higher period harmonics is not necessary because their contribution in a window size of only 351 samples is negligible. Furthermore, in order to smoothen the output, we can use a smoothening window instead of the traditional rectangular window. The schematic of such a system is shown in Fig. 2. The output of HS filters is discussed in section V. Though, using HS filter, we have suppressed the higher order harmonics frequencies but still the conjugate frequency component, i.e., −2π/3 or 4π/3 could not be suppressed due to the complex conjugate pairing nature of zeros and poles.
Proc. Int. Conf. IEEE Tencon 2008
3
Fig. 2.
Schematic of the HS filter with smoothening window
This issue is addressed in the next section using Minimum Variance Spectrum Estimation technique.
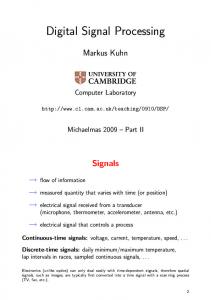
Fig. 3.
Frequency response of Minimum Variance Spectrum Estimation
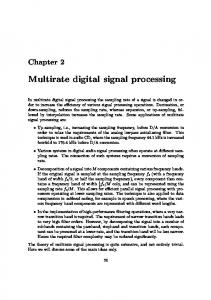
Fig. 4.
Lattice structure realization of a MV filter
IV. M INIMUM VARIANCE S PECTRUM E STIMATION T ECHNIQUE All existing techniques for gene prediction are nonparametric techniques for estimating the power spectrum of a random process. Relying on the DTFT of an estimated autocorrelation sequence, the performance of these methods is limited by the length of the data record. These filters remain same for all types of input data thus are data independent. As a result, when input sequence contains a significant amount of power in frequency bands within the sidelobes (i.e., frequencies other than 2π/3 in this case) of the bandpass filter, leakage through the sidelobes will lead to significant distortion in the power estimates. The spectral leakage masks weak signals present in the data. Therefore, a better approach would be to allow the filter to be data adaptive so that the filter may be designed to be “optimum” in the sense of rejecting as much out-of-band signal power as possible. In this section, we develop the Minimum Variance (MV) method of spectrum estimation, which is an adaptation of the Maximum Likelihood Method (MLM) developed by Capon for the analysis of twodimensional power spectral densities [23]. The motivation for this approach can also be seen by looking to the problem of harmonic suppression in the aforementioned filters. Minimum Variance Spectrum Estimation technique gives us flexibility to minimize the power in the side lobe frequencies thus maximizing the power in main lobe. The minimum variance spectrum estimation technique involves the following steps: 1) Design a bandpass filter g(n) with center frequency ω = 2π/3 so that the filter rejects the maximum amount of out-of-band power while passing the component at frequency ω with no distortion. 2) Filter the DNA sequence x(n) with the filter and estimate the power in each output process y(n). Hence the impulse response of such a filter for a given input sequence can be given as, g=
Rx−1 e H e Rx−1 e
(1)
where, eH represents the Hermition (complex conjugate) matrix of exponential vector e, Rx is the p × p autocorrelation toeplitz matrix of the samples in the current window and g is the impulse response of the Minimum Variance filter with band-pass frequency ω = 2π/3. Refer to [22] for detailed derivation.
Fig. 3 shows the magnitude of frequency response of MV spectrum estimation filter for a particular window of 351 samples; it should be noted that MV spectrum estimation is an adaptive filter and the frequency response changes with the input samples. It is evident from the figure that conjugate frequency component at 4π/3 is heavily suppressed in the frequency response which are clearly present in the exiting filtering techniques. Lattice realization of MV spectrum estimation filter is shown in Fig.4 where the reflection coefficients Km depend on the input sequence and M is the window length.
V. SIMULATION RESULTS AND DISCUSSION All the techniques discussed were simulated using a sliding window of 351 nucleotide of the DNA sequence. The existing techniques are not successful in detecting small length genes because they allow to pass the higher order harmonic components, i.e. spectral leakage which masks weak signals present in the data. In [2], Tiwari et al. suggested that the threshold power for C.elegans’ chromosome III is 0.4 on a normalized scale. It is evident from Fig.5(a) that the existing antinotch filter is not able to detect the first exon (refer Table I) and the peak value is smaller than 0.4, also some spurious peak (highlighted in figure) in introns are above the threshold giving a false impression of an exon. The proposed HS filter suppresses the harmonic components, giving more accurate exon detection. Fig.5(b) shows that HS filter is able to detect the smaller length exons where antinotch failed, however, the problem of suppressing the spurious peaks in introns (highlighted in Fig.5 (a) and (b) ) still remains because of failure to attenuate the complex conjugate harmonic frequency components. These complex harmonics are suppressed using the MV spectrum estimation filter, as clear from the Fig. 5(c).
Proc. Int. Conf. IEEE Tencon 2008
4
MV filter is able to detect the smaller exon (for example first exon) with perceptible suppression of the spurious peaks allowing better exon discrimination where the coding regions are short and/or closely spaced. VI. C ONCLUSION The inability of existing classical DSP tools like Fourier transforms and time-frequency analysis (which have been used for long time in studying DNA sequences of coding and non-coding regions) to eliminate the harmonic frequency components and detecting smaller length exons is tackled. The accuracy was achieved by using mechanisms to suppress the harmonic frequencies by means of HS filter and adaptive Minimum Variance filter. Beside this as the DNA sequence length may go up to few billions of bases, the complexity of such a gene prediction is a significant issue therefore, 2-simplex mapping technique is used which minimizes the overall computation complexity of the system. R EFERENCES [1] Fickett J. W., “Recognition of protein coding regions in DNA sequences”, Nucleic Acids Research, vol.10, 1982, pp.5303-5318. [2] Tiwari S., Ramachandran S. and Bhattachalya A., et al. “Prediction of probable gene by Fourier analysis of genomic sequences”, CABIOS, vol.13, no.3, 1997, pp. 263270. [3] Anastassiou D., “Frequency-domain analysis of biomolecular sequences”, Oxford University Press, Bioinformatics, vol. 16, pp. 1073-1081, 2000. [4] Anastassiou, D., “Genomic Signal Processing”, IEEE Signal Processing Magazine, July 2001, pp. 8 - 20. [5] Vaidyanathan P.P., “Genomics and Proteomics: A Signal Processor’s Tour”, IEEE Circuits and Systems Magazine, November 2004. [6] Vaidyanathan P.P. and Yoon B J, “The Role of SignalProcessing Concepts in Genomics and Proteomics”, Invited Paper, Journal of the Franklin Institute, Special Issue on Genomics, 2004. [7] Vaidyanathan P.P. and Yoon B J, “Digital filters for gene prediction applications”, in Proc. Asilomar Conference on Signals, Systems, and Computers, pp. 306-310, Pacific Grove, Calif, USA, November 2002. [8] Kotlar D., and Lavner Y., “Gene prediction by spectral rotation measure: a new method for identifying proteincoding regions”, Genome Research, vol. 18, pp. 1930-1937, 2003. [9] International Human Genome Sequencing Consortium, “Initial sequencing and analysis of the human genome”, Nature, vol.409, pp. 860-921, 2001. [10] Human Genome Project, www.ornl.gov/sci/techresources/Human Genome/home.shtml [11] Gusfield D., Algorithms on Strings, Trees, and Sequences: Computer Science and Computational Biology, Cambridge University Press, Cambridge, UK, 1997. [12] Voss R. F., “Evolution of long-range fractal correlations and 1/f noise in DNA base sequences”, Physical Review Letters, vol. 68, no. 25, pp. 3805-3808, June 1992. [13] Rao N. and Shepherd S. J., “Detection of 3-periodicity for small genomic sequences based on AR technique”, International Conference on Communications, Circuits and Systems, ICCCAS, vol. 2, pp. 1032- 1036, June 2004. Fig. 5. Comparision of the different techniques. (a) output of the antinotch [14] Silverman B. D. and Linsker R., “A measure of DNA filter, (b) output of proposed HS filter, and (c) output of MV spectrum periodicity”, Journal of Theoretical Biology, vol. 118, no. estimation technique 3, pp. 295-300, Feb 1986. [15] Guig, R. “DNA composition, codon usage and exon prediction.” http://www.pdg.cnb.uam.es/cursos/FVi2001/ GenomAna/GeneIdentification/SearchContent, 2000.
Proc. Int. Conf. IEEE Tencon 2008
5
[16] Rao N, “Study of Numerical Mapping Methods for DNA Sequences”, Chinese Journal of Biomedical Engineering, 2004. [17] Ambikairajah E., Epps J., and Akhtar M., “Gene and exon prediction using time-domain algorithms”, IEEE 8th Int. Symp. on Sig. Proc. and its Appl., pp. 199-202, 2005. [18] Grandhi D. G., Vijaykumar C., “2-Simplex Mapping for Identifying the Protein Coding Regions in DNA”, IEEE TENCON 2007, Taiwan. [19] National Center for Biotechnology Information, US National Library of Medicine, National Institute of Health, http://www.ncbi.nlm.nih.gov/ [20] Wormbase, http://www.wormbase.org/ [21] Eskesen, S. T., Eskesen, F. N., Brian, K., Ruvinsky, A., “Periodicity of DNA in exons”, BMC Molecular Biology, vol.5, pp.12-24, 2004. [22] Hayes, M. H., “Statistical digital signal processing and modeling”, John Wiley & Sons, Inc., New York, USA, 1996. [23] Capon J., “High-resolution frequency-wavenumber spectrum analysis”, Proc IEEE, vol. 57, pp. 1408-1418, Aug. 1969.
Proc. Int. Conf. IEEE Tencon 2008