Digital Signal ProcessingToolsfor Loudspeaker. Evaluation and Discrete-Time Crossover Design*. MALCOLM OMAR HAWKSFORD, AES Fellow. Centre for ...
PAPERS
Digital Signal ProcessingTools for Loudspeaker Evaluation and Discrete-Time Crossover Design* MALCOLM
OMAR HAWKSFORD,
AES Fellow
Centre for Audio Research and Engineering, Department of Electronic Systems Engineering, University of Essex, Colchester C04 3SQ, UK
Loudspeaker response data can be decomposed into minimum- and excess-phase components. Subjectively less significant elements can then be filtered and a new family of response curves computed. Applications to both cumulative-decay spectra (CDS) and energy-time curves (ETC) are discussed, where noncausal attributes are corrected. A versatile technique for producing digital crossover alignments is presented together with the implications on CDS and ETC. A novel method of masking polar response errors within the crossover transition band is also proposed.
0 INTRODUCTION In this paper we explore alternative methods of presenting measured data of the linear imperfections arising in loudspeaker systems. There are a number of ways that the linear distortion of a loudspeaker can be described, which include impulse response, frequency and phase responses, cumulative-decay spectra (CDS), and energy-time curves (ETC). In practice all these data formats, although excluding certain performance attributes, are essentially equivalent and can be seen to be generic upon the impulse response. The impulse response is considered here as the basis response of a loudspeaker and is selected because it allows direct timedomain editing to eliminate reflections from objects other than the loudspeaker itself. There are of course numerous ways in which the impulse response can be obtained, which include direct measurement, maximumlength sequence excitation with cross correlation, and time-delay spectrometry. All these techniques have been widely researched. A multi-drive-unit loudspeaker system requires a crossover filter [1] to spectrally divide the audio signal into appropriate low-pass, band-pass, and high-pass responses so as to match the characteristics of the drive units in terms of frequency response, power handling, and polar response. The accuracy to which these filters *Presented at the 100th Convention of the Audio Engineering Society, Copenhagen, Denmark, 1996 May 11-14, under the title "Minimum-Phase Signal Processing for Loudspeaker Systems," revised 1996 October 29. J. AudioEno.Soc.,Vol.45,No.1/2,1997January/February
are designed and matched to the drive units contributes significantly to the overall performance of the loudspeaker. However, because of practical constraints there are residual imperfections in the loudspeaker transfer function, which in general also shows polar response aberrations. Three main categories of loudspeaker systems can be identified: the passive system using passive crossover networks (possibly with external analog/digital equalization), active loudspeakers using analog crossovers, and active systems employing digital filters. It is well known that for the first two categories, except for the first-order case and the restricted class of zerophase constant-voltage filters [2], [3] the crossover networks must exhibit an overall all-pass characteristic [2], [4]- [6] and that this in itself will contribute significantly to the time dispersion revealed within the impulse response. However, in the digital implementation it is straightforward (though not essential) to produce linearphase filter transfer functions [7] that do not exhibit an all-pass characteristic. Audibility of phase distortion in a linear system has been widely debated and is especially relevant to loudspeaker design. Under certain conditions phase distortion is clearly audible. For example, when a nonsymmetric signal is time reversed, although the long-term amplitude spectrum is unchanged, there are obvious perceptual differences. Nevertheless, in examples of more modest phase distortion, such as those encountered in typical loudspeaker crossover networks, the human ability to detect phase distortion is reduced. For example, it is generally accepted that the phase distortion intro37
HAWKSFORD
PAPERS
duced by a fourth-order Linkwitz-Riley alignment [6] has minimal subjective consequence where results of research on determining the audible threshold all-pass phase distortion have been presented [8]. Our own informal experiments [9] have also been conducted on more complicated forms of phase distortion using digital equalization networks. For example, a two-stage digital equalizer was implemented where the first stage performed minimum-phase equalization (to achieve a fiat on-axis spectrum) while a second stage performed excess-phase equalization, the latter filter having a fiat amplitude response. This process permitted auditioning the contribution of excess-phase distortion while keeping the amplitude response the same. Measurements showed that the excess-phase distortion introduced significant time-domain error in the impulse re-
relating to equalization and polar response, and a flexible digital design program based on Butterworth prototype filters is presented. Also, two new classes of crossover filter are proposed, designated a stochastic alignment and a sinusoidal frequency interleaved alignment. These alignments are shown to have application in enhancing the off-axis frequency response of a loudspeaker. The mathematics in this paper are presented for conciseness using vectors and matrices in a MATLABLlike notation, where the functional operators are defined in Appendix 1. Also, a computer listing is presented in Appendix 2, which permits the evaluation of all the major features and designs presented in the paper together with an opportunity to experiment with alternative design variations.
sponse, yet auditioned in mono, the audible change both on an impulsive signal and on music was not perceptible. Hence provided no other characteristics of aioudspeaker are modified, it follows that amplitude response errors affect subjective performance to a very much greater extent than phase response errors. However, it should also be reported that in later experiments, using the Gerhard loudspeaker layout (GLL) [10], where accurately matched, digital and active low-diffration loudspeakers were located in a widely spaced configuration designed to minimize the contributions of early reflections, correcting the excess distortion was perceived to improve certain attributes of the stereophonic sound stage. Nevertheless, under more normal listening conditions using, for example, a conventional IEC floor plan, this subtlety can be lost due to greater loudspeaker-room interaction, Consequently, because of the lower audible significance of modest phase distortion, it is expedient to process measured data to exclude some attributes of phase distortion in order to declutter the final display and thus make the diagnosis of loudspeaker imperfections more accessible together with an improved subjective--measurement correlation. It is proposed that the displayed data should still inelude some attributes of phase distortion, where these are selected using minimum-phase criteria. As such, the display retains causal integrity, yet simultaneously reduces clutter due to the excess-phase distortion of lower
I MINIMUM-PHASE
subjective significance. However, for accurate stereophonic sound reproduction phase is believed to be of greater significance. Consequently phase distortion should still be displayed, but segregated onto a separatedisplay. The ETC is also used as an energy-time or envelope function, but has been criticized for exhibiting apparent noncausal attributes. A modified ETC is proposed, which corrects for the precursive response elements using minimum-phase processing. However, to match typical loudspeaker responses, the ETC is further modified by incorporating the excess-phase response of a loudspeaker. As such, an ETC results that closely matches both causality and envelope criteria. Finally, some additional aspects of minimum-phase and linear-phase crossover filter design are discussed 38
SYSTEM
THEORY
Most loudspeaker drive units, excluding the crossover networks, exhibit a minimum-phase frequency response, meaning that the log-amplitude response and the phase response are uniquely related by the Hilbert transform [ 12]. It also implies that the group delay (that is, the time differential of the phase response) is minimum within the bounds of the system amplitude response and requirements of causality. However, analog crossover alignments are generally nonminimum phase, where the composite response can be decomposed into minimum-phase and excess-phase components, the latter characterized by a constant-gain amplitude response. If the amplitude response is corrected by equalization, then the normalized and equalized minimum-phase response becomes unity at all frequencies, but the excess-phase response can only be approximately linearized by performing a convolution of its corresponding impulse response with a truncated but time-reversed version, resulting in an overall time delay. This time delay is a direct consequence of the requirements of causality. The Fourier transform G(f) of a continuous-time function g(t) (where t is time and f frequency) consists of the summation of both even-order and odd-order func-. tions, which constitute the real and imaginary components of G(f), G(f) =
=
g(t)e -j2_ft dt _o_
i_®
g(t)cos(2_rft)
dt
t_o + J J_ oog(t)sin(2xcft)
dt
where taking the inverse Fourier transform, g(t) = geven(t) + In practice
godd(t)
.
both even and odd functions
geven(t) and
_MATLAB is a registered trade name. d. Audio Eng. Soc., VoL 45, No. 1/2, 1997 January/February
PAPERS
LOUDSPEAKER EVALUATION ANDCROSSOVER DESIGN
godd(t) exist for all time and have even and odd symmetry, respectively, about t = 0. For a causal system and where the excitation is applied at t = 0, it must follow that g(t) = 0 for t < 0, which impliesthatfor t < 0, geven(t) =
- godd(t)
·
The problem is therefore to calculate the functions geven(t) and godd(t) such that the amplitude response matches that of the amplitude response of G(f). There is a unique solution to this problem, where the relationship yields a complex Fourier transform, which defines the minimum-phase response that directly implies a causal relationship. In the present work, which involves only discrete-time signal vectors, the following procedure for calculating the minimum-phase response has been adopted using the (zero-phase) magnitude response as input. Computation of the minimum-phase discrete-time sequence2: Let the input magnitude spectrum be ]el, where we assume here a sampled-data system such that the spectrum is discrete. In practice this can be found directly either from the loudspeaker impulse response h(n) by calculating the absolute value of the corresponding Fourier transform, or from the Fourier transform c itself, that is,
The corresponding
spectra of he(n) and ho(n) follow:
de = fit(he(n)) do = fit(ho(n)). The minimum-phase function hmin(1 :N/2) is zero for negative time (located here at the center of the display). From the construction described in 1) and 2) it has a spectrum Cmin, emin = de + do = real(de) + j imag(do) that is, Cmln = real(hilbert(de)
+ j imag(hilbert(de)
= hilbert(de). Here hilbert is a complex operator, which incorporates the odd and even symmetry of the spectrum, where the , real part equates to de and the imaginary part to do. However, the spectra de and do must be chosen so that [Cminl= Icl, which is effectively a statement of the minimum-phase computation task. This can be achieved using a logarithmic substitution, where if de = log(lc[), Crain= exp(hilbert(log(]c])))
c = fft(h(n)) where fit(.) is the fast Fourier transform operator of a discrete normalized spectrum and n is a vector 1:N, with N being a power of 2. Assume that the minimum-phase impulse sponse derived fromcausal the magnitude spectrum of creis hmia(1:N/2), and that it is decomposed into even and odd symmetric functions as follows, 1) First construct an even sequence he(n ) from hmin(1:N/2),
= exp(log(]c]) + j imag(hilbert(log([c[)))) =
Iclexpo
imag(hilbert(log([c])))).
Consequently the amplitude spectrum lc] is preserved · and the phase response is related to the logarithm of the amplitude response. When processing
he(N/2 + I:N) = 0.5 hmin(l:N/2 )
he(n)
discrete
vectors
' I si
I 1'/ I
and
I
I
he(N/2:-
'
N IN
1: 1) = 0.5 hmin(l:N/2 ) .
l_.n(l:N/2) ' 2) Then derive an odd-symmetric ho(N/2 + 1:N) = 0.5
)
hmin(1
sequence ho(n) from
ho(n)
2 12, .,
I
TN ,i
:N/2)
1
of length N and
/1
' ]1
I
n
_
n
N
I
'T +l
and
ho(N/2:-
1: 1) = -0.5
hmin(l:N/2 ) .
ho(n) + he(n)
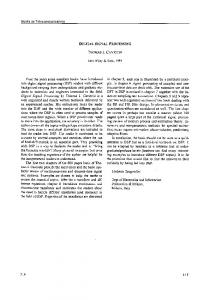
Here the functions he(n), ho(n), and he(n ) + ho(n) have
-
the form shown in Fig. 1.
i
2 Editor's Note: Since most of the equations in this computation use MATLAB-like notation, we deviate here from Journal style by not italicizing variables for the sake of consistency with the program in Appendix 2. J. AudioEng.Soc.,VoL45,No.1/2,1997January/February
]
l
: : ., / / / IN
N
N ,.y +X T, z I I Fig. 1. Causal impulse response decomposed into even and odd symmetric impulse responses. 39
HAWKSFORD
PAPERS
power 2, the MATLAB operator 3 hilbert(.) can be used to compute the discrete minimum-phase impulse response hmin(n) from a magnitude spectrum Icl, hmin(n) = real(ifft(exp(conj(hilbert(log(abs(c))))))). The even and odd functions ho(n), ho(n) then follow directly as single-line MATLAB commands, h_(n) = real(ifft(real(exp(conj(hilbert(log(abs(c)))))))) ho(n) = imag(ifft(imag(exp(conj(hilbert(log(abs(c)))))))) which give the same sequences as those stated in 1) and 2). The excess-phase response q_exc(n)can be calculated from the arguments of the complex spectra c and emin as _exc(n) = angle(c) - angle(emin) where the excess-phase
impulse response hoxc(n) is
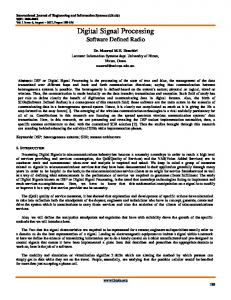
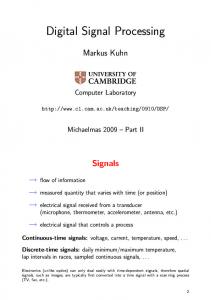
hox¢(n) = real(ifft(exp(q_c(n)))) Fig. 2 shows an example series of waveforms illustrating a truncated impulse response of a loudspeaker, the corresponding magnitude spectrum, the odd and even time functions required for the response to be causal, the derived minimum-phase impulse response hmin(n), and the excess-phase impulse response hox¢(n). Corollary 1: Observations on Minimum-Phase Equalization with FIR Filters An observation of relevance to loudspeaker equalization concerns the relationship between an inverse finiteimpulse response (FIR) equalization filter and the derived minimum-phase impulse response that results after equalization, Consider a nonminimum-phase measurement of a loudspeaker expressed as an impulse response hi(m), The response is time edited to a shorter sequence hledit(n) to eliminate first and subsequent reflections and is zero padded to give power-of-two samples n to enable fast Fourier transform processing. The magnitude response Cm(n ) is calculated as em(n)= abs(fft(hledit(n))) and an inverse frequency response ci(n) formed element-by-element division ./as ci(n) = °nes(n)'/Cm(n) A minimum-phase can be derived as
using
'
equalizer
impulse response
hmeq(n)
Finally, a minimum-phase
version hmleq(l) is calculated,
= real(ifft(exp(conj(hilbert(log(abs(fft(hlm(l)))))))) ) . Fig. 3(a) shows a truncated loudspeaker impulse response (40-sample duration) and the minimum-phase impulse response hml_(n) derived using a truncated 59-tap FIR filter, where the equalized response is magnified by a factor of 70 to emphasize the detail in the tail of this response. The highlighted result is that equalization has achieved a total suppression of the minimum-phase response hml_(1) over 59 samples, equal to the inverse FIR equalizer length. Consequently; the number of taps of an FIR equalizer should ideally exceed the number of samples over which the minimum-phase derived sequence of the time-edited impulse response is significant. It should be noted that although the minimum-phase equalizer response is completely suppressed for 59 samples, there remains a residual tail for samples >59 as the equalizer empties from the excitation of the finite (truncated) loudspeaker impulse response. This is a consequence of the inverse fast Fourier transform filter design. An optimization procedure [7] could produce a different error distribution, which can take greater account of the tail, although there would then be some irregularity within the main response. Corollary 2: Observations on Minimum-Phase Equalization with IIR Filters A similar procedure can be followed using an infiniteimpulse response (IIR) filter design. In this case a leastmean-square fit IIR polynomial is generated to match the inverse spectrum of the truncated loudspeaker impulse response. Fig. 3(b) shows the truncated (40-sample) loudspeaker impulse response together with the overall minimum-phase equalized response derived using an IIR filter with 59 coefficients. Again, the filter is capable of almost total suppression of the impulse over the first 40 samples, with near complete suppression up to 59 samples. A residual error then occurs for samples >59. However, in this instance the tail in the response is much reduced, where a scale factor of 70 000 has been used to expand the error. These two examples demonstrate the behavior of minimum-phase digital equalization using both an asymmetric FIR and an IIR filter when the result of equalization is observed devoid of excess-phase distortion. This format is useful as it enables the error (observed in the minimum-phase equalized response) resulting from finite-length equalizers to be placed at a given period in time after the excitation. In this sense the error can be seen as a short echo that does not contaminate the first few milliseconds of the overall impulse response. This detail is generally hidden when uncorrected excessphase distortion is included.
hm_(n) = real(ifft(exp(conj(hilbert(log(abs(ci(n)))))))) 2 CUMULATIVE-DECAY where,
using one-dimensional
ized sequence
convolution,
hl_q(l)is
hi,q(1) = conv(hleait(n), hrneq(n)) . 40
SPECTRUM
the equalThe cumulation delay spectrum (CDS) is a linear transform operation performed upon the impulse response of a loudspeaker
that is designed
to display en-
J. Audio Eng. Soc., VoL 45, No. 1/2, 1997 January/February
PAPERS
LOUDSPEAKER
ergy storage as a function of time and frequency. As such it is possible to identify which frequency regions of the audio spectrum are exhibiting time dispersion through resonant modes, for example, The basic CDS can be generated using a rectangular window function that is made to slide along the impulse I
EVALUATION
AND CROSSOVER
DESIGN
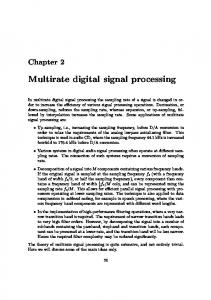
response h(n) in discrete steps (Fig. 4). At each location of the window function the magnitude of the frequency response is calculated. When the transform is plotted for each window location, a three-dimensional matrix is formed, which defines the CDS. The Hankel matrix operator can form the two!
i
0.0
?...............-
i
0.0
i
0.6 0.4
0.6 .......
,............._.......
_......... i............................ _
,.......... _.............;
0.2 0 i
i
_
_...............
:
t,_
_
0.4 ....
_:
-0.2 0.2
-1 0
I 20
ii I 40
I 60
i' 80
100
samples i J 160
120
140
samples 41.2 0
20
40
60
80
(a)
,
120
140
160
180
200
(d)
i i . . . . . . . . o.
---_
100
[: ! I --T'_--;
._T::.'TT_ .
:'m--_r ....
1 .......
.
·
...
·
...............
:
"·
i
i
o.6......................................................... i................... i i..............
i ,o ..........
0.2........................................................... _.............. _..... _.... i .... i
i: i!iiii ii ............ .,_
i
-20 _ 101
ii...?_.ii!i_i i.??..i.i.i_iii i i.:i.:i -- -
10 2
10 3
-
-0.4
102
10 4
20
40
60
(b)
80
100
120
samples 140 160
(e)
0.2
t ........
1 ..........................
015
i ......
0.8 0.6
0.1
·
i
0.4
0.05
0.2
i
i0 41.2
-0.1
41.4
-0.15
41.6 samples
.0.21 0
20
40
60
80
100
120
140
160
(c)
180
200
41.8 50
60
70
80
90
100
110
120
.............. :! samples i ] __ . I 130 140 150
(I3
Fig. 2. (a) Truncated loudspeaker impulse response. (b) Magnitude spectrum of loudspeaker impulse response in (a). (c) Oddsymmetry impulse response supporting causality. (d) Even-symmetry impulse response supporting causality. (e) Minimum-phase impulse response derived from (a). (f) Excess-phase impulse response from response in (a). J. Audio Eng. Soc., Vol. 45, No. 1/2, 1997 January/February
41
HAWKSFORD
PAPERS
dimensional rectangular window function that is required for the CDS. Here each row is replicated and windowed but shifted to the left, whereas the right-hand elements are progressively set to zero. Shifting the elements to the left is of no consequence as only the magnitude of the Fourier transform is taken when calculating the CDS. For illustration, a 5 by 5 Hankel matrix of a sequence h(1:5) has the form -h(1)
h(2)
h(3)
h(4)
h(5)'
h(2) h(3) h(4) h(5)
command, which takes element values of a matrix and plots them vertically as a three-dimensional graph. Thus, CDS(n)
In Section 1 a loudspeaker impulse was discussed, where Fig. 2 showed the measured response h(n) and the derived minimum-phase response emin(n). Following the matrix calculation of the CDS, we define a new display CDSmin(n) calculated from the minimum-phase impulse response emi,(n), where
0 CDSmin(n
hankel(h(l:5))
=
h(3)
h(4)
h(5)
0
0
h(4)
h(5)
0
0
0
0
0
0
0
Ih(5)
= mesh(abs)fft(hankel(h(n))))).
) =
mesh(abs(fft(hankel(emin(n))))
) .
Fig. 5(a) and (b) shows the corresponding CDS for both the direct impulse response and the minimum-phase impulse response, where the latter reveals a significant eduction in clutter due to the suppression of excess phase. Fig. 5(c) shows the CDS based on the excess-
where the rows of the Hankel matrix reveal the windowed and left-shifted impulse response. The CDS can then be plotted directly using the (MATLAB) "mesh"
phase impulse response eexc(n). It is evident that for this loudspeaker much of the time dispersion is exhibited in the excess-phase response, whereas the minimum-phase CDS displays a more constrained dispersion characteristic. If the lower audibility of phase distortion is consid-
2 ....................................i......................................................... i _5 ...................................._...................................................... loudspeaker impulseresponse
ered as discussed in the Introduction, then we propose that the modified minimum-phase CDS will give a closer subjective correlation to loudspeaker performance. ,However, we advocate that the excess-phase CDS
_ ..._>_ ! 0.6 ...........................................................................................
·_
minimum-phase, overallequalizedresponse:scaleT0
}
_
i -1
20
-0.5
applied to the CDS matrix. Following image processing
!i 40
should also be presented, but that the separation into excess- and minimum-phase displays is more useful to the loudspeaker designer. To reduce some of the finer detail in the display, a two-dimensional convolution window or mask can be
i 60
i
80
Ii/
100
_mpl_ ! 120
140
row I h(n)
_._ n
(a) 2 .........
_..........
_........... _..........
_ _ ....... :.......
_........... :......
0.5
e
_
h(n)
row 2
loudspeaker impulse reSponSe
I
!
_
n
row 3
·_
_ n
-0.
row 4
i -1
20
40
60
:, 80
i _ 100
,_ 120
scale70000 140
(b) samples Fig. 3. (a) 59-tap FIR equalization; (a) minimum-phase responses. (b) 59-tap IIR equalization; minimum-phase responses, 42 /
_--
_
I
_
n
_l_
Fig. 4. Construction of CDS using progressive displacement of a rectangular window over the loudspeaker impulse response. J.AudioEng.Soc., Vol.45,No.1/2,1997Januav//Febma_
PAPERS
LOUDSPEAKER EVALUATION ANDCROSSOVER DESIGN
applied to the CDS matrix. Following image processing practice, a Gaussian window shows a combination of good smoothing plus low image artifacts. A Gaussian window CDS(n)win of order n can be computed from multiple two-dimensional convolutions starting from a simple 2 by 2 matrix, where the coefficients are normalized so that their summation is unity,
Note how the mask is square and the order of the mask equals the number of rows (or columns) in the matrix. The convolution can be continued by iteration to generate a family of matrices to order m, where CDS(m)wm = ]conv2(CDS(m -
1),_, CDS(m -
Fig. 6 shows a seventh-order 0.25
1)w_lm-
filter mask. A filtered
0.25
CDS(2)win ---
/1 '
L0.25
spectrumCDSmi.w convolution betweenis then actualformed CDS and by athe two-dimensional filter mask,
0.253
CDSmin
w =
conv2(CDSmin(n
) CDSwin(m)).
This process is similar to one-dimensional convolution where the technique was applied in the generation of a Gaussian crossover filter [12]. A third-order window CDS(3)wi. then follows by two-dimensional convolution
As examples of this smoothing process, Fig. 7 shows a third-order and a seventh-order mask applied to the CDS in Fig. 5(a).
using operator notation conv2,
3 ENERGY-TIME
CDS(2)wi.)l.orm·
CDS(3)wi n = Iconv2(CDS(2)win,
The energy-time
This yields a 3 by 3 mask, where
I0.0625 CDS(3)wi. = / 0.125
I
L0.625
CURVE curve (ETC) can be used to display
time dispersion in a loudspeaker as an envelope function of a complex time sequence. Examining the impulse
0.125
0.0625'_
0.25
0.125
0.125
0.0625
Fig. 2(a), shows a function that varies from negative to response of a loudspeaker, such crossings. as h(n) illustrated in positive values with multiple zero This typical behavior is common to all audio signals with zero mean. However, from a subjective stance when listening, for example, to a sine wave, we perceive a continuous
2.
_ 1.5.
_,
1 0.5. 0.5.
0:
0: 0 _ 50 ×
50 80 _'*
80
60
tOO'"'
40
60 _,ps
.
20 _A/_
''rO'O/e_
0
40
1._
b_S
2O 0
(a)
(b)
2.
1.5
0.5
0> 0 _-.. 50
_''
-
80 60
1O0 _'e/e_
40 0
_
20
(c) Fig. 5. CDS. (a) Derived from loudspeaker (c) Derived from excess-phase loudspeaker
impulse response. impulse response.
J. AudioEng.Soc.,Vol.45, No.1/2,1997January/February
(b) Derived from loudspeaker
minimum-phase
impulse response.
43
HAWKSFORD
PAPERS
acoustic object that does not exhibit periodic moments of silence. A functional presentation that describes intensity variations but ignores subjectively obscure signal zeros is therefore desirable. In effect the zeros in the
h(n) can be represented
time-domain waveform do not necessarily correspond to silences. We infer aspects of pitch and loudness as continuous attributes in which derivative information as well as amplitude information contribute to the overall percept. Simplistically, the signal peaks appear to carry similar weight to signal derivatives at the signal zero crossings,
where htr(n ) and htr(n) are the real and imaginary time sequences, respectively [with htr(t ) corresponding to
3.1 Determination
by the operation
ht(n) = hilbert{h(n)} = htr(n ) + j hti(n )
h(n) in this notation]. It is informative to examine the Fourier transform of a typical sequence h(n), where Fig. 8(a)-(c) displays htr(n), Mi(n), and their shared magnitude spectrum. Fig. 8(d) shows the magnitude spectrum of the complextime functionht(n). It should be noted that all the in-band spectra are identical while the reflected spectral components ofht(n) are zero, confirming the complex form of ht(n). The envelope et(n) of ht(n) is calculated as
of ETC
It is therefore expedient to select an algorithm in which both amplitude and derivative information are included explicitly, from which an envelope function can be derived. The ETC uses the Hilbert transform to
et(n) = [htr(n) 2 + hti(n)2] °-5 = abs{ht(n)}.
calculate a complex time function, the amplitude spectrum of which is essentially identical to that of the amplitude spectrum of h(n). The Hilbert transform is an operator that yields a complex time function having real and imaginary parts. This analytic function must therefore
Fig. 8(e) and (f) shows the resulting ETC, et(n), and its corresponding magnitude spectrum.
be described in two-dimensional space and consequently has real and imaginary time sequences. If we derive an envelope function that corresponds to the magnitude of this complex time function, this is the ETC. The Hilbert transform ht(n) of the impulse sequence
that it exhibits a precursive response that appears to contravene causality. In practice this does not happen, as the function should be considered in conjunction with an overall delay. Nevertheless the presence of a precursor to the main impulse event is counterintuitive where
3.2 Minimum-Phase Corrected ETC However, the nature of the Hilbert transform
is such
0.02.
0.015.
0.01 0.005
o 30
30 10 _AI_
_10
-0
Fig. 6. Seventh-order
40
0
two-dimensional
1.5.
filter mask.
1.5,
a
_
0.5,
1
0.5
0 50
50 ' 80 I O0
60 40
_A/e_
1
0
20
(a)
80 60
1O0 40
b_S %toA/_
1
0
b_S
20
(b)
Fig. 7. CDS as Fig. 5(a). (a) Filtered with third-order mask. (b) Filtered with seventh-order mask. 44
O.AudioEng.Soc.,Vol.45,No.1/2,1997January/February
PAPERS
LOUDSPEAKER
the peaks in the ETC and the loudspeaker impulse response should also remain time aligned. To rectify this anomaly, the envelope function et(n) can be further processed to form a minimum-phase envelope, where the envelope spectrum is preserved but the precursor region
EVALUATION
AND CROSSOVER
DESIGN
is removed in line with minimum-phase theory. The calculation of etmin(n), the minimum-phase ETC, is similar to that described in Section 1, where the salient operations are as follows. 1) Calculation of amplitude spectrum fet(n) of the
II 0.8 0.6
0.2
,
-0.2 -0.4 0.4
_
_
-0.8 samples -0.6.1 t 0
50
1O0
t 50
200
250
300
350
400
450
bins 500
500
1000
1500
2000
(a)
25'00
3000
3500
4000
4500
(d)
1.4 t.4 1.2
1.2
1
0.6
0.8
0.4
]
o.4 -0
0.2
samples -0.6
50
100
t50
200
250
300
350
400
0
450
50
500
_ 100
150
200
250
300
350
400
450
500 samples
(e)
(b)
4
20
3.5t
18 16
3 14 2.5
12
2
10
bins O0
50'-0-
10_
1_
2OO0
25-_
30'"_
350--_
(c)
4OO0
45OO
ins 0
5O0
1000
1500
2OOO
25O0
3OOO
35O0
40O0
4506
(fi
Fig. 8. (a) Real part htr(n) of Hilbert transform, impulse response. (b) Imaginary part hti(n) of Hilbert transform. (c) Magnitude spectrum of real part of Hilbert transform. (d) Magnitude spectrum of complex-time Hilbert transform. (e) ETC formed from magnitude of Hilbert transform. (f) Magnitude spectrum of ETC shown in (e). J. Audio Eng. Soc., VoL 45, No. 1/2, 1997 January/February
45
HAWKSFORD
PAPERS
ETC sequence
et(n),
Section 1, where the compensated response ETC etexc is calculated from the complex ETC etmin(n),
fet(n) = abs(fft(et)). et%x¢ = abs(conv(etmin(n),h_xc(n)) ) . 2) The minimum-phase impulse response derived from the original ETC envelope then follows, etimn(n) = real(ifft(exp(conj(hilbert(log(fet(n)))))))
excess phase, the nonminimum-phase ETC, excess-phase compensated ETC are shown.
whereby the corrected ETC is abs(etmi,(n)). Fig. 9(a) shows a minimum-phase loudspeaker impulse response, the corresponding nonminimum-phase ETC, and the minimum-phase ETC. 3.3 Excess-Phase Phase ETC
Compensated
Minimum-
The minimum-phase corrected ETC conforms to the derived minimum-phase loudspeaker impulse. However, when compared against the measured loudspeaker response that includes excess phase, then anomalies in the envelope of the ETC are evident. It is proposed to correct the minimum-phase ETC by convolution with the excess-phase
Fig. 9(b) illustrates the improvement in envelope matching, where the loudspeaker impulse response including
impulse response hex_(n), as defined in
4 CUMULATIVE-DECAy
ROOT SPECTRUM
An alternative display mode related to the roots of the polynomial describing the loudspeaker can be defined and is called cumulative-decay root spectrum (CDRS). This technique is well matched to the minimum-phase impulse response as this response is invertible, the roots being stable. Consequently the minimum-phase polynomial can be expressed as a partial-fraction expansion, where the roots of the denominator form stable (convergent) terms, that is, hmin(Z ) =
a0 + _-_ r=l_'_(Z -- a r -I-
E-TC /_................ A ]_
1.5
1
Minimum-phase E-TC
of filtering the generates display. In effect, the expansion approximation a parallel arraypartial of second-order filters, which can be defined in terms of their respective
/_-_f_--__.__________ t
E
minimum-ph.ase
=] 0 0.5
/ imp_loudspeaker samplm
.0,_
I0
20
30
40
50
60
70
80
(a) 3
25 -_-J
damping Qr and undamped resonant to frequency tor. The impulse response natural corresponding a specific second-order sectioncanbecalculateddirectlyas a discrete-time sequence. For the rth term in the partialfraction expansion the impulse response hmi_(r, n) is computed and the corresponding minimum-phase ETC, that is, etmin(r, n), is derived as described in Section 3. This process is repeated for each root, and the corresponding undamped natural resonances are computed. The ETCs are then assembled onto a three-dimensional eitherlocatedat the appropriateresonantfrequencyon display, each being directed along the time axis and resonant frequency on an integer scale. Fig. 10 shows the frequency axis or simply presented inrank order of
-xc _
Nr(z) jO,)(z + a, + jl3r)
root derived in a partial-fraction expansion. The roots can be computed on a least-mean-squares basis so that Here Nr(z) represents the numerator associated with each the more terms, the better the approximation. However, limitingthenumberof rootsis a straightforwardmethod
2.51 __
and the
'--_v_-__
1.
wifla excess-phase impulse respoase
1
/
minimum-phase E-TCconvolved _ Loudspeaker
05
with
0
/
excess
response displayed in Fig. 8. The roots were determined tWO CDRS that correspond to the loudspeaker impulse from the 59-tap FIR equalizer filter polynomial discussed in Corollary 1 in Section l. Fig. 10(a) is a linear CDRS display, whereas Fig. 10(b) plots each ETC
impulse response phase
/ ^^/_ ^ _, /--_
(forming the CDRS)ona low-level detail.
decibel scale to reveal more
-0.5
-1
_o
2o
3o
40 (h)
_o
6o
,amp.., 7o so
Fig. 9. (a) ETC and minimum-phase ETC of loudspeaker irapulse response. (b) Excess-phase corrected ETC. 46
5 LINEAR AND MINIMUM-PHASE EXAMPLES
FILTER
In this section a number of examples cessing relevant to audio are considered.
of signal proThe examples
J. Audio Eng. Soc., Vol. 45, No. 1/2, 1997 January/February
PAPERS
LOUDSPEAKER EVALUATIONAND CROSSOVER DESIGN
demonstrate techniques of frequency response tilting, psychoacoustic response shaping for subjective enhancemerit, and constant-amplitude crossover filters of arbitrary slope. For each class of filter, the impulse response is presented in both linear-phase and minimum-phase
time-domain sequence taj can then be computed using the inverse Fourier transform,
formats, where the results can be interpreted using both CDS and ETC by means of the program in Appendix 2.
and a minimum-phase impulse response tajmin(n) follows from the procedure in Section 1,
5.1 Constant-dB-Gain Response Tilting
tajmia(n) = real(ifft(exp(conj(hilbert(log(abs(aj))))))).
Logarithmic
Frequency
A filter characteristic useful for subjectively tailoring an audio signal uses a tilt function, which if plotted on a graph of gain in decibel against logarithmic frequency gives a line of constant slope. The following routine computes a frequency domain vector aj describing the tilt function from a unit vector mx(n): Let {slope} denote filter slope in decibels per octave. Define
taj(n) = real(ifft(aj(n)))
Fig. 11 (a) shows four examples of linear-phase time-domain responses corresponding to filter slopes of [ - 4, - 2, 0, 2, 4] dB per octave, whereas Fig. 11 (b) displays the corresponding minimum-phase time-domain responses. 5.2 Psychoacoustic
Weighting
Functions
A second weighting function that can usefully modify nj = {slope}/(20 logic(2))
and
fj = (m I . ma)0.5 .
Here m I and m h are the lower and upper frequency limits of the Fourier transform and fj is the geometric mean, whereby
the audio frequency response was proposed by Blauert [13]. This characteristic attempts to improve subjective performance by frequency-selective attenuation in the frequency range where the ear-brain is most sensitive. The amplitude-frequencyresponse in decibels is deLinear-phase impulse response: fleer slopes -4,-3,0,2,4 dB/octave
aj(n) = (mx(n)/fj) '"j
4
where the operator .nj implies that all elements of the vector mx(n)/f j are raised to the power nj. A linear-phase
_'
,;_
35 3
,
,
4 dB/octave
.--!-/-I-L-_ -___/_____i
04
. . . . i-: . . . ! . . . . . i.. . . . . . . . i. . . . . . . . '.!-'_4.._ei_
O.2-
40
20
"-_
_X_
40
42
44
46
48
50
. . . . ' . . . . _i. . . . . 52
54
56
58
60 samples
15 60
80'"' %.O/es
5 100
10
(a)
0
(a)
4
_,
,
__
o -2o,
._ i
Ye. ....................................................................... -._
3 ........ i......... _ ....... i ....... ! ---' "-"-'--'--' -'--_'--___ '' ' _'
!--
i
i
i
2
:_
!
i
!
/octave i
i
2._ ....... !---.2 i.........i.......... i .......... .........i.......... i.......... _. _........ dS/o_mve "_ ........i..........i.........._........'_ ........_ 20_"'_.
. 40"_' '_'
j
'_e_P/e_
I00
)l envdes = ILPF(f, (p){ - IHPF(f, *)1. The off-axis angle q> shows that in general the filter response must include the directional characteristics of the driver, although in this discussion it is assumed that the transfer functions include both the on-axis crossover filter and driver response, and that _pdependence is weak in the crossover transition region. The envelope parameters are useful indicators as they give a measure of the worst-case interference patterns that can occur for a given filter alignment, even though in practice with appropriate choice of crossover frequency and drive-unit spacing, the lower bound envde_ should not be reached, To implement a stochastic crossover alignment, a zero-mean random vector rd(n) is generated, which consists of a unit vector with superimposed noise sequence. An overall weighting factor h is included to set the noise
are beneficial effects to be gained from this randomization. It should be noted that the proposed noise additions are static, and consequently the resulting changes in frequency response are also static and do not result in actual noise signals. To demonstrate the process, a linear-phase filter alignment is shown in Fig. 15, where complementary randomization in both the high-pass and the low-pass filters should be observed together with the destructive envelope envdes. Observe how the noise component amplitude has been weighted by the function envd, _, but the composite function is unmodified. The effective "well" formed by the lower envelope function env&_ is partially filled with the static noise, thus dispersing its effect. 5.5 Sinusoidal Frequency Interleaved CrossoverFilter Alignment An alternative filter structure to that described in Section 5.4 is to use a sinusoidal interleave function to generate a regular array of peaks and dips in the low-pass and high-pass filter responses. The process is similar to the inclusion of a static noise function, except that the random vectors are replaced with complementary sinusoidal functions, where two alternatives are proposed: 5o i ! iilill i
! i iiiii_
_;i envelopefunction, envdes
level together spectrum formed withby an the option destructive for bandlimiting envelope thebound noise
!Jo,; !i!i !_
_ =
:_i iil
rd(n) = rand(n) filters
LPF(f)_,tt
rd(n) ,= HeF(f)_ut rd(n) - mean(rd(n)) t are then de-
LeF(f)l_att
_
-5o
i =:i i i i
_ !!""__
ButterworthlLPF(f)Butt -filtersHPF(f)Butt{LPF(f)Butt,°f theHPF(f)Butt.prototypeThelinear-phaSemodified _ o ...................... i ip°si_"_[_,_ ==- _1______
fined,BUtterw°rth
iii ii
i
............................................. _ii'passlilt r :__i ;_ !
......... i_iii
_ffli_i.p
= LPF(f)ButC* {ones(n) + h * (ILPF(f)Butt
iiiiiii /iiiiii!il - HPF(f)Batt I - rd)}/2
4oo
i:: i! iii{:,i!i i i iiii /f ii ii ii iili:.!i iiili
10t
102
HPF(f)_utt = HPF(f)Butt-* {ones(n) + _ * (ILPF(f)Butt
i iiiiiiii i iiiiii i;
i
_ _!_;_i,
103
: _;""Jy, m i_ , ,..!ili{
104
106
(a)
pod in ss.ing nton ed can.en --
HPF(f)Butt [ + rd)}/2,
applied to these modified prototype filters, where it is emphasized that the target responses in both linear-phase and minimum-phase processes are noiseless. Consequently the composite
o.35
It is conjectured that with music signals or any nonperiodic signal, which must have a broader spectrum, there J. Audio Eng. Soc., Vol. 45, No. 1/2, 1997 January/February
impul .....
p.....
0.2
T,5
i
°'_51...........................................................i.............................!
structure. Full details can be observed in the listing in Appendix 2. The effect of this processis that the compositere-
structiveanddestructiveinterference.
sor filter linear-phase
o.25
response does not exhibit a noise
sponse is unmodified, but the difference response envd__, which determines the off-axis lower interference bound, is noiselike. Consequentlyinterdrive-unitinterference that occurs in the filter transition band is distributed more broadly over the band with narrow bands of con-
LOW and htgh-pase p .....
0., hi_.p-_-i_mp-_e......i ..............!.............. !..............................! o.05 I. ' , i! 'g _ i
o_-- -
_'-'_-_-!
.
°'°_t............. i .............i..............i............ i........ :'-!............ V _ _ ':_.............. _ -0.1 L .............. i:............... i .............. _............... j ............. ' [ i ; ' .rap,,. -0.15 · , _ i i , / 0 50 ,00 _50 200 250 300
I
(b) Fig. 15. (a) Linear-phase stochastic interleave crossover alignment. (b) Precursor impulse response of LPF and HPF. 51
HAWKSFORD
PAPERS
1) An interleave function that is sinusoidal against linear frequency 2) An interleave function that is sinusoidal against logarithmic frequency. In both cases the amplitude of the interleave function can be weighted according to the polar interference region defned by envdes with overall equalization to ensure that the composite response is unity. The logarithmic frequency function is considered the better choice as there is greater time dispersion with minimal discrete echo effect, which results from a linear comb filter, Also the calculation of filters suggests that linear-phase alignments are a better choice. Especially where the interleave function is of high amplitude, minimum-phase functions find it problematic to track the extreme ripples
cess therefore improves the cosmetic appearance of the display and offers a response that is more realistic and acceptable to interpretation. Two examples of frequency response weighting were presented and the linear and minimum-phase responses illustrated by way of examples. It is suggested that these two forms of equalization are particularly effective at correcting minor defects in music recordings. Finally, a section was presented on loudspeaker crossover des!gn, where a generalized design technique was followed. In particular, two approaches based upon zero-phase Butterworth prototype filters were presented and both linear-phase and minimum-phase realizations discussed. It was shown with DSP thai arbitrary slope filters can be implemented and that with the use of a
in the response, Fig. 16 shows an example of a linear-phas e sinusoidal interleave alignment. It is interesting to observe the upper envelope of the low-pass and high-pass functions as these give a better measure of the attenuation characteristic. The low-pass and high-pass prototype filters had - 6-dB break frequencies of 2 kHz and 4 kHz yielding a crossover nominally at V_ kHz with respective filter slopes of - 30 dB per octave and 30 dB per octave,
raised-cosine waiting function and overlapping filter responses, high rates of attenuation in the stopband could be retained if desired. Finally, consideration was given to a new class of interleave crossover alignments, where either a stochastic or a sinusoidal interleave sequence was superimposed upon the lower crossover interference bound such that the cancellation effects in the transition region are dispersed over a wider bandwidth. It is believed that this will offer advantages for broad-band sig-
6 CONCLUSION
so
.
._
.
..........
Thispap rhase.,oreda.um of iL!iiJliiJ envelope function i envdes'!_ ........ .... ii
aim has beenand to minimum-phase demonstrate the signal tools processing. and transforms linear-phase The
_
that can be used *to compute exact impulse
_ 0
sequences
directly fr°m their amplitude response descripti°ns using minimum-phase theory. The results were presented as time-domain sequences, CDS displays, and ETC responses. . The use of two-dimensional convolution masks was shown to impr°ve the presentation of a CDS. Ordersup to seven have been calculated, and their effect on a typical COS is described. These modified COS displays were applied to both directly measured and minimumphase derived impulse responses. The method of presenting only the minimum-phase data was offered as an aid to analyzing loudspeaker performance as it biases the displayeddata more closelyto those performance attributes of subjective significance by effectively ignor ing the excess-phase distortion. From measurements takenfroma numberof loudspeakers, it hasbeenshown that much of the time-domain dispersion is phase distortion, which typically results from the incorporation of an analog all-pass crossover alignment. However, it is
-
j
I
i ilii! .... pos't_i ;'_;'_ !
i _ _::i_.^
'
: ! i '!:: ii::i::
i:: ii i iiiii
Ii
:;
11
_t?._._
i .--i--_--L!.i_._
iJi_¢ _j j[ i :i i i i!_'lfigh-paSSfilter_ ii i i :_ :_i!_ Iow-p_f'd_r i i i ii_iii _ _ ; _'_ _ i _:_ _'iii '{ ::
-s0......_--;-._-_-',_.r,_ i iiiii!i _. _---_-)?_-_ i ! i'/!iiii_......_.-_-i i_!;ii?_ -_-_-_........ _ i _--.,._. !!ii i iii!!ii;;i ;i 71;iiiiiii i i ;i{ii;ii{i i i [iil :_ } i !i}i_ii i/i ! i_iiiil _i i i ii!iil i: i: i: !ii ! ! ! !![[_! '_/ i ; _ii[;! ::: i [ ! iiii[l ,/_ i _i'ili_i i ii iiiiii_iiiii i i i ili -i !!!!::ili/ ...... _; _ _;_ ...... "_0' _0_ ,0_ _0' ,0_ (a) 0._5.............................................................................................. ! / o3 ......................................................................................... ! Iow-pass impulse Ii! 0.:,5............................................................................................ ] / _ '0._ _----J_-,-._J--',J- -_.'_-_-v '_t-il : 0._,.......................................................................... i............... ii 0._............................................................................ i............... high-pass impulse
suggested
that although
the excess-phase
information
0.o_.......................................................................... _...............i
has been extracted, it should not necessarily be ignored, but consideredas'a separateperformancemeasureand
_ _
possibly minimum-phase The ETC observed display distortion.°n was a dedicated consideredCDS where that the excludes normally the occurring precursor response was illustrated. It was shown that minimum-phaseprocessing applied to the
_-0.o_.0., iiiiiiii ii iil iiiiiiiiiiii![iiiiii iiii iliJiiill iiiljliljll IIIII'IIIII_-,,,II iJlJiillI. i i i -o._% _0 - mo ,_0 _o _o (b)
ETC could maintain the same spectral envelope while eliminating the apparent noncausal behavior. The pro-
Fig. 16. (a) Linear-phase sinusoidal interleave crossover alignment. (b) Precursor impulse response of LPF and HPF.
52
0--_
i
........ _
:- - -J-'_: .......... _ i i
i \i
J. Audio Eng. Soc., VoL 45, No. 1/2, 1997 January/February
PAPERS
nals such as music, especially sponse is unaffected.
LOUDSPEAKER EVALUATIONAND CROSSOVER DESIGN
as the on-axis target re-
7 ACKNOWLEDGMENT I wish to thank Joachim Gerhard of Audio Physic, Germany, for introducing me to the psychoacoustic characteristic described in Section 5.2. Also thanks go to Brian Elliott, Paid Alto, CA, for his many hours of encouragement and insight into the finer details of loudspeaker measurement and active loudspeaker systems. 8 REFERENCES [ 1] J. Borwick, Loudspeaker and Headphone Handbook, 2nd ed. (Butterworth-Heinemann, 1994). [2] S. P. Lipshitz and J. Vanderkooy, "In-Phase Crossover Network Design," presented at the 74th Convention of the Audio Engineering Society, J. Audio Eng. Soc. (Abstracts), vol. 31, p. 969 (1983 Dec.), preprint 2051. [3] R. H. Small, "Constant-Voltage Crossover Network Design," J. Audio Eng. Soc., vol. 19, pp. 12-19 (1971 Jan.). [4] P. Garde, "All-Pass Crossover Systems," J. Audio Eng. Soc. (Engineering Reports), vol. 28, pp. 575-584 (1980 Sept.). [5] M. O. J. Hawksford, "Asymmetric All-Pass Crossover Alignments," J. Audio Eng. Soc. (Abstracts), vol. 41, pp. 123-134 (1993 Mar.). [6] S. H. Linkwitz, "Active Crossover Networks for Noncoincident Drivers," J. Audio Eng. Soc., vol. 24, pp. 2-8 (1976 Jan./Feb.). [7] R. Greenfield and M. O. J. Hawksford, "Efficient Filter Design for Loudspeaker Equalization," J. Audio Eng. Soc., vol. 39, pp. 739-751 (1991 Oct.). [8] 'J. A. Deer, P. J. Bloom, and D. Preis, "Perception of Phase Distortion in All-Pass Filters," J. Audio Eng. Soc., vol. 33, pp. 782-786 (1985 Oct.). [9] R. Greenfield and M. O. J. Hawksford, "The Audibility of Loudspeaker Phase Distortion," presented at the 88th Convention of the Audio Engineering Society, J. Audio Eng. Soc. (Abstracts), vol. 38, p. 384 (1990 May), preprint2927. [10] B. Thei[3, J. Gerhard, and M. O. J. Hawksford, "Loudspeaker Placement for Optimised Phantom Source Reproduction," presented at the 100th Convention of the Audio Engineering Society, J. Audio Eng. Soc. (Abstracts), vol. 44, p. 647 (1996 July/Aug.), preprint 4246. [1 I] R. M. Heylen and M. O. J. Hawksford, "Interpolation between Minimum-Phase and Linear-Phase Frequency Responses," presented at the 98th Convention of the Audio Engineering Society, J. Audio Eng. Soc. (Abstracts), vol. 43, p. 399 (1995 May), preprint 3994. [12] A. Rimell and M. O. J. Hawksford, "DigitalCrossover Design Strategy for Drive Units with Impaired and Noncoincident Polar Characteristics," presented at the 95th Convention of the Audio Engineering Society, J. Audio Eng. Soc. (Abstracts), vol. 41, p. d. Audio Eng. Soc., Vol. 45, No. 1/2, 1997 January/February
1065 (1993 Dec.), preprint 3750. [13] J. Blauert, Rdumliches H6ren (Hirzel Verlag, Stuttgart, Germany, 1985. English version, Spatial Hearing MIT Press, Cambridge, MA, 1983). [14] R. 'Chalupa, "A Subtractive Implementation of Linkwitz-Riley Crossover Design," J. Audio Eng. Soc. (Engineering Reports), vol. 34, pp. 556-559 (1986 July/Aug.). [15] M. O. J. Hawksford, "A Family of Circuit Topologies for the Linkwitz-Riley (LR-4) Crossover Alignment," presented at the 82nd Convention of the Audio Engineering Society, J. Audio Eng. Soc. (Abstracts), vol. 35, p. 391 (1987 May), preprint 2468. [16] S. P. Lipshitz and J. Vanderkooy, "Use of Frequency Overlap and Equalization to Produce High-Slope Linear-Phase Loudspeaker Crossover Networks," J. AudioEng. Soc., vol. 33, pp. 114-126 (1985 Mar.). [17] B. Hillerich, "Acoustic Alignment of Loudspeaker Drivers by Nonsymmetrical Crossovers of Different Orders," J. Audio Eng. Soc., vol. 37, pp. 691-699 (1989 Sept.). [18] S. P. Lipshitz and J. Vanderkooy, "A Family of Linear-Phase Crossover Networks of High Slope Derived by Time Delay," J. Audio Eng. Soc., vol. 31, pp. 2-20 (1983 Jan./Feb.). APPENDIX 1 LIST OF MATHEMATICAL
OPERATORS
The following mathematical operators are used in the text and derived from the MATLAB family: abs angle conj conv conv2 exp fft hankel hilbert ifft imag mesh log ones(n) zeros(n) ./ -. x.^y
absolute value of a vector vector representing the phase of a cornplex vector generates a complex conjugate vector one-dimensional convolution of two vectors two-dimensional convolution of two square matrices returns vector representing a complex exponential of a vector fast Fourier transform of a vector createsa Hankelmatrix returns Hilbert transform: real part input vector, imaginary part Hilbert transform inverse fast Fourier transform returns a vector that reads the imaginary part of a complex vector produces a three-dimensional plot of a two-dimensional matrix returnsa vector that is the natural logarithm of a Vector unit vector of length N elements zero vector of length N elements element-by-element division of two vectors element-by-element multiplication of two vectors elements ofvectorxraisedtoapowery 53
HAWKSFORD
PAPERS
APPENDIX 2 MATLAB CROSSOVER
DESIGN PROGRAM
LISTING
[START]
dB/octave I I Psycho-filter yes/no
I
I
,...
I I
Butterworth Minimum
I
phase I
I
I
I I
ButterworthModified I I
,.._orL._ I I _°'_' I L+R or L-R I
Composite !
I _b_,--el I_,_I
I L_b_'e"' I6_ I
!
!
i_br_,-_,16_ I I_r_'*"'l 6_I !
crN°sO°ver
!
[HFbreaklfrequencyl I
2kHz
I
2kHz[
i L_s,o, i _0i i _,o. i _0i I I_,_._v_ _'°" I _0 I _'°_,_ve I_ol I_nterl""'_e _-_omor_,ne t ."_'_'_°_'nel_ndow 1"1 I dB/octave I
-
dB/octave I
!
!
[HFbrea_frequencYl I
!
I
I"_d°m I
I S'neI
!
I
I_'"*e_"_l _k_l I_'-*_"_l _k_l !
!
!
I
I
'
I Number of cycles in interleave bandwidth
I
I
I I
s
I
I
I I _I_A_ I COMPUTE I
!
% Loudspeaker digital crossover design program home; clear; close; fprintf('LOUDSPEAKER CROSSOVER DESIGN PROGRAM:Xn'); fprintf('(hints given as guide for parameter values):_n'); % fs, sampling rate fs=44100; % mv CDS orientation mv=[30,-30]; ,
54
% cm, ch CDS matrix size cm= 150; ch=80; J. Audio Eng. Soc., VoL 45, No. 1/2, 1997 January/February
PAPERS
LOUDSPEAKER EVALUATIONAND CROSSOVER DESIGN
% m, vector length m=4096; mm=l :m; m2=rn/2; ml=fs/m; mh=m2*ml; mx=ml:ml:mh; rx=l :m2;
% number of samples in impulse plots n=50; nn= 1:n; pq= 1;
% cm3:3 by 3 convolution mask cml=l; cm2=[1 1;1 1]/4; cm3=conv2(cm2,cm2); cm3=cm3/(sum(sum(cm3))); cm4=conv2(cm3,cm3); cm4=cm4/(sum(sum(cm4))); cm5=conv2(cm4,cm4); cmS=cmS/(sum(sum(cm5))); cm6=conv2(cm5,cm5); cm6=cm6/(sum(sum(cm6))); cm7=conv2(cm6,cm6); cm7=cm7/(sum(sum(cmT)));
% Filter tailoring fprintf('XnTAiLOR FILTER RESPONSEXn'); % Modify equalizer slope as N dB/octave / crossover filter fprintf('XnEnter modified equalization characteristic in dB/octave'); Nx=input('Enter slope: '); nj=Nx/(20*logl0(2)); fj=(ml*mh)^.5; a=(mx/fj).^nj; al=a/2; ah=a/2; xm=l; fprintf('XnEnter: 0 no psycho filter, 1 psycho filter: '); filt=input('Select additional filter type: '); np=ml* fix(3000/ml); if tlt== 1 aj=[-2.5*log 10((ml:ml:np)/3000) 6.4'1og 10((np+ml:ml:mh)/3000)]; aj=aj-(aj (m2)+min(aj))/2; aj=(10*ones(size(l:m2))).^(aj/20); a=a.*aj; clear aj; end; fprintf('XnXover: 0 none, 1 Butt (min phase), 2 modified Butt'); filt=input('Select mode: '); filt=abs(filt); if tilt>0 fprintf('XnComposite minimum phase: Enter 1 for (L + H), 2 for (1- H) )'); qq=input('Select mode: '); if qq==2 pq=-l; end home fprintf('XnDetne LF fndB break level: (eg n = 3 means f3dB)'); ncl=input('LF: n dB (eg 6 dB): '); ncl=10A(abs(ncl)/20); fprintf('XnDefine HF fndB break level: (eg n = 3 means f3dB)'); nch=input('HF: n dB (eg 6 dB): '); nch=10A(abs(nch)/20); fprintf('XnEnter prototype low-pass Butterworth fndB break frequency:'); xl=input('Frequency in kHz (eg 4 kHz): '); xol=fix( 1000*xl/ml); fprintf('_Enter prototype high-pass Butterworth fndB break frequency:'); xh=input('Frequency in kHz (eg 2 kHz): '); xoh=fix(1000*xh/ml); fprintf('XnEnter LF xover-filter slope in dB / octave:'); ordl=input('Filter slope (eg 30 dB /octave): '); ordl=abs(ordl/(20*logl0(2))); fprintf('XnEnter HF xover-filter slope in dB / octave:'); ordh=input('Filter slope (eg 30 dB / octave): '); ordh=abs(ordh/(20*log 10(2) )); xm=fix((xol*xoh)^.5); xofl=ml*xol/(ncl^(2/ordl)- 1)^.5; xofh=ml*xoh*(nch^(2/ordh)- 1)^.5; if tilt ==2 fprintf('XnEnter raised-cosine transition window'); win=input('Number (even) of samples (eg 100): '); win=2*abs(fix(win/2)); if (xm-win/2)< 1 win=win-(xm-win/2)- 1; end; end al=a./( 1+(mx/xofl).^2).^(ordl/2); ah=a.* (((mx/xofh).^2)./( 1+(mx/xofh).^2)).^(ordh/2); home J. Audio Eng. Soc., Vol. 45, No. 1/2, 1997 January/February
.-
55
HAWKSFORD
PAPERS fprintf('FILTER INTERLEAVE PARAMETERS_n'); fprintf('Enter 1 for random, 2 for sinusoidal interleave mode_'); im=input('Interleave mode: '); im=abs(im); fprintf('_Total interleave bandwidth, kI-Iz_'); bw=input( 'Bandwidth (eg 4 kHz): '); bw=abs( 1000*bw/ml); centre=(xol*xoh) ^.5; ibh=.5*(bw+(bw^2+4*centre^2)^.5); ibl=centre^2/ibh; ibl=ceil(ibl); ibh=ceil(ibh); if ibh>m2 ibh=m2; end fprintf('_Total smoothing bandwidth for interleave function kI-Iz_'); wm=inpfit('Bandwidth (eg 8 kHz): '); wm=abs(1000*wm/ml); c 1--wm+ibh-ibl; c2=ibl*ibh; h=.5'(c1+(c1^2+4'c2)^.5); l=c2/h; h=ceil(h-.5); l=ceil(1); if h>m2 h=m2; end wml=ibl-1; wmh=h-ibh; wu=(1 :wml)/(wml+ 1); wd=(wmh:- 1:1)/(wmh+ 1); winr=[zeros(size(l:l~l)) wu ones(size(ibl:ibh)) wd zeros(size(h:m2-1))]; home if im== 1 fprintf('RANDOM INTERLEAVE CROSSOVER PARAMETERS_'); fprintf('LnSpectral noise ripple in dB relative to 0 dB:'); fprintf('_(Enter negative number for reduced level)'); rip=input('Noise ripple dB (eg 0 dB): '); nrip=10A(rip/20)*winr; rd=rand(1,m2); rd=rd-mean(rd); rd=rd/max(abs(rd)); nl=.5*abs(ones(size(rx))+nrip.*(abs(al-ah)-rd)); nh=.5*abs(ones(size(rx))+nrip.*(abs(al-ah)+rd)); else fprintf('SINUSOIDAL INTERLEAVE CROSSOVER PARAMETERS_'); fprintf('_Sinusoidal amplitude ripple in dB relative to 0 dB:'); fprintf('_(Enter negative number for reduced level)'); rip=input('Spectral sinusoidal ripple dB (eg 0 dB): '); nrip=10A(rip/20)*winr; fprintf('_Enter number of cycles in interleave bandwidth:'); nc=input('Number of cycles (eg 5 cycles): '); nc=ceil(abs(nc)/log 10(ibh/ibl)*log 10(h/1)/log 10(ibbJibl)-;5)/log 10(h/1)*log 10(ibh/ibl); sd=sin(2*pi*nc*log 10(rx/ibl)); nl=.5*abs(ones(size(rx))+nrip.*(abs(al-ah)-sd)); nh=.5*abs(ones(size(rx))+nrip.*(abs(al-ah)+sd)); end al=al.*nl; ah=ah.*nh; if flit == 2 . wl=[ones(size(1 :xm-win/2)), .5*( 1+cos(pi*( 1:win)/win)), zeros(size(1 +xm+win/2:m2))]; wh=ones(size(1 :m2))-wl; mal=al+(a-al-ah).*wl; mah=ah+(a-al-ah).*wh; al=mai; ah=mah; clear mal mah; end, end if tilt==0 al=a; ah=a; end a=[a fliplr(a)]; al=[al fliplr(al)]; ah=[ah fliplr(ah)]; clc; home fprintf('COMPUTING DATA'); if tilt>0 if qq==2 fprintf('XnComposite minimum phase= {low - high}') else fprintf('XnComposite minimum phase = {low + high}') end, end % linear-phase impulse response linl=real(ifft(al)); linh=real(ifft(ah)); lina=real(ifft(a)); lsct=linl+linh; % minimum-phase impulse responses, non-composite minl=real(ifft(exp(conj (hilbert(log(al)))))); minh=pq*real(ifft(exp(conj (hilbert(log(ah)))))); mina=real(ifft(exp(conj (hilbert(log(a))))));
56
equalised
d.AudioEng.Soc.,Vol.45,No.1/2,1997January/February
PAPERS
LOUDSPEAKER
EVALUATION
AND CROSSOVER
DESIGN
% minimum-phase composite equalised impulse responses meqf=a./abs(fft(minl+minh)); meqt=real(ifft(exp(conj (hilbert(log(meqf)))))); minl=[conv(minl(l:m2),meqt(l:m2)),O]; minh=[conv(minh( 1:m2),meqt(1 :m2)),O]; msct=minl+minh;
,
% linear-phase composite lsum=abs(fft(linl+linh));
sum amplitude response
% linear-phase composite ldif=abs(fft(linl-linh));
difference amplitude
% minimum-phase equalized msum=abs(fft(minl+minh)); mal=abs(fft(minl)); mah=abs(fft(minh));
response
amplitude responses
% Commence plot routine % select plot mutines nn= 1:n; ds=O; while ds< 1 home fprintf('SELECT GRAPHICS:ha'); fprintf('haLFlinear-phase impulseresponse fprintf('haHFlinear-phase impulseresponse fprintf('haLF minimum-phase impulse response fprintf('haHF minimum-phase impulse response fprintf('haLinear-phase composite impulse response fprintf('haMinimum-phase composite impulse response fprintf('haLinear-phase energy-time 'curve fprintf('haMinimum-phaseenergy-time curve fprintf('haCDS LF minimum-phase impulse (logarithmic) fprintf('haCDS HF minimum-phase impulse (logarithmic) fprintf('haCDS Composite minimum-phase impulse (logarithmic) fprintf('haCDS LF linear-phase impulse (logarithmic) fprintf('haCDS HF linear-phase impulse (logarithmic) fprintf('haCDS Composite linear-phase impulse (logarithmic) fprintf('haMinimum-phasefourier transform fprintf('haLinear-phasefouriertransform fprintf('haComposite frequency response with polar scan fprintf('haTerminate program ds=input('Select display option number 1 to 18: ds = '); ds=abs(ds); home % fprintf('haVARIABLES: % fprintf('haVARIABLES:
1 '); 2 '); 3 '); 4 '); 5 '); 6 '); 7 '); 8 '); 9 '); 10 '); 11 '); 12 '); 13 '); 14 '); 15 '); 16 '); 17 '); 18');
xl, xh, a, al, ah, linl, linh, mina, minl, minh'); lsct, msct, meqf, meqt, a, lina, lsum, ldif, msum, mdif_');
% LF linear-phase impulse response if ds== 1 fprintf('Composite frequency responseha') n=input('Enter number of samples in display (eg 200): 3; n=ceil(abs(n))/2; nn= 1:n; hold on; grid on lins=[linl(m-n+l:m),linl(l:n)]; plot(l:2*n,lins(l:2*n)) title('Low-pass filter linear-phase impulse response') hold off pause; close; home end % HF linear-phase impulse response if ds==2 fprintf('Composite frequency responseha') n=input('Enter number of samples in display (eg 200): '); n=ceil(abs(n))/2; nn=l :n; hold on; grid on lins=[linh(m-n+ 1:m),linh(1 :n)]; :g :g plot(l:2n,lins(l:2n)) title('High-pass filter linear-phase impulse response') hold off; pause; close; home end J. Audio Eng. Soc., Vol. 45, No. 1/2, 1997 January/February
57
HAWKSFORD
PAPERS
% LF minimum-phase impulse response if ds==3 fprintf('Composite frequency responsekn') n=input('Enter number of samples in display (eg 200): '); n=ceil(abs(n)); nn= 1:n; hold on; grid on plot(nn,minl(nn)) title('Low-pass filter minimum-phase impulse response') hold off pause; close; home end % HF minimum-phase impulse response if ds==4 fprintf('Composite frequency responsekn') n=input('Enter number of samples in display (eg 200): '); n=ceil(abs(n)); nn=l:n; hol d on; grid on plot(nn,minh(nn)) title('High-pass filter minimum-phase impulse response') hold off; pause; close; home end % Linear-phase composite impulse response if ds==5 fprintf('Composite frequency response'm) n=input('Enter number of samples in display (eg 200): '); n=ceil(abs(n)); nn= 1:n; hold on; grid on lins=[lsct(m-n+ 1:m),lsct(1 :n)]; plot(l:2*n,lins(l:2*n)) title('Linear-phase composite impulse response'_) hold off; pause; close; home end % Minimum-phase composite impulse response if ds==6 fprintf('Composite frequency responseS') n=input('Enter number of samples in display (eg 200): '); n=ceil(abs(n)); nn=l :n; hold on; grid on plot(nn,msct(nn)) title('Minimum-phase composite impulse response') hold off; pause; close; home end % Linear-phase energy-time curve if ds==7 etn=input('Enter number of samples to display: '); etn=ceil(abs(etn)); if etn>m2 etn=m2; end dis=input('Enter: 1 for LPF, 2 for HPF or 3 for composite: '); if dis== 1 ett=hilbert(linl); elseif dis==2 ett=hilbert(linh); else ett=hilbert(lsct); end; home off=30; ett=ett./max(abs(ett)); [p1,p2]=max(abs(ett)); of=off-p2; if of< 1 off=p2+ 1; of=l; end; et(1 :of+ 1)=ett(m-of:m); et(of+2:m)=ett(1 :m-of- 1); clear ettp 1 p2 of; % take minimum phase of envelope of energy-time curve fa=abs(fft(abs(et))); ett=real(ifft(exp(conj (hilbert(log(fa)))))); ett=ett./max(abs(ett)); clear fa; [p1,p2]=max(abs(ett)); of=off-p2; if of< 1 of=l; end; 58
J. Audio Eng. Soc., Vol. 45, No. 1/2, 1997 January/February
PAPERS
LOUDSPEAKER EVALUATIONAND CROSSOVER DESIGN
etm(l :of+l)=ett(m-of:m); etm(of+2:m)=ett(l:m-of- 1); clear ett pi p2 of; hold on if dis== l title('LPF (linear phase): ET-C (red), min. phase of ET-C (green)') elseif dis==2 title('HPF (linear phase): ET-C (red), min. phase of ET-C (green)') else title('Composite (linear phase): ET-C (red), min. phase of ET-C (green)') end plot(1 :etn,abs(et(1 etn))/max(et)+ones(size(1 :etn)), r') plot( 1:etn,abs(etm( 1:etn))/max(etm),'g') grid; hold on; pause; close end
% Minimum-phase energy-time curve if ds==8 etn=input('Enter number of samples to display: '); etn=ceil(abs(etn)); if etn>m2 etn=m2; end dis=input('Enter: 1 for LPF, 2 for HPF or 3 for composite: '); if dis== 1 ett=hilbert(minl); elseif dis==2 ett=hilbert(minh); else ett=hilbert(msct); end; home off=30; ett=hilbert(msct); ett=ett./max(abs(ett)); [p 1,p2]=max(abs(ett)); of=off-p2; if of< 1 off=p2+ 1; of=l; end; et(1 :of+ 1)=ett(m-of:m); et(of+2:m)=ett(1 :m-of- 1); clear ett p 1 p2 of; % take minimum phase of envelope of energy-time curve fa=abs(fft(abs(et))); ett=real(ifft(exp(conj (hilbert(log(fa)))))); ett=ett./max(abs(ett)); clear fa; [p 1,p2]=max(abs(ett)); of=off-p2; if of< 1 of=l; end; etm(1 :of+ 1)=ett(m-of:m); etm(of+2:m)=ett( 1:m-of- 1); clear ett p 1 p2 of; hold on if dis== 1 title('LPF (minimum phase): ET-C (red), min. phase of ET-C (green)') elseif dis==2 title('HPF (minimum phase): ET-C (red), min. phase of ET-C (green)') else title('C0mposite (minimum phase): ET-C (red), min. phase of ET-C (green)') end plot(1 :etn,abs(et(1 :etn))/max(et)+ones(size(1 :etn)),'r') plot( 1:etn,abs(etm(1 :etn))/max(etm),'g') grid; hold off; pause; close end
% set order of 2-D filter mask if ds>8 if ds< 15 cx=input('Enter 1 to 7 for order of 2-D filter mask: '); if cx==2 cmx=cm2; elseif cx==3' cmx=cm3; elseif cx==4 cmx=cm4; J. Audio Eng. Soc., Vol. 45, No. 1/2, 1997 January/February
_
59
HAWKSFORD
PAPERS elseif cx==5 cmx=cm5; elseif cx==6 cmx=cm6; elseif cx==7 cmx=cm7; else cmx=cm 1; end; end; end; % CDS LF minimum-phase impulse (logarithmic) if ds==9 ra=input('Enter vertical range (nearest decade) in dB: '); ra= 10*ceil(abs(ra)/10); cd=20*log 10(abs(fft(hankel(minl(1 :cm))))); cx=conv2(cd,cmx); cx=cx-max(max(cx))+ra; cx=.5* (cx+sign(cx).*cx)-ra; mesh(cx( 1:ch, l :cm)',mv) title('CDS LF minimum-phase impulse (logarithmic)') pause; close; home clear cd cx cmx; end % CDS HF minimum-phase impulse (lOgarithmic) if ds== l0 ra=input('Enter vertical range (nearest decade) in dB: '); ra= 10*ceil(abs(ra)/10); cd=20*log t 0(abs(fft(hankel(minh(l :cm))))); cx=conv2(cd,cmx); cx=cx max(max(cx))+ra; cx=.5*(cx+sign(cx).*cx)-ra; mesh(cx( 1:ch, 1:cra)',m¥) title('CDS HF minimum-phase impulse (logarithmic)') pause; close; home clear cd cx crux; end % CDS Composite minimum-phase impulse (logarithmic) if ds== l l ra=input('Enter vertical range (nearest decade) in dB: '); ra=10*ceil(abs(ra)/10); cd=20*log i 0(abs(fft(hankel(msct(-I :cra))))); cx=conv2(cd,cmx); cx=cx-max(max(cx))+ra; cx=.5*(cx+sign(cx).*cx)-ra; mesh(cx(1 :ch, 1:cm)',mv) title('CDS Composite minimum-phase impulse (logarithmic)') pause; close; home clear cd cx cmx; end % CDS LF linear?hase impulse (logarithmic) if ds== 12 ra=input('Enter vertical range (nearest decade) in dB: '); ra= 10*ceil(abs(ra)/10); cd=20*log 10(abs(fft(hankel(linl( 1'cra))))); cx=conv2(cd,cmx); cx=cx-max(max(cx))+ra; cx=.5*(cx+sign(cx).*cx)-ra; mesh(cx(1 :ch, 1:cm)",mv) title('CDS LF linear-phase impulse (logarithmic)') pause; close; home clear cd cx cmx; end % CDS HF linear-phase impulse (logarithmic) if ds==13 ra=input('Enter vertical range (nearest decade) in dB: '); ra=10*ceil(abs(ra)/10); cd=20*log 10(abs(fft(hankel (linh(1 :cm))!)); cx=conv2(cd,cmx); cx=cx-max(max(cx))+ra; cx=.5*(cx+sign(cx).*cx)-ra; mesh(cx( 1:ch, 1:cm)',mv)
60
J.AudioEng.Soc.,Vol.45,No.1/2,1997January/February
PAPERS
LOUDSPEAKER EVALUATION AND CROSSOVER DESIGN
title('CDS HF linear-phase impulse (logarithmic)') pause; close; home clear cd cx cmx; end % CDS Composite linear-phase impulse (logarithmic) if ds== 14 ra=input('Enter vertical range (nearest decade) in dB: '); ra= 10*ceil(abs(ra)/10); cd=20*log 10(abs(fft(hankel(lsct( 1:cm))))); cx=conv2(cd,cmx); cx=cx-max(max(cx))+ra; cx=.5*(cx+sign(cx).*cx)-ra; mesh(cx(1 :ch, 1:cm)',mv) title('CDS Composite linear-phase impulse (logarithmic)') pause; close; home clear cd cx cmx; end % Minimum-phase fourier transform if ds== 15 semilogx(mx,20*log 10(.00001*ceil(100000*mal(rx))),'g',mx,20*log 10(.00001*ceil(1 00000*mah(rx))),'r') hold on semilogx(mx,20*log 10(meqf(rx)),'w',mx,20*log 10(mal(rx)mah(rx))+50,'b',mx,20*log 10(msum(rx)),'y') grid ifqq==2 title('FT(minimum phase): y Ilow-highl, b Ilowl+lhighl, w IEQI, g Ilowl, r Ihighr) else title('FT(minimum phase): y Ilow+highl, b Ilowl-lhighl, w IEQI, g Ilowl, r Ihighl') end hold off; pause; close; home end % Linear-phase fourier transform if ds== 16 semilogx(mx,20* log 10(.00001 *ceil( 100000*al(rx))),'g',mx,20*log 10(.00001 *ceil( 10 0000*ah(rx))),'r') hold on semilogx(mx,20*log 10(ldif(rx))+50,'b',mx,20*log 10(lsum(rx)),'y') grid title('FT(linear phase): y Ilow+highl, b Ilowl-lhighl, g Ilowl, r Ihighl') hold off; pause; close; home end % Composite frequency response with polar offset if ds== 17 fprintf('Composite frequency response with polar offsetS') tx=input('Enter time-delay offset between drivers in ms (eg 0 to 1 ms): '); tx=tx* 1E-3; semilogx(mx,20*log 10(a(rx)),'r') title('Composite frequency response with polar offset') hold on; grid lpolar=abs(exp(i*pi*mm*tx).* fft(linl)+exp(-i*pi*mm*tx).* fft(linh)); semilogx(mx,20*log 10(lpolar(rx)),'y') hold off; pause; close; home end % Program terminate if ds== 18 ds=input('Select 0 for termination, 1 to continue: '); ds=abs(ds); if ds==0 home fprintf('\nProgram terminationAnXn') return end; end; ds=O; end; return %
J. Audio Eng. Soc., Vol. 45, No. 1/2, 1997 January/February
61
HAWKSFORD
PAPERS
THE AUTHOR
Malcolm Omar Hawksford is director of the Centre for Audio Research and Engineering, a professor in the Department of Electronic Systems Engineering at the University of Essex and postgraduate scheme director, where his interests encompass audio engineering, electronic circuit design; and signal processing. Professor Hawksford studied electrical engineering at the University of Aston in Birmingham where he gained a First Class Honours B.Sc. and Ph.D. His Ph.D. program, which was sponsored by a BBC Research Scholarship, investigated delta modulation and delta-sigma modulation (now cornmonly known as bitstream coding) for color television and also the development of a time-compression/time-multiplex system for combining luminance and chrominance signals (a forerunner of the MAC/DMAC system). While at Essex University, he has undertaken research principally in the fields of analog amplifiers, digital signal processing, and loudspeaker systems. Since 1982 research into digital crossover networks and equalization for loudspeakers has been pursued which has culminated in an advanced digital and active loudspeaker system being designed within the
62
_ university. Research topics have also encompassed oversampling and noise shaping techniques applied to analog-to-digital and digital-to-analog conversion, the linearization of PWM encoders, and 3-dimensional spatial audio and telepresence including multichannel sound reproduction. Professor Hawksford has published in the Journal of the Audio Engineering Society on topics that include error correction in amplifiers, oversampling techniques, and MLS techniques. His supplementary activities include writing contributions for Hi-Fi News and Record Review and Stereophil e magazine as well as designing high-end analog and digital audio equipment. He is a chartered engineer and is a fellow of the AES, the Institution of Electrical Engineers, and the Institute of Acoustics. He is a member of the technical committee of Acoustic Renaissance for Audio (ARA), a group currently promoting a system for storing multichannel, high-definition audio signals on high-capacity DVD optical disks. He is also technical adviser to HFN and Record Review and a technical consultant to LFD Audio, UK.
J.AudioEng.Soc.,Vol.45, No.1/2,1997January/February