Dilation Based Modeling of Perfusion Datasets. J. Rosiene. 1. , Ph. D., C. Imielinska. 2. , Ph. D, X. Liu. 2. , M.S. S. Keating. 1. , Ph.D. 1. Department Computer ...
Dilation Based Modeling of Perfusion Datasets
J. Rosiene1, Ph. D., C. Imielinska2, Ph. D, X. Liu2, M.S. S. Keating1, Ph.D. 1 Department Computer Science, Eastern Connecticut State University, Willimantic CT 2 Department of Biomedical Informatics, Columbia University, NY, NY Abstract A new approach to the modeling of the marker in Perfusion CT and Perfusion MR datasets is outlined and initial results given. The technique is based on estimation of the dilation and delay of an estimated bolus shape and a template fit to an new solution of the heat equation. Initial results are provided. Introduction The sequence of contrast enhanced images I ( x, y ) = I ( x, y , k ) where, x,y spatial position and k is the time index. A standard Fourier transform,
FFT : I ( x, y ) → Iˆ( x, y ) , centered about the maximum peak of the data per pixel highlights some structure in the image (Figure 1). The automated technique seeks a representative shape of the bolus and fits it to a parametric solution to the heat transfer equation, the goal being to represent the underlying mechanisms at work and increase the fidelity of perfusion imagery as a complement to CBF, CBV and TTP.[1] Method Standard techniques exist to localize events both in time and frequency that may be of value in the analysis. The first stage is to develop a model of the marker. The differential model being developed is: ut ( x, y , t ) = α ( x, y )[u xx ( x, y , t ) + u yy ( x, y, t )] + f ( x, y, t ) The modeling problem is to estimate the coupling to the voxel’s neighbors and the forcing function. A model of the forcing function allows for dilations and translations and attenuation of an estimated bolus shape
φ (t )
as:
f ( x, y, t ) = a ( x, y )φ ( s ( x, y )t − d ( x, y ))
, standard techniques can be used to fit this function to the data and estimate the parameters. A method of analysis to be employed is to compare the graphs of functions, h2 q , 0 ( s ), Re(s ) > 0, q ∈ {0} U Ζ + with graphs of Perfusion datasets. The functions h2 q , 0 ( s ) are developed in [2] but explicitly defined in [3]. Once a reasonable convergence of graphs, h2 q , 0 ( s ) ,
q , and some Perfusion dataset, is identified, then an association of h2 q , 0 ( s ) to for some
perfusion dataset physical phenomena will be attempted. A goal of this association is to produce a method of estimation.
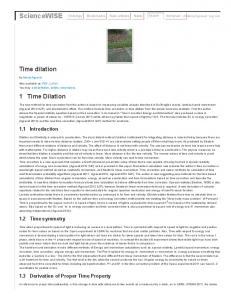
Figure 1: Images a,b,c,d are shows the progression of the marker at samples 4,16,32, 40. Images e shows the RGB image formed from the magnitude of the (0,1,2) frequency components of the FFT, f is the corresponding phase (frequencies 1,2,3). References [1] Axel L. Cerebral blood flow determination by rapid-sequence computed tomography: Theoretical analysis. Radiology. 1980;137:679-686 [2] Keating, S.F., “An infinite family of summation identities”, Proceedings of the American Mathematical Society, 130 (2002), no. 11, pp.34333437 MR1913024 (2003e:11047). [3] Keating, S.F., An infinite family of analytic functions that generalize the Gauss kernel satisfy the heat equation and are related to an infinite family of summation identities1
1
Submitted for publication.
AMIA 2005 Symposium Proceedings Page - 1098