of the spoke's endpoint. Other coordinate ... where Xik is the coordinate of point i on dimension k, d(i,j) is the .... prefer to look at the INDSCAL configuration in a.
Perception & Psychophysics 1983,34 (3), 257-267
Dimensional models for the perception of rectangles INGWER BORG
JustusLiebigUniversitat, Giessen, Federal RepublicofGermany and DETLEV LEUTNER
Rheinisch- Westfalische Technische Hochschule, Aachen, Federal RepublicofGermany Krantz and Tversky (1975), Takane (1981), Wender (1971), and others have suggested that it is impossible to explain similarity judgments for rectangles by a simple dimensional model of the Minkowski distance type, because the psychologically compelling dimensions are not independent and interact, For reasons never made explicit, the relevant dimensions were assumed to be area and shape, rather than width and height. Reanalyses show, however, that the latter dimensions, appropriately scaled, eliminate interaction effects. To test these conclusions empirically, an experiment was carried out with two sets of rectangles. Each set was a complete 4X4 design, one in width X height coordinates, and one in area X shape coordinates. For each stimulus set, 21 subjects judged the dissimilarities of all pairs of rectangles twice. All subjects were reliable. Apart from one extreme subject in each group, all data lead to very similar MDS solutions. These solutions correspond closely to the predictions, that is, they can be well approximated with physical width and height coordinates rescaled such that the units decrease increasingly as one moves away from the origin. No interaction effects are found, but some indications for a more complicated composition rule are observed.
One of the oldest problems in multidimensional psychophysics is the question of how similarity judgments on pairs of multiattribute stimuli can be explained. This question always consists of two major parts: (1) What are the dimensions the subjects attend to, and (2) what is the composition rule by which intradimensional differences are combined into overall judgments. The first question sometimes seems to have a trivial answer, as, for example, in the case of Shepard circles (circles of varying diameter with a "spoke" varying in angle), in which it appears that "size" and "angle" make up the dimensions. However, as Borg, Schonemann, and Leutner (1982) and Eisler (1980) have pointed out, one can also coordinatize Shepard circles in Cartesian systems by the (x,y) coordinates of the spoke's endpoint. Other coordinate systems. are also possible, of course, and one has thus to decide which one is most plausible. The class of figures to be considered in this paper consists of rectangles. For rectangles, it appears that only Cartesian systems offer reasonable dimensional models. A priori, it seems that the relevant dimen-
sions should be "width" and "height." It is interesting, however, that most authors (starting with Sixtl & Wender, 1964) have argued that other dimensions, "area" (width' height) and "shape" (width:height), are really what subjects attend to. The area x shape system is related to the width x height system by a 4S-deg rotation of the coordinate axes, and hence this coordinatization offers two models with special psychological properties. Once one has defined what the dimensions of the judgment model should be, one has to formulate a composition rule. This second fundamental question has attracted far more attention than the problem of choosing a dimensional system. (Cartesian systems were almost always assumed automatically.) From all possible composition rules, the Minkowski distance family is the only set of functions studied extensively. It was asked which of the various cases in this set was most appropriate or whether any of the conditions of this family were systematically violated such that none of these functions was adequate. In a Cartesian coordinate system, the Minkowski metrics are given by
This work was supported by Grant Bo S97IS from the Deutsche Forschungsgemeinschaft DFG. I. Borg's mailing address is: Fachbereich 06 Psychologie, Justus Liebig Universitat, OttoBehagel-Strasse 10, 6300 Giessen, Federal Republic of Germany.
where Xik is the coordinate of point i on dimension k, d(i,j) is the distance of points i and j, and p (p __ 1) is the parameter that characterizes the various cases of
257
Copyright 1983 Psychonomic Society, Inc.
258
BORG AND LEVTNER
this family. Beals, Krantz, and Tversky (1968) have given an axiomatization of this model, that is, an axiomatization that is based on interpreting Formula 1 as a composition rule in the sense that the subject generates distance d(i,j) by adding intradimensional differences over dimensions. Empirically, what is given, of course, is a set of dissimilarity judgments, taken as estimates for the distances d(i,D, which in turn are to be explained by the additive difference formula in Formula 1 with fixed dimensions. It is quite obvious from Formula 1 that this is possible only if the distances are "decomposable" into independent dimensional differences. More generally, Beals et a1. (1968) show that the following decomposability condition must hold:
(2)
where F is a strictly monotonically increasing function in each of its arguments, and each f k satisfies fk(xik,Xjk) = fk(xjkJxik) > fk(xikJxik) = fk(xjkJxjJ = O. Loosely speaking, this simply means that each dimension contributes its share to the overall distance judgment d(i,D independently of how i and j differ with respect to other dimensions. It appears that Wender (1971) was the first to study decomposability or independence of dimensions for rectangles. He constructed rectangles in an area x shape coordinate system such that they formed a 2 x S rectangular grid in the design space. The dimensions were linearly calibrated. Wender found that the distance judgments on the stimuli did not satisfy decomposability: rectangles of constant area difference were systematically judged more dissimilar the wider the rectangles were. Hence, the dimensions interact in the sense that the contribution of, say, a constant area difference to d(i,D depends on the shape of the involved rectangles. If Wender's rectangles are represented in a width x height coordinate system, they do not form a rectangular grid anymore. With area and shape calibrated in linear units, the corresponding width and height coordinates do not result from a simple rotation of the coordinate system, but are given by width = (area/shape)'! and height = area/width, which are nonlinear mappings. It is therefore not surprising that the design grid gets distorted in such a way that the resulting distances are ordered just as Wender's subjects indicate in their similarity judgments. Thus, if the subjects did generate their judgments in a width x height dimensional system, they simply had to reo port distance relationships that appear as interactions in area x shape coordinates. Krantz and Tversky (197S) report the same finding for a similar study, in which rectangles were constructed in a log(area) x log(shape) and a log(width)
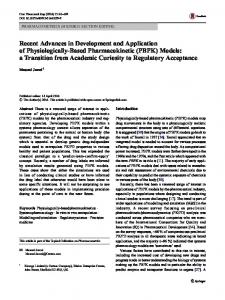
x log(height) coordinate system (Figure Ia). Their results have been partially replicated by Takane (1981). Massive interaction effects are found for the log(area) x log(shape) design, and very mild interactions are found for the stimuli in the log(width) x log(height) design. Figure 1b gives the MDS solution for the Krantz-Tversky data, where the interaction effects are evidenced by the fan-shaped form of the configuration. Apparently, the MDS configuration corresponds well to the design configuration with respect to those distances measured parallel to the log (width) and log(height) dimensions. For example, d(8,9), d{1S,17), and d(6,13) are all roughly equal, and hence there is no interaction effect between log (width) and log(height) that would be worth considering. The decomposability condition (2) allows for monotone distortions of the design space in the direction of the chosen dimensions (f functions). Each such distortion preserves the parallelism of lines parallel to the dimensions. Nonlinear distortions in
(b)
Fllure 1. (a) Upper panel: Deilin conflluntlon for Krantz· Tnnky (1975) reetanlle experiment. (b) Lower panel: MDS representation for dIulmllarity data.
PERCEPTION OF RECTANGLES
other directions, however, destroy this parallelism. Assume now that, in Figure la, one transforms the dimensions log(height) and log(width) by log", This leaves, for example, the lines through points 2,9,8 and 4,13,6 parallel, but increases the distance between points 7 and S relative to the distance between 1 and 3. The overall effect of taking out the logarithm along the height and width dimensions is that the rectangular design grid (Figure 1a) is distorted into a fan-shaped point pattern that is very similar to the MDS configuration in Figure 1b (Schonemann & Borg, 1981). The critical point is that the same transformation along the area and shape directions preserves and destroys other parallelisms: only rescaling the width and height dimensions transforms the design to close approximation of the MDS configuration. The configuration in Figure 1b was generated by Krantz and Tversky via an INDSCAL (Carroll & Chang, 1970) scaling of the' distances provided by previous ordinal MDS analyses of all individual data sets separately. (They report an average stress of 10070 for the individual scalings; no information on the variance is provided; no fit values are given for the INDSCAL results.) Krantz and Tversky's INDSCAL solution differs from Figure 1b in its orientation: the line from point 3 to point 7 lies approximately on the bisector of Figure 1b. Hence, the INDSAL coordinate axes correspond "roughly" to area and shape. By "roughly," Krantz and Tversky point to the fact that an area-shape interpretation is obviously not strictly correct, because the shape intervals grow as the area levels grow. Since rotations of INDSCAL solutions are algebraically inadmissible in general, it seems that it has indeed been shown that area andalthough in some way dependent-shape are the relevant dimensions. It is also interesting that the subject space shows considerable interindividual variance in the weights for the dimensions, because it is this variance that determines the uniqueness of the INDSCAL dimensions. However, it is often overlooked that this uniquness may be quite weak from a statistical point of view, that is, the differential weights may explain just a few percent addi. tional variance over an equal-weight model even if they differ considerably among the subjects (Borg, 1981; Borg & Lingoes, 1978/1982; Lingoes & Borg, 1978). Except for Helm's (1964) color data, in which the additional explained variance is 14070, we have not yet seen a case in which this value exceeded 3070. Since Krantz and Tversky neither publish any data nor report fit values for their INDSCAL solutions, there is no reason to assume any unusual circumstances that would prohibit rotations. We therefore prefer to look at the INDSCAL configuration in a width x height system, which does not require a complicated interaction theory for intuitively appealing dimensions, or the introduction of psychologically
259
"artificial" dimensions derived from a posteriori fittings of the design onto the MDS space (Schonemann, 1977). A further technical question is why the INDSCAL solution allows such an interpretation even though the procedure uses p=2 and not p= 1 in (1). (We think that p = 1 is appropriate here; see below.) A satisfactory answer is more difficult than for the rotation problem above. It is known that the euclidean metric (p = 2) is robust with respect to recovering a configuration defined by another Minkowski metric and even a semimetric (Shepard; 1974). On the other hand, there are cases (Borg et al., 1982) in which the specification of an inappropriate metric increases the solution dimensionality by curving the design plane. However, even then the predictions about the correspondence of design and MDS configuration could still be confirmed in a properly chosen projection plane. Since INDSCAL scales all individuals simultaneously, we assume that it is less prone to such peculiarities. The above seems to show that both the Wender and the Krantz-Tversky-Takane studies allow us to explain the observed interaction effects as a consequence of theoretically choosing the "wrong" dimensions: if subjects use width and height (linearly scaled) to form dissimilarity judgments via (1), then they simply have no choice but to report the fanning out of the distances built into the logarithmic design of the rectangles. Since the reported relations among the distances, as shown in the MDS solution, correspond almost exactly to those in the linearly rescaled design configuration, it is clear that a width x height system leads to a simple model of judgment in the sense of (1). Furthermore, because there exists no other evidence which rules out width and height as reasonable candidates for the dimensions of rectangle perception, we assume that they are the relevant ones. The arguments in favor of width and height as the relevant dimensions of a general theory seem more convincing than those for the particular scaling of their units. As shown above, linear units explain the interaction effects in Krantz and Tversky's paper and also in Takane's. For the Wender data, the same holds true for those individuals who exhibit interaction effects. For those who do not, logarithmic spacing is adequate. For unidimensional dissimilarity judgments on width and height, Wiener-Ehrlich (1978) reports regressions that show decreasing interval lengths as one goes away from the origin. These findings may indicate that the particular spacing of the units is influenced by the particular stimulus collection, by the experimental task, and by (somewhat arbitrarily) setting the physical origin equal to the psychological one. There are also interindividual differences. Moreover, the interaction effects for the average subjects can also be eliminated if mildly non-
260
BORG AND LEUTNER
linear functions are used in the transformations. If their rank orders, one finds that if the distances (in a one also considers psychophysical theory in general, fixed configuration) have the same rank order for it would appear premature to abolish the theory that p = 1 and p = 00, then they have the same rank order the metric physical width and height units are loga- for all ps (Wolfrum, 1976b). Even if the rank orders rithmically mapped into psychological units, al- are not invariant over all ps, there always exist interthough the transformation may be more linear and vals of p values for which this is the case. Within such better described by a power function or by individ- intervals, all metrics are strictly equivalent, but S ually different power functions. (+0) is not invariant, except in trivial cases. This is so The reanalyses therefore suggest that subjects because S does not simply count the mappings D(i,j) evaluate the similarity of rectangles according to (1) > D(k,l) - d(i,j) ~ d(k,l) that are violated, but also by attending to the dimensions of "width" and assesses how badly they are off, where D(i,j) is an "height." Rectangles that form a rectangular grid in empirical dissimilarity value and d(i,j) is the correthe physical width x height coordinate system should sponding MDS distance. Such quantitative assessnot show dimensional interaction effects. Expressed ments are extrinsic to the mapping task of ordinal differently, the only distortions of the design grid MDS. They involve purely algorithmic considerashould be due to dimensional rescalings. These tions and ad hoc tradeoff decisions. Hence, there are rescalings are expected to be slightly nonlinear so that scores of other loss criteria, such as the Guttmanphysically equal intervals in width and height (mea- Lingoes coefficient of alienation (Guttman, 1968; sured in centimeters) map into psychological inter- Lingoes, 1973), Johnson's (1973) absolute differvals that decrease as one goes away from the origin. ences measure, and Takane, Young, and DeLeeuw's For rectangles that form a rectangular grid in a 4S- (1977) SSTRESS. They all weight errors differently deg rotated "area" and "shape" coordinate system, and therefore identify, in general, different p values any nonlinear-and even any differential linear- as optimal (for S+O). For these and other reasons (see rescalings of the width and height axes destroy the also Borg, 1983), a p value that minimizes S does angles in the grid. Nonlinear transformations just that, and one should not read any further signifdestroy, in addition, certain parallelisms in a charac- icance into this observation. teristic manner. That is, lines parallel to the chosen dimensions remain parallel under such rescalings, but METHOD all other parallelisms vanish. The rectangles used in the following were constructed as shown In addition, we further expect that Model 1 fits in Figure 2. There are two sets of rectangles: the WH rectangles, best if p= 1, because there is ample evidence (e.g., which form the solid points in Figure 2, and the AS rectangles, Eisler & Roskam, 1977; Shepard, 1964; Torgerson, which form the open circles. The coordinates of the latter are gen19S8) that the city-block metric is the adequate dis- erated from the former by a clockwise 4S-deg rotation with a subtance function for "analyzable" stimuli, such as sequent translation upwards and towards the right. This translation shifts the points such that the grid lies within the lower half of rectangles. "Fits best" does not necessarily mean, the height x width system. Hence, no rectangle is higher than it is however, that the stress has to be lowest for p = 1. We merely require that the stress is acceptably low and, in particular, that the MDS configuration representing each subject's dissimilarity judgments on rectangles corresponds best (relative to other p values) .c to the design configurations in the way described j above. It has been asked why we do not want to search for that p value which minimizes stress (S) or, more theory oriented, why we do not want to predict that p= 1 is that value. We do not do this for mathematical reasons: it makes little sense to compare S values over different ps. One problem is that it is generally easier to minimize S for p + 2. If p < 2, S is least restrictive for p = 1; for p > 2, S is even less restrictive as p approaches 00 (Borg, 1981; Shepard, 1974). For m = 2, p = 1 and p = 00 impose the same restrictions width on S. (We will return to this point in the Discussion section.) Moreover, for m = 2, one obtains equal or almost equal S values for p = PI and p = P1 = Pl/(Pl -1) (Wender, 1969; Wolfrum, 1976a; Coombs, Note 1). Flpre 1. Deslan connpntlona. Tbe WH deslan Is tbe arid eon· Furthermore, if one ignores quantitative relation- Ilstlnl of loUd points and lolld lines. Tbe AS deslan Is tbe arid ships among the MDS distances and simply looks at made up of open circles and broken lines.
/
PERCEPTION OF RECTANGLES wide, so that optical illusions in the width-height relationship are reduced. It may be noted here that the AS rectangles do not truly form a rectangular grid in the area x shape system, because the height and width axes are calibrated in centimeters. Rotating the width x height system leads therefore to width + height and width - height dimensions. For a logged system, we would get log(width) + log (height) = log(width . height) = log(area) and log(width) -log (height) = log(width:height) = log(shape). Nevertheless, we use the AS terminology here, because it is suggestive and because we predict an approximate logarithmic (or similar power) transformation on the height and width dimensions, for which these names are strictly appropriate. For the set of rectangles in the AS and the WH designs, test booklets were made as follows. On the first page of the booklet, all 16 rectangles of the design were presented in solid dark gray. On each of the following pages, pairs of rectangles appeared in five rows. All 120 possible pairs were given twice in random order. A response sheet showed a graphical display of a 100point scale on top. The ends ofthis scale were termed "0 = equal, identical" and "9 = extremely different," The subjects had to write their numerical judgments in a set of 240 boxes on the response sheet. Forty-two subjects participated in the experiment. They were all beginning students in psychology at the R.W.T. Hochschule, Aachen. The response scale was explained in the instructions. It was pointed out that there were no incorrect judgments, but that each judgment would be asked twice and hence the reliability of each subject's answers could be checked. The subjects were then asked to first study the whole set of rectangles on page 1 of their test booklets for about 1 min and to identify for themselves those rectangles they believed to be most dissimilar. The dissimilarity ratings of the 240 pairs of rectangles took about 1 h, on the average. There were, however, considerable interindividual differences in the time subjects needed to complete the task. An interesting between-groups effect was also observed: the group with the AS rectangles needed substantially more time than the one with the WH stimuli.
RESULTS The reliabilities of the subjects, computed as product-moment correlations over the ratings of corresponding stimulus pairs, are given in Table 1. For both experimental groups, the average values are very similar. The WH subjects have r=0.75 with Sl =0.05; the AS subjects haver=0.76 with Sl =0.04. For no subject did the reliability warrant eliminating that subject from further analyses. Since no metric restrictions are placed on (2), we use ordinal MDS (Guttman, 1968; Kruskal, 1964; Shepard, 1962) and, specifically, the program KYST (Kruskal, Young, & Seery, Note 2) to scale each subject's data separately. (Stress form 1 is used, primary approach to ties, and p = 1, m = 2; the point coordinates from Figure 2 are the starting configurations.) The scalings lead to acceptably good data representations in all cases. The S values are given in Table 1. The average stress values (for both the WH and the AS groups) are almost exactly the same as the average S of 10070 reported by Krantz and Tversky (1975). All individual S values are below the SpenceOgilvie (1973) critical value for "random" configurations. Of course, this is not very important, because the critical Question really is whether the
261
Table 1 Reliabilities (pM Correlations) of all Subjects and Stress Values for Their Two-Dimensional MDS Solutions (City-Block Metric)
WH Group Subject Reliability 1 2 3 4 5 6 7 8 9 10 11 12 13 14 15 16 17 18 19 40 41 Average
.79 .69 .80 .88 .68 .83 .73 .78 .82
.72 .78 .69 .68 .59 .81 .68 .82
.77 .81 .66 .82 .75
AS Group Stress 8.6 12.1 8.2 5.7 11.3 7.3 8.1 7.8 9.5 15.7 5.9 14.3 7.2 11.4 8.7 12.7 10.6 15.1 9.7 11.8 9.9 10.1
Subject Reliability Stress 20 21 22 23 24 25 26 27 28 29 30 31 32 33 34 35 36 37 38 39 42
.63 .75 .76 .81 .87
.71 .87 .69 .71 .85 .78
.77
.73 .64 .66
.77
.77 .81 .84 .80 .77 .76
21.0 13.3 12.6 12.9 7.6 10.9 8.2 9.8 13.4 6.3 8.2 9.6 11.1 10.5 13.3 7.1 9.3 11.5 7.7 8.0 10.2 10.6
predicted configurations are "recovered" from the data, which has little to do with how high the S is (young, 1970). Since, as will be shown, these configurations are as predicted, it seems reasonable to interpret the obtained S values as essentially due to error in the data. This interpretation is corroborated by the fact that there are highly significant negative correlations between the reliabilities and the S values in Table 1 (r = - .50 for the WH group; r = -.66 for the AS group.) We now turn to the 21 subjects in the WH group. Studying the individual MDS configurations shows that 20 of them are extremely similar, differing only by small and unsystematic point variations from each other. Since the one maverick subject is just an extreme case (see below), we study the average data of all 21 subjects in the WH group. These data are given in Table 2. (It may be noted that scaling these data or the average data of the 20 highly similar subjects leads to almost indistinguishable configurations.) The MDS solution has an excellent S value of 5.4%. The Shepard diagram reveals a smooth and almost linear relationship between data and MDS distances. The grid in Figure 3 obviously corresponds very closely to the predictions. The coordinate axes are in the same orientation as the width and height dimensions relative to the design configuration in Figure 2. Because p = 1 was used, this orientation is fixed, since rotations change city-block distances. Remember that, from the results of the reanalyses, it was predicted
262
BORG AND LEUTNER Table 2 Dissimilarity Ratings for All Rectangle Pairs
4.33 6.12 7.21 2.38 4.52 6.00 7.76 3.36 5.93 6.71 7.88 3.69 5.86 7.36 8.36
2.05 4.07 5.62 5.76 2.52 4.52 6.21 6.14 4.24 5.60 6.31 6.98 4.55 5.88 7.02
2.64 2.12 3.24 7.12 5.48 3.38 4.40 7.14 6.07 4.29 5.48 7.98 6.64 4.55 5.86
3.31 2.71 1.79
4.93 4.71 5.40 6.36
7.57 6.86 5.21 3.12 8.10 6.93 5.90 5.00 8.45 7.17 6.79 5.40
4.10 6.10 6.83 2.00 5.00 6.86 7.83 2.60 4.86 6.93 7.57
4.60 4.43 4.36 4.88 4.19 3.43
4.31 4.69 5.07 5.83 3.17 4.31 5.45 4.71 2.81 4.50 5.55 5.95 2.88 4.50 5.86
4.00 6.52 5.43 2.64 4.43 7.69 5.40 3.50 4.52
5.79 4.98 4.24 4.31 4.57 3.93 3.43 7.71 5.67 5.21 2.69 7.86 6.50 5.55 3.50
6.50 6.40 6.93 7.14 3.52 4.12 5.64 5.55 4.38 6.26 7.21 1.60 4.14 5.95 6.86
6.55 5.98 6.29 6.52 3.79 3.57 4.07 4.45 2.86 3.60 5.83 4.31 1.19 3.95 5.17
6.19 5.81 5.98 5.71 3.69 3.74 3.48 3.71 4.45 2.86 3.60 6.95 3.79 1.48 3.71
5.52 5.71 5.71 5.79 4.95 3.60 2.98 3.64 5.79 4.17 3.31 7.43 5.88 4.60 1.62
8.00 8.14 8.17 8.67 6.33 6.62 7.26 6.95 4.14 4.50 5.52 5.95 4.17 6.07 7.07
6.98 6.95 7.40 7.69 5.67 5.76 5.83 5.98 3.02 3.48 3.83 5.17 2.38 4.02 5.26
6.79 6.76 6.76 7.17 5.29 5.31 5.64 5.24 3.00 3.05 3.40 3.88 4.29 2.64
7.14 6.79 6.71 6.40 4.69 4.90 5.26 5.00 4.57 3.17 2.50 3.55 5.43 3.81 2.74
3.45
Note-Row and column numbers correspond to rectangle numbers in Figure 2. Ratings averagedover all subjects and replications in WH group (lower half) and in AS group (upper half).
that this dimensional system would be the relevant one. It is not concluded a posteriori that width and height are the dimensions of rectangle perception, just because the city-block scaling led to this solution. Nor is the MDS solution constrained to come out in a certain substantively preferred orientation, as is sometimes necessary (Borg & Lingoes, 1980). Of course, had different orientation been obtained, it would have been appropriate to ask how strongly it had been determined, just as was done for the KrantzTversky INDSCAL solution above. (We note anyway
15
5
9
13
Fillare 3. MDS representation for WH data of Table 1.
that S more than doubles if one rotates the solution by just IS deg.) The predictions are also confirmed with respect to the lengths of the intervals on both dimensions. They do, indeed, decrease as one moves away from the origin. In other words, relative to the WH configuration in Figure 2, the grid is increasingly squeezed together as one moves to the right and to the top. To determine the exact form of this squeezing effect, the WH design grid in Figure 2 is transformed by power and logarithmic functions such that it optimally fits the MDS configuration in Figure 3. [The fitting was done dimensionwise by regression routine ZXSSQ of the IMSL package. The correspondence of the respective coordinates is measured by metric stress s (Roskam, 1972/1979), the normalized square root of the sum of squared errors with respect to each dimension.] Figure 4 shows the results. Note that the rescaling of the design grid was carried out along the width and height dimensions in Figure 2, with the MDS solution as a target configuration oriented in this design coordinate system just as in the empirically determined coordinate system in Figure 3. No rotation was allowed. It is obvious that both the power and the logarithmic functions transform the design WH configuration to a close match with the MDS configuration, but that the power transformation yields a slightly better fit. The additive factors represent translations of the origin, which should actually be interpreted as inverse translations for the coordinate system of the MDS solution, because the origin of the design dimensions is essentially fixed. The multiplicative factors are dimensional weights for the width and height dimensions. No predictions were made for either the translations or the dimension weights. They are simply optimized by the program and will not be interpreted here. The one deviating subject in the WH group is Subject 12. This individual almost collapses the de-
PERCEPTION OF RECTANGLES
( a)
~-------1I-O-----O------Cl
~
l/I II
o
\ \
l-
r=.997 C=.991
1:{,~,- - - - - - - + 1.98
In(w)+ 1.83
(b)
III II
oCo> '"
-
...io
r=.999 C=.997
~'~I-------~ 3.83 W· 32 -1.41
5=.026
Fllure ... WH deslln conDluration transformed to optimally Dt tbe MDS conDlUration of FllUre 3 (open circles). Tbe labellnl of tbe nes IboWI tbe tranlformatlon used on tbe pbYllcai wldtb and bellbt coordinates of tbe WH deslln In FllUre 1. Metric Itrea I Indicates tbe fit on eacb dimension. Global col'ftlpondence II aaeued by r, tbe PM correlation oYerthe coordinates, and e, tbe conlruence coefficient ever tbe dlltancel.
263
sign configuration over the width dimension so that, essentially, only height differences determine his similarity ratings. It is evident from Figure 4 that height also determines the distances of the other subjects to a greater extent than does width. Thus, since Subject 12 shows the same logarithmic spacing on the height dimension as that in Figure 3, he is merely an extreme case in our model. We now turn to the AS group for which it was predicted that the MDS configurations could be approximated by a logarithmic rescaling of the AS design grid along the width and height dimensions, Twenty of the 21 data sets in the AS group lead to very similar MDS solutions. As before, for the WH group, the remaining subject is again an extreme case (see below), whose exclusion has practically no effect on the MDS solution. We therefore average the rating scores of all 21 subjects (Table 2) and report an aggregate subject configuration which should be more stable than individual results (Figure S). The S value for the configuration is a low 6.4Dfo. The Shepard diagram shows an essentially linear regression of the distances on the data. Again, since the city-block metric was used, the coordinate axes are algebraically fixed and rotations are not admissible. As before, it is possible to directly interpret these dimensions as width and height, because one can easily see that by increasingly shrinking the physical width and height units in Figure 2 as one moves away from the origin, the AS design grid is bent into a shape similar to the one exhibited by the MDS configuration. To measure this bending effect more objectively, we again fit power and logarithmic functions to the physical width and height dimensions in Figure 2 in an attempt to transform the AS design configuration to the best possible match with the MDS configuration in Figure S. The results of these transformations are presented in Figure 6. Both function types do about equally well. It is interesting, though, that in both cases, the optimally transformed AS design grid does not match the MDS configuration uniformly well: the points that cause the most problems for the regression routine are the ones in the upper left-hand corner. These points represent rectangles that lie just slightly below the bisector in Figure 2, and even though they are therefore strictly "rectangular, I t they look like squares. Thus, it seems that the subjects somehow made a distinction between squares and nonsquares, and clustered the squares closely. Exactly this phenomenon is strongly exhibited by the one maverick subject (No. 24 in Table 1). This individual clearly separates the four square-like stimuli from the rest. Practically no distinctions are made among the squares, whereas the distances among the "rectangles" are similar to those in Figure 4. Hence,
264
BORG AND LEUTNER
Figure 5. MDS represeDtadoD for AS data of Table 1.
this subject may use a mixed strategy, possibly first separating squares from nonsquares, and then treating nonsquares in the sense of our composition rule. DISCUSSION
The above results clearly support our predictions. There is no need to introduce "interaction effects" into a dimensional model of rectangle perception if (1) one uses a width x height system, with (2) appropriately rescaled physical units and (3) the cityblock metric as a composition rule. It may appear that the above statements are too strong, because it can be shown that any MOS solution optimal for p = 1 is also optimal for p = 00 if the coordinate system is rotated by 45 deg (see, e.g., Coombs, Dawes, & Tversky, 1970). However, the dominance metric (p = 00) represents a composition rule that is completely different from that of the cityblock metric. For p = 00, the distance of two points is determined only by the largest of all intradimensional differences. Hence, in the subject's judgment, this largest difference completely "dominates" all other differences of the stimuli (Cross, 1965). For the cityblock metric, in contrast, all intradimensional differences are added with equal weight to form the overall judgment. On the basis of S, these two fundamentally different judgment processes cannot be distinguished. But one also has to take into account the necessary 45-deg rotation that transforms the
solution for p = 1 into the one for p = 00. For the WH solution in Figure 3, this means that the area x shape dimensional system-in combination with the dominance composition rule-leads to an interpretation as simple as our model from above. For the AS data, however, such a dominance metric interpretation becomes much more complicated and psychophysically obscure. It requires, again, interaction notions, since no simple rescaling of the area and shape dimensions allows one to derive the AS MOS configuration from its design space. It has been argued that an ordinal analysis of the dissimilarity data in the sense of Beals et al. (1968) would be "much stronger" and "more fundamental," because, for example, they presuppose no particular metric. However, the purely ordinal approach of counting violations of axioms does not allow any weighting of these violations. They must all be treated as equally important. Moreover, if they are quantitatively small, they may disappear-at least as systematic ones-under the admissible transformations of the data (see the next paragraph). Furthermore, it is often not understood that the Beals et al. tests are relative only to a given set of stimuli and, therefore, are conditional to how the stimuli are physically constructed. They are, in that sense, as scale dependent as any other tests, as beautifully demonstrated by the Krantz and Tversky (1975) study. One reviewer raised an interesting question concerning the adequacy of the city-block specification. He or she observed that one finds, for the data O(i,j) in the WH group, that, for example, 6.71 =0(2,1)+ 0(1,5) > 0(2,5)=5.76, 6.62=0(2,6)+0(6,5) > 0(2,5)=5.76,6.48=0(1,5)+0(5,6) > 0(1,6)= 4.52, and 6.85 = 0(1,2) + 0(2,6) > 0(1,6) = 4.52. If the Ds were city-block distances, then these inequalities should be equalities. Only if p > 1 in (1) would the triangle inequalities be strict, and the greater the p, the quantitatively more so. However, it was not assumed that the data were distances, and with ordinal and even interval data, such violations of triangle equalities can at least be reduced by subtracting a sufficiently large constant from the Ds, Moreover, the ordinal MOS procedure maps the Ds slightlynonlinearly into their corresponding distances. These MOS distances do, of course, strictly satisfy all triangle equalities, because the scaling is carried out under the p = 1 restriction. Finally, the low S values indicate that the distances are in excellent agreement with the admissibly transformed data. Hence, the observed "violations" of the triangle equalities in the data are, at most, of minor importance, since they can be largely eliminated by admissibly transforming the data into their monotone regression values. It should also be remembered in this context that the residual variance in the data may be considered as essentiallydue to error.
PERCEPTION OF RECTANGLES
(a)
r=.980 C=.970
t.'I-·- - - - - - - - 4.09ln(w) -1.43
5= .077
'"
b ::r
•
.
Ol I
'..."
Lt.11
r z.980 C-.985
- - - - - - - - - - -
1.81 W .71 - .65
&=.080
Fllure 6. AS desllD cODDluradoD transformed to opdmally Dt the MDS cODDluradoD of Flpre 6 (OpeD circles). For IlbeUDI of ues IDd meaDIDI of I, r, IDd e, 1ft Fllure ...
265
The triangle inequality problem leads to another question discussed by Tversky and Gati (1982), who observed for a number of stimuli constructed from rectangular two-dimensional configurations similar to our WH design "that the corner triples are approximately additive, while the unidimensional and two-dimensional triples are distinctly subadditive .... That is, dissimilarities are additive across attributes and sub additive within attributes" (p. 134). ("Corner triples" denote stimulus triples i,j,k, where the path from i to k goes over the "corner" point j in the design configuration, as for the stimuli I, 2, and 6 in our WH design configuration in Figure 2.) Obviously, one can only distinguish corner triples from noncorner triples in the two-dimensional plane without using a specified dimensional system. Hence, the question of choosing the "right" system arises again. Tversky and Gati (1982, Figure 7) report the most pronounced triangle inequalities for (raw) data of stimuli lying on "diagonals" in the design space. Of course, these two-dimensional stimuli can also be considered one-dimensional after the coordinate system is rotated and rescaled. In any case, for our WH data, the same arguments as before are relevant: the distances of the MDS solution in Figure 3 are consistent over all triples-corner or noncorner, one- or two-dimensional; they also represent the data exceedingly well, with the small residual variance being likely due to error in the subjects' judgments. Hence, peculiar systematic triangle effects are, at most, very minor. Our model is apparently a deterministic one, and no error theory was developed. It might therefore be asked if, using a procedure like Takane's (1981) MAXSCAL-2, the conclusions would not be different. After all, Takane also rejected the W x H model (with p=2). He rejected it, however, against the null hypothesis of an optimal unconstrained twodimensional MDS structure. This is hardly a serious null hypothesis, because it is simply too weak and substantively almost empty. Guttman (1981) has argued that the null hypothesis should be the "incumbent" hypothesis. We feel that our simple W x H model, with p = I, is really the incumbent hypothesis and that the A x S theory, with p = 2, is a "challenging" hypothesis-and not even a particularly convincing one on theoretical grounds. Anyway, the figures published in Takane (1981)also indicate why the W x H constrained solution was rejected over the unconstrained solution: although the former looks almost exactly like the Krantz- Tversky INDSCAL configuration in Figure 1b, the latter is more like a trumpet with the fanned-out lines being bent towards the outside. But Takane used the same stimuli as Krantz and Tversky (1975)-actually cutting them from Krantz and Tversky's original report-and it is therefore unclear whether these additional effects are reliable. There are further questions about Takane's '
266
BORG AND LEUTNER
method. He constrains the W x H solution so that segmental additivity is strictly satisfied by those points on lines parallel to the dimensions in the design space. But this implies an absurd error model, in which subjects are assumed to misjudge the constrained distance relations in only a strictly constrained way. It seems that in a probabilistic model, one should have probabilistic constraints also. And, finally, the properties of Takane's tests under smallsample conditions remain largely unknown, so that the formal meaning of a "rejection" is not quite clear either. Although our conclusions are different from those of Wender, Krantz and Tversky, Takane, and others, it is also evident that our model is not completely sufficient to explain all observed phenomena. The tendency to group the square-like rectangles rather closely relative to the more squat rectangles indicates that more than a simple additive difference model is needed, even though it does remarkably well as a first approximation. If one extrapolates beyond the present data, however, it is not difficult to see that our model is almost certainly not adequate for rectangle perception in general. We have already discussed some evidence for the special role played by the bisector in the coordinate plane that contains the squares. No study has ever reported systematic comparisons of rectangles distributed throughout the plane, that is, of horizontal rectangles, squares, and vertical rectangles. On the contrary, comparisons have always been carefully restricted to just one type, mostly squares or horizontal rectangles. Moreover, it is clear that the model, as it stands, allows in principle comparisons of arbitrarily small and big rectangles. This is, of course, a completely unreasonable property of the model, since very small rectangles are simply perceived as points, and arbitrarily big rectangles are physically impossible. Finally, the model also admits any width-height combination. This is equally implausible, because rectangles that are, say, very long and very flat are not perceived as rectangles anymore but as line segments. At this time, we cannot give a sharp definition of the stimulus domain or content universe of our model. What we have demonstrated above is that it is sufficient for those rectangles which approximately correspond in area and shape to the . ones studied so far. Our model has demonstrated "local" validity, but an unrestrictedtheory of rectangle perception would be forced to drop, for example, the notion of a constant metric and use differential geometry. Unfortunately, even with many constraints on the warps of the rectangle plane, this means that much more data are needed. Moreover, as some exploratory tests have shown (Schonemann, Note 3), qualitative interindividual differences are to be expected. For example, some individuals judged pairs of rectangles of the same area and shape but
presented horizontally and vertically, respectively, to be perfectly similar (thus using the mathematical notion of similarity), whereas other subjects perceived them as different, as the "flat" city-block plane would suggest. REFERENCE NOTES 1. Coombs, C. H. General mathematical psychology: Scaling and data theory. Unpublished manuscript, The University of Michigan, 1966. 2. Kruskal, J. B., Young, F. W., & Seery, J. B. How to use KYST-2. Unpublished manuscript, Bell Laboratories, 1978. 3. Schonemann, P. H. Personal communication, 1981.
REFERENCES BEALS, R., KRANTZ, D. H., & TvERSKY, A. Foundations of multidimensional scaling. Psychological Review, 1968, 7S, 127-143. BORG, 1. Anwendungsorientierte multidimensionale Skalierung, Heidelberg: Springer Verlag, 1981. BORG, 1. Scaling: A review of the German scaling literature of the last 15 years. German Journal of Psychology, 1983, 7, 63-79. BORG, 1., & LINGOES, J. C. What weights should weights have in individual differences scaling? Quality and Quantity, 1978, 11, 223-237. [Reprinted in P. M. Davies & A. P. M. Coxon (Eds.), Key texts in multidimensional scaling. London: Heinemann, 1982.) BORG, 1., & LINGOES, J. C. A model and algorithm for multidimensional scaling with external constraints on the distances. Psychometrika, 1980,45,25-38. BORG, 1., SCHONEMANN, P. H., & LEUTNER, D. Reizuberdeterminierung und andere Artefakte bei der Wahmehmung einfacher geometrischer Figuren. Zeitschrift fur experimentelle und angewandte Psychologie, 1982,14,531-544. CARROLL, J. D., & CHANG, J. J. Analysis of individual differences in multidimensional scaling via an N-way generalization of Eckart-Young decomposition. Psychometrika, 1970, 3S, 283-320. COOMBS, C. H., DAWES, R. M., & TvERSKY, A. Mathematical psychology: An elementary introduction. Englewood Cliffs, N.J: Prentice-Hall, 1970. CROSS, D. V. Metric properties of multidimensional stimulus control. Unpublished doctoral dissertation, The University of Michigan, 1965. EISLER, H. Equivalence of psychological models: Time-order errors, similarities, subjective spaces. In E. D. Lantermann & H. Feger (Eds.), Similarity and choice. Bern, Switzerland: Huber, 1980. EISLER, H., & ROSKAM, E. E. Multidimensional similarity: An experimental and theoretical comparison of vector, distance, and set theoretical models. Acta Psychologica, 1977, S, 1-46 and 335-363. GUTTMAN, L. A general nonmetric technique for finding the smallest coordinate space for a configuration of points. Psychometrika, 1968,33,469-506. GUTTMAN, L. What is not what in statistics, In I. Borg (Ed.), Multidimensional data representations: When and why. Ann Arbor, Mich: Mathesis Press, 1981. HELM, C. E. Multidimensional ratio scaling analysis of perceived color relations. Journal of the Optical Society ofAmerica, 1964, st, 256-268. JOHNSON, R. M. Pairwise nonmetric multidimensional scaling. Psychometrika, 1973,31, 11-18. KRANTZ, D. H., & TvERSKY, A. Similarity of rectangles: An analysis of subjective dimensions. Journal ofMathematical Psychology, 1975, 11,4-34.
PERCEPTION OF RECTANGLES KRUSKAI., J. B. Multidimensional scaling by optimizing goodness of fit to a nonmetric hypothesis. Psychometrika, 1964,29, 1-27. LINGOES, oj', C. The Guttman-Lingoes nonmetric program series. Ann Arbo. Mich: Mathesis Press, 1973. LINGOES, J. C., & BORG, I. A direct solution to individual differences scaling using increasingly complex transformations. Psychometrika, 1978,43,491-519. RoSKAM, E. E. Multidimensional scaling by metric transformation of data. Nederlands Ttjdschrift voor der Psychologie, 1972, 27, 486-508. [Reprinted in J. C. Lingoes, E. E. Roskam, & I. Borg (Eds.), Geometric representations of relational data. Ann Arbor, Mich: Mathesis Press, 1979.) SCHONEMANN, P. H. Similarity of rectangles. Journal of Mathematical Psychology, 1977,16, 161-165. SCHONE MANN, P. H., & BORG, I. On the interaction between area and shape. In I. Borg (Bd.), Multidimensional data representations: When and why. Ann Arbor, Mich: Mathesis Press, 1981. SHEPARD, R. N. Analysis of proximities: Multidimensional scaling with an unknown distance function. Psychometrika, 1962, 27, 125-140. SHEPARD, R. N. Attention and the metric structure of the stimulus space. Journal of Mathematical Psychology, 1964, I, 54-87. SHEPARD, R. N. Representation of structure in similarity data: Problems and prospects. Psychometrika, 1974,39,373-421. SIXTL, F., & WENDER, K. Der Zusammenhang zwischen multidimensionalem Skalieren und Faktorenanalyse. Biometrische Zeitschrift, 1964,6,251-261. SPENCE, I., & OGILVIE, J. C. A table of expected stress values for random rankings in nonmetric multidimensional scaling. Multivariate Behavioral Research, 1973,11,511-517. TAKANE, Y. Multidimensional successive categories scaling: A maximum likelihood method. Psychometrika, 1981, 46, 9-28.
267
TAKANE, Y., YOUNG, F. W., & DELEEUW, J. Nonmetric individual differences scaling: An alternating least-squares method with optimal scaling features. Psychometrlka, 1977, "2, 7-67. TORGERSON, W. S. Theory and methods of scaling. New York: Wiley, 1958. TORGERSON, W. S. Multidimensional scaling of similarity. Psychometrika, 1965, JO, 379-393. TvERSKY, A., & GATI, I. Similarity, separability, and the triangle inequality. Psychological Review, 1982,119, 123-154. WENDER, K. Die psychologische Interpretation nichteuklidischer Metriken in der multidimensionalen Skalierung. Doctoral dissertation, TH Darmstadt, 1969. WENDER, K. A test of independence of dimensions in multidimensional scaling. Perception cI Psychophysics, 1971,10,30-32. WIENER-EHRLICH, W. K. Dimensional and metric structures in multidimensional stimuli. Perception cI Psychophysics, 1978,24, 399-414. WOLFRUM, C. Zum Auftreten quasiaquivalenter Losungen bei der Verallgemeinerung des Skalierungsverfahrens von Kruskal auf metrische Raume mit der Minkowski-Metrik. Archiv fur Psychologie, 1976, 121, 96-111. (a) WOLFRUM, C. Zur Bestimmung eines optimalen MetrikkoeffIZienten r mit dem Skalierungsverfahren von Kruskal. Zeitschrift fUr experimentelle und angewandte Psychologie, 1976, 23, 339-350. (b) YOUNG, F. W. Nonmetric multidimensional scaling: Recovery of metric information. Psychometrika, 1970,35,455-473.
(Manuscript received December 16,1982; revision accepted for publication May 31,1983.)