Dimensions of Business Processes Quality (QoBP) Mitra Heravizadeh, Jan Mendling, and Michael Rosemann Queensland University of Technology 126 Margaret Street, Brisbane QLD 4000, Australia
[email protected],
[email protected],
[email protected]
Abstract. Conceptual modeling is an important tool for understanding and revealing weaknesses of business processes. Yet, the current practice in reengineering projects often considers simply the as-is process model as a brain-storming tool. This approach heavily relies on the intuition of the participants and misses a clear description of the quality requirements. Against this background, we identify four generic quality categories of business process quality, and populate them with quality requirements from related research. We refer to the resulting framework as the Quality of Business Process (QoBP) framework. Furthermore, we present the findings from applying the QoBP framework in a case study with a major Australian bank, showing that it helps to systematically fill the white space between as-is and to-be process modeling.
1
Introduction
In order to meet customer demands companies have to design business processes in an appropriate way. In particular, four essential process competencies have been discussed in operations management: process cost, process flow time, process flexibility, and process quality [1]. While each of them has been subject to dedicated research, there is only little general work on process quality, e.g. [2]. In this context, process quality refers to the ability of a process to produce and deliver quality products [1]. It covers aspects such as accuracy, conformance to specification, and reliability. Quality has been the topic of research in neighboring disciplines such as manufacturing, software engineering, information management, and services management. As a result a variety of standards [3–5] and frameworks [6–9] have been introduced to define, manage, assure, control and improve the quality. Yet, in business process modeling and design the quality dimension of a process is often neglected. While goal-oriented modeling approaches recognize quality in terms of non-functional goals [10, 11], they are hardly integrated with activity-oriented approaches. As a consequence, the interrelation between control flow and quality is little understood. To be more concise, the traditional focus of process design builds on reflecting current practices in so-called as-is models followed by the design of an improved to-be process model [12]. These models, however, only capture the procedural dimension of a process and provide limited insights into
2
related quality factors. As a consequence, the white space between as-is and tobe is poorly supported by popular process modeling tools, and miss facilitating a quality analysis in the established tradition of the quality management community. Our QoBP framework advances the state-of-the-art in the business process analysis with a systematic process to identify weaknesses of a process. This way, it makes concepts from quality management available for process modeling. In this paper we introduce the Process Root Cause Analysis approach (PRCA). It combines goal-oriented and activity-oriented process modeling for an explicit description of quality aspects of a process. Beyond that, we study related work from neighboring disciplines aiming to build a holistic framework for capturing the quality dimensions of a process. As a reference to Quality of Service (QoS) we call it Quality of Business Process (QoBP) framework. In particular, the framework helps modelers in identifying quality attributes of a specific process. Against this background, the remainder of the paper is structured as follows. In Section 2 we describe the PRCA approach. Section 3 focuses on the identification of quality aspects of a process, and proposes the QoBP framework as guidance. Section 4 presents findings from applying the PRCA approach and the QoBP framework in a case study with a major Australian bank. For this validation we follow an action research approach. Section 5 concludes the paper.
2
PRCA in a Nutshell
Root cause analysis is a problem solving technique in a variety of quality-centered management approaches such as Six Sigma. The main assumption is that an issue can only be solved by addressing the underlying cause for the problem. Conceptually, root cause analysis is grounded in the principle of double loop learning as part of organizational learning [13]. Double loop learning goes beyond the detection and correction of errors and concentrates on the related policies, systems, norms, procedures, context factors, etc. as the causes of the error. Several approaches to root cause analysis have been proposed, among others so-called Ishikawa diagrams, or fishbone diagrams [14]. These diagrams capture potential causes of a problem and are typically populated in brain-storming sessions. In this section, we introduce our Process Root Cause Analysis approach (PRCA) [15] that combines ideas from Ishikawa diagrams with concepts from process modeling and requirements engineering. In Section 2.1 we define a metamodel for the problem domain of root-cause analysis in business processes, and in Section 2.2 we describe the process of how to populate the metamodel for one particular analysis case. 2.1
PRCA Metamodel
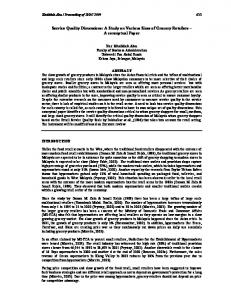
This section describes the metamodel of the PRCA approach. As we have outlined before, PRCA builds on control flow based business process modeling. Accordingly, the upper left part of Figure 1 captures the essential elements of an EPC, i.e. control flow elements including functions, events, and connectors
3
which are linked by control flow arcs. Furthermore, each function can be described regarding its input and output as well as its resource requirements. This part of the metamodel is classical process modeling and can easily replaced by respective elements of other modeling languages such as BPMN or Petri nets.
Process Type
Resource
Event
Input
Connector
Output
Process Instance
Non-Control Flow Element
1..* 1 * * Control Flow Arch
Control Flow Element
Function
Function Execution
* *
0..1
-has
1
0..*
-raises
0..*
-represented and reasoned by Quality Requirement
Softgoal 0..1
0..1 0..*
Issue
-TriggeringCondition 1
-correlates to
1
0..* 0..*
-is measured by Metric
-is caused
0..* Value
-FailureCondition
Fig. 1. PRCA Metamodel as a UML class diagram
The PRCA metamodel introduces additional concepts to capture those entities relevant to root cause analysis in the bottom part on the left-hand side and on the right-hand side of Figure 1. First of all, it is important to distinguish process type level and process instance level. Issues are raised on the process instance level, i.e. for a particular case like loan approval that could become a default. Issues relate to the execution of a function in the process (Function Execution) and the way the function is conducted (described by values related to a metric). In order to classify issues appropriately, the PRCA approach builds on identifying softgoals for a function on the process type level. Softgoals in this context refer to non-functional requirements of the function similar to their application in early stages of requirement engineering process [16–18]. An example of a softgoal of the Evaluate function in a loan approval process is ensure accuracy of evaluation. For the identification of softgoals we use a set of generic quality requirements that lists e.g. accuracy as one particular quality dimension.
4
The relevance of a softgoal is bound to a triggering condition that specified e.g. that accuracy matters only for a loan approval worth more than $1,000. The achievement of a softgoal is made measurable by relating it to a metric based on the goal-question-metric approach [19]. The link to the process instance level is provided by the failure condition of the metric: if the value of the metric in a particular process instance meets the failure condition, this signals the occurrence of an issue related to the execution of a singular function. In order to trace issues back to root causes, we identify correlations between softgoals (cf. [20]). In our example, the accuracy of the document analysis correlates with the accuracy of the loan approval. The following section describes the process to systematically populate the PRCA metamodel. 2.2
PRCA Process
The goal of the PRCA process is to identify the elements of a process and its related softgoals, metrics, and issues for a particular case. The PRCA process essentially includes six major steps: 1) Define a business process model, 2) Define a quality model for a process, 3) Define a softgoal model, 4) Define a correlation model, 5) Define a measurement model for each softgoal, and 6) Identify the issue occurrences. A crucial step for this approach is the availability of a generic quality model. It directs the creation of the softgoal model, and the precision of all other subsequent steps. For more details on the different steps refer to [15]. The objective of a quality model is to identify all the potential quality requirements for functions of the process. The notion of a quality requirement relates to non-functional requirements in the software engineering discipline. In this context the ISO standard [4], quality is defined as “the totality of the characteristics of an entity that bear on its ability to satisfy stated and implied needs”. The essential characteristic of a quality requirement is that it can be achieved in different degrees. These quality requirements do not directly relate to functionality in the process, but to conditions and constraints that should prevail [21]. While there has been some work on isolated aspects of quality, there is currently no quality model for business processes available. We address this shortcoming in Section 3.
3
Quality Dimensions of Business Processes
In the previous section we have highlighted the importance of the quality model. By offering a set of generic quality requirements it guides the modeler in the process of uncovering the quality dimensions of a particular process. In operations management it has been emphasized that these controllable internal quality aspects of a business process ultimately determine the external quality perception of goods and services created by the process [1]. In this section we acknowledge that quality of a business process builds on the quality of its functions. In essence there are two levels of granularity at which the quality of functions can be analyzed: for the function as a whole, or by looking into the entities related to it.
5 Table 1. QoBP Quality Dimensions Function Suitability Accuracy Security Reliability Understandability Learnability Time Efficiency Resource Utilization Effectiveness Productivity Safety User Satisfaction Robustness
Input/Output Accuracy Objectivity Believability Reputation Accessibility Security Relevancy Value-added Timeliness Completeness Amount of Data
Non-Human Resource Suitability Accuracy Security Reliability Time Efficiency Resource Utilization Effectiveness Safety User Satisfaction Robustness Availability
Human Resource Domain Knowledge Qualification Certification Experience Time Management Communication Skills
Accordingly, we discuss quality of functions (Section 3.1), quality of input and output objects (Section 3.2), quality of non-human resources (Section 3.3), and quality of human resources (Section 3.4). An overview of the dimensions that we identify based on related work is given in Table 1. 3.1
Function Quality
A function is a basic building block in a business process that corresponds to an activity (task, process step) which needs to be executed [22]. Based on related work from software engineering we identify 13 quality dimensions, see Table 1. In the context of a function, we adapt the following definitions based on [4, 5]. Suitability is the capability to provide an appropriate function for specified user objectives. Accuracy refers to the capability of the function to provide the right or agreed results or effects with the needed degree of precision. Security relates to the capability of the function to protect information and data so that unauthorized resources cannot access them. Reliability is the capability of the function to maintain a specified level of performance when used under specified conditions. Understandability is the capability of the function to enable the resource to understand whether the function is suitable, and how it can be used for particular functions and conditions of use. Learnability is the capability of the function to enable the user to learn it. Time efficiency is the capability of the function to provide appropriate response and processing times and throughput rates when performing its function, under stated conditions. Resource utilisation is the capability of the function to use appropriate amounts and types of resources under stated conditions.
6
Effectiveness is the capability of the function to enable users to achieve specified goals with accuracy and completeness in a specified context of use. Productivity is the capability of the function to enable users to expend appropriate amounts of resources in relation to the effectiveness achieved in a specified context of use. Safety is the capability of the function to achieve acceptable levels of risk of harm to people, process, property or the environment. User Satisfaction is the capability of the function to satisfy users in a specified context of use. Robustness is the degree to which a function can function correctly even in the presence of invalid, incomplete or conflicting inputs. Please note that these dimensions can be relevant for a function, but not all are applicable for every function. Having this list of dimensions helps the analyst identifying quality aspects of particular functions of an individual process. 3.2
Input and Output Quality
The input and output of functions within a business process capture the physical and informational objects that are consumed and produced by it. Inputs and outputs differ in their significance to the overall process quality, and the dimensions given in the second column of Table 1 help to identify this difference. For this approach we put a particular emphasis on data and information quality and the dimensions that have been discussion in that area, see [23, 8, 9]. Two categories of data quality are identified in [9], namely data product quality and data service quality. Data product quality includes the quality aspects related to data itself while service quality includes aspects related to the service delivery process of the information to consumers. In this research we are particularly interested in data product quality that focuses on the content of data. Furthermore, we adopt the data quality attributes defined by [23] which build on the overarching quality categories intrinsic, contextual, representation, and accessibility. Accuracy and security were already identified before in the context of functions in general. Accuracy refers to whether the data accurately records the business object or event it represents. Objectivity refers to whether the data is unbiased and facts-based. Believability refers to the extent to which data are accepted or regarded as true, real and credible. Reputation refers to the extent to which the data has a reputable source. Accessibility refers to the extent to which data is easily accessible when needed. Security is the extent to which data is protected against unauthorized access. Relevancy refers to the extent to which the data is relevant. Value-added is the extent that data contributes to value creation. Timeliness refers to the extent to which the data is sufficiently current. Completeness is the extent to which the data includes all necessary values. Amount of data relates to a sufficient data volume for our needs.
7
3.3
Non-human resource quality
Functions may be executed by non-human resources such as machines, devices, or software programs. The way how these non-human resources operate influences the quality of functions and the business process as a whole. Therefore, it is important to specify the quality requirements of non-human resources in the process model. The quality characteristics we identify are adopted from both software engineering product quality [4] and Quality-of-Services for web services [5]. The dimensions are mostly a subset of function quality aspects. The one being added is Availability as the probability that a resource is functioning. 3.4
Human resource quality
Functions within a process may be executed by human resources (e.g. employees). It has been well recognised that quality of a business process is influenced by the competency of the resources allocated to the process [24, 25]. Still, most business process modelling techniques lack the capability to capture competency required to execute a function within a business process [25]. We build our human resource quality attributes based on the work in [26–28, 25]. Domain knowledge is the knowledge on a specific domain that a human resource must have acquired for being able to perform the function. Qualification a human resource needs in order to perform the function. Certification relates to a certificate that a human resource should have to perform the function. Experience that a human resource has acquired that is relevant to the function. Time management is a behavior that a human resource need to demonstrate to be able to perform the function. Communication skill is a behavior that a human resource need to demonstrate to be able to perform the function. In the following we use the four categories of the QoBP framework in a case study for guiding the process analysis.
4
Case Study in the Financial Industry
In this section we report on the application of the QoBP framework in a larger case study to evaluate the PRCA approach. This case study was conducted as a formal collaborative project with one of the largest Australian banks. The Business Process Manager of the claim intake process which belongs to the motor claim insurance process served as an industry advisor. The case study is part of a series of case studies that are arranged as different steps in an action research design. Action research provided an opportunity for the researcher to become involved in practical problem solving through the close collaboration with practitioners from the participating organizations. As such it is particularly suited for
8
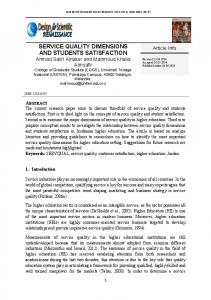
design science research. We followed the five phases action research model consisting of diagnosing (defining a problem), action planning (defines actions need to be taken to solve the problem), action taking (executing planned actions), evaluating (evaluating results the actions), and specifying learning (identifying lessons learned) [29]. The next sections describe each phases in detail. Diagnosis The purpose of this phase is to identify and define the problem. Financial organizations are increasingly experiencing the need for improving efficiency and quality of their processes to enhance customer experience. In order to cope with these external forces, our case study partner has engaged in a merger with another insurer. In this context, our project aims to identify ways of optimizing the motor claim process, and of standardizing it in conformance with other claim processes. For doing that, an in-depth understanding of the detailed process requirements is needed. Action Planning In this phase we defined the course of action for solving the problem. Our case study partner had used standard as-is process modeling techniques before to analyze the process. We planned to use our PRCA approach and the QoBP framework within it. Action Taking According to the plan we followed the PRCA approach. In particular, we conducted a series of workshops with the Business Process Manager. One researcher provided the materials to be discussed during the workshops in advance. Six workshops were designed according to six major steps of the PRCA methodology. Since this paper introduces the QoBP framework, we focus on the first three PRCA steps here, i.e. definition of a business process model, definition of a quality model, and definition of the softgoal model. The first step resulted in the definition of a business process model for the claim intake, see Figure 2. Roughly, the claim intake process starts with obtaining policy details including policy number, validating the caller by retrieving policy details, and checking whether he is authorized to lodge a claim. Then, the policy needs to be checked to match the details of the vehicle involved in the accident. After that, the incident and loss details are captured. The next step is then to validate if the incident event is covered under the policy. The liability also needs to be assessed against the information provided. Then, details and involvement of the third party are captured. After assessing the excess, the assessment of the vehicle repair path starts based on gathered information facts such as whether the vehicle is drivable, product information, towing arrangement etc. The next step involves an assessment of additional benefits within the policy limit such as hire car or emergency repairs. At this stage, the information about the process based on the collected information is communicated to the customer. The claim intake process is finalized by determining the claim ownership and an indication of how to proceed with the claim. The step of defining a quality model has essentially been reported in Section 3. We identified generic quality dimensions related to functions, to inputs outputs, non-human and human resources based on a literature review. The outcome of the third workshop was the quality model for functions, inputs-outputs, and human resources. A matrix was created as a view for each
9 New claim is logged Customer Identification
Obtain policy details and validate customer
Claims Processor Customer validated
Policy Identification
Customer Products
Policy Identification
Claims Processor
Validate policy Coverage & Policy Extra
Policy validated
Vehicle Information
Incident Details
Incident details captured
Capture incident details Incident Details
Coverage & Policy Extra
Claims Processor Incident coverage validated
Validate incident coverage Claim Business Rules
Incident Details
Claims Processor
Assess liability Claim Business Rules
Liability assessed
Claims Processor
Vehicle Information
Driver Details
Vehicle Information
Coverage & Policy Extra
Customer Personal Property Details
Third Part Property Details
Capture TP details TP details captured Incident Details
Assess excess
Claims Processor Excess assessed
Claim Business Rules
Incident Details
Claims Processor
Vehicle Information
Assess pathing Pathing assessed
Claims Processor Additional benefits assessed and actioned
Assessment Details
Coverage & Policy Extra
Assess and action additional benefit
Vehicle Information
Claim Service
Claim Identification
Claim Service
Assessment Details
Inform customer of next step
Claims Processor
V Outbound contact required
Customer is informed of next steps
Incident Details
Claims Processor
Third Party Details
Claim Service
Finalise claim intake
Claim Actions
V
End call
Potential recovery identified
Potential investigation required
Fig. 2. Claim Intake Process EPC
Assessment Details
10
y t ili b a it u S
cy a r u cc A
Obtain policy details and validate caller (authorised to lodge) Validate policy Capture incident details Validate incident coverage Assess liability Capture loss & TP details Assess excess Assess pathing Action hire car and towing (as appropriate) Add authorised parties (as appropriate) Inform customer of next steps Finalise claim intake
Y Y Y Y Y Y Y Y Y Y Y Y
Y Y
Y Y
Total
12
8
Y Y Y Y
y itr u c e S
Y Y Y
Y Y 5
y t ili b lia e R
Y Y Y Y Y Y Y Y
Y 9
y t ili b a d n ta sr e d n U
y itil b a rn a e L
r u io v a h e b e m i T
y c n ie c fif e
n o ti a sli ti u e cr u o s e R
Y Y Y Y
Y Y Y
Y Y Y
Y Y Y
Y
Y
Y
Y
Y
Y
6
5
4
4
ss e n e iv ct e ff E
Y Y Y
y it v tic u d ro P
y t fe a S
Y Y Y
n o tic fa si t a S
Y Y
Y
Y Y Y Y Y
Y 4
ss e n ts u b o R
Y 4
0
2
l ta o T
10 11 10 5 4 8 4 4 1 2 5 5
6
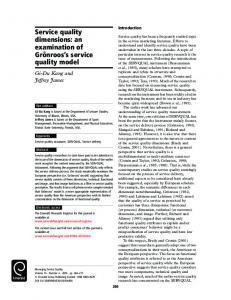
Fig. 3. Function Quality Dimension (captured as yes or no)
quality model. The function-quality matrix is presented in Table 3. Each row of this table represents a function of the claim intake process and the columns represent the quality characteristics. Where a quality characteristic is relevant to the function then a Y (like yes) is present in the appropriate cell. The totals in a row represents the number of quality characteristics relevant to the function in that row. For example totals of 11 for the function validate policy indicates that 11 quality characteristics out of 13 are relevant and important to this function. By just viewing this matrix it was easy for the Business Process Manager to identify the functions that play an important role in the quality of the process. The column totals are indicators on the relevancy of each quality characteristic in the whole process. For example, suitability has the highest totals (12) which indicates that this quality characteristic is very important for the process, as it is relevant to every single function of the process. On contrary, safety which has the lowest total (0) indicates that it is not of significant importance to this process. The input-output-quality matrix and human-resource-quality matrix both have similar structure to the function-quality quality matrix. Evaluation The application of the PRCA approach proved to valuable for the case study partner in analyzing the details of the claim intake process. We highlight three particular insights that the PRCA analysis provided: 1) human resource profiling, 2) confirmation of data input, and 3) criticality. 1. Based on the QoBP framework we analyzed the quality requirements of human resources related to every function. This information was considered relevant for the redesign of the process. It will be used for the definition of work profiles, and for the selection of appropriate staff members. 2. The input-output-quality matrix (not displayed in this paper) revealed that all information objects that are processed by the process actually matter. This could be easily validated by the help of the matrix and the row-sums: there was no input-row that did not matter in some quality dimension. 3. Based on the function-quality matrix we could identify the functions that are most critical to the quality of the process. They require further detailed analysis and extensive care in redesign.
11
Specifying Learning The main goal of this action research phase is to reflect the solution in order to contribute to theory development. There are two major aspects that we want to address in before the next action research step: 1) relationships between quality dimensions and 2) complexity management. 1. After completing the first cycle of the action research it became apparent that there is a relationship between quality of a function, and the quality aspects of its related entities input and output, human and non-human resources. We aim to exploit these relationships in a two-step approach in the future such that if accuracy matters to a function we will point to accuracy issues of objects and resources. 2. Furthermore, we are discussing strategies to design the collection of information as efficient as possible. Given, for instance, 13 function quality dimensions and 11 functions in the claim intake process we get already 143 relationships to be validated. Our strategy was to identify those functions that have a high number of quality characteristics and develop input-output and resource quality model for those ones. Accordingly, obtain policy details and validate customer, validate policy and capture incident details were considered with totals of 10, 11 and 12 out of 13.
5
Conclusion
In this paper we have introduced the QoBP which is a framework for capturing the quality dimensions of a process. In particular, we have defined four categories of the business process quality: quality of functions, quality of input and output objects, quality of non-human resources, and quality of human resources. These quality dimensions help to guide modelers in the process analysis, for instance, by using the PRCA approach. We discussed application of the QoBP framework in a case study with a major Australian bank as a means of guidance. The framework, in particular, complements our novel PRCA approach which uniquely combines goal-based and activity-based modeling concepts for an explicit description of quality aspects of a process. Beyond that, the QoBP can also be used in combination with other process analysis techniques such as as-is and to-be modeling.
References 1. Anupindi, R., Chopra, S., Deshmukh, S., Mieghem, J., Zemel, E.: Managing Business Process Flows. Prentice Hall (1999) 2. Grigori, D., Casati, F., Dayal, U., Shan, M.C.: Improving business process quality through exception understanding, prediction, and prevention. In Apers, P., Atzeni, P., Ceri, S., Paraboschi, S., Ramamohanarao, K., Snodgrass, R., eds.: VLDB 2001, Proceedings of 27th International Conference on Very Large Data Bases, September 11-14, 2001, Roma, Italy, Morgan Kaufmann (2001) 159–168 3. Samuel, K.M., Samuel, K.H.: Operations and Quality Management. (1999) 4. ISO/IEC-9126-1: Software engineering – product quality: Quality model (2001)
12 5. Group, W.W.: Qos for web services: Requirements and possible approaches (2003) 6. Naumann, F., Rolker, C. In: Assessment Methods for Information Quality Criteria, Cambridge, MA, USA. (2000) 148–162 7. Liu, K., Zhou, S., Yang, H.: Quality metrics of object oriented design for software development and re-development. In: Proceedings of the 1st Asian Pacific Conference on Quality Software , Hong Kong, China. (2000) 127–135 8. Lee, Y., Strong, D., Kahn, B., Wang, R.: Aimq: A methodology for information quality assessment. Information and Management 40 (2002) 133–146 9. Kahn, B., Strong, D., Wang, R.: Information quality benchmarks: Product and service performance. Communications of the ACM 45 (2002) 184–192 10. Aburub, F., M.Odeh, Beeson, I.: Modelling non-functional requirements of business processes. Information and Software Technology 49 (2007) 1162–1171 11. Grau, G., Franch, X., Maiden, N.A.M.: Prim: An i*-based process reengineering method for information systems specification. Inf. & Softw. T. 50 (2008) 76–100 12. Becker, J., Kugeler, M., Rosemann, M.: Process Management: A Guide for the Design of Business Processes. Springer-Verlag (2003) 13. Argyris, C., Sch¨ on, D.: Organizational Learning: A Theory of Action Perspective. Addison-Wesley Reading, MA (1978) 14. Ishikawa, K., et al.: What is Total Quality Control? The Japanese Way. (1985) 15. Heravizadeh, M., Mendling, J., Rosemann, M.: Root Cause Analysis in Business Processes. Qut eprint, Queensland University of Technology (2008) 16. Chung, L., Nixon, B.A.: Dealing with non-functional requirements: Three experimental studies of a process-oriented approach. In: ICSE, Proceedings. (1995) 25–37 17. Jureta, I.J., Faulkner, S., Schobbens, P.Y.: A more expressive softgoal conceptualization for quality requirements analysis. In: ER, Proceedings. (2006) 281–295 18. Cleland-Huangs, J., Settimi, R., BenKhadra, O., Berezhanskaya, E., Christina, S.: A more expressive softgoal conceptualization for quality requirements analysis. In: ICSE, Proceedings. (2005) 362–371 19. Basili, V., Rombach, H.D.: The TAME project: Towards improvement-oriented software environments. IEEE Trans. on Software Engineering 14 (1988) 758–773 20. Lamsweerde, A.V.: Goal-oriented requirement engineering: a guided tour. In: RE, Proceedings. (2001) 249–63 21. Cysneiros, L.M., do Prado Leite, J.C.S., de Melo Sabat Neto, J.: A framework for integrating non-functional requirements into conceptual models. Requirements Engineering 6 (2001) 97–115 22. van der Aalst, W.: Formalization and verification of event-driven process chains. Information and Software Technology 41 (1999) 639650 23. Wang, R., Strong, D.: Beyond accuracy: What data quality means to data consumers. Management Information System 12 (1996) 533 24. Neves, J., Caetano, A., Vasconcelos, A., Tribolet, J.: Integrating knowledge into business processes. In: Proceedings of ICEIS 2001. (2001) 25. Caetano, A., Pombinho, J., Tribolet, J.: Representing organizational competencies. In: SAC, Proceedings (2007) 1257–1262 26. Spencer, L.M., Jr., Spencer, S.M.: Competence at Work: models for superior performance. John Wiley and Sons, Inc., first ed. (1993) 27. Sandberg, J.: Understanding human competence at work: An interpretative approach. The Academy of Management Journal 43 (2000) 9–25 28. Harzallah, M., Lecrere, M.: CommOnCV: Modelling the Competencies Underlying a Curriculum Vitae. SEKE, Proceedings. (2002) 29. Susman, G., Evered, R.: An assessment of the scientific merits of action research. Information Systems Journal 4 (1978) 582– 603