Mem Inst Oswaldo Cruz, Rio de Janeiro, Vol. 95(1): 1-16, Jan./Feb. 2000
1
Ecology of Mosquitoes (Diptera: Culicidae) in Areas of Serra do Mar State Park, State of São Paulo, Brazil. I - Monthly Frequency and Climatic Factors Anthony Érico Guimarães+, Rubens Pinto de Mello, Catarina Macedo Lopes, Carla Gentile Laboratório de Diptera, Departamento de Entomologia, Instituto Oswaldo Cruz, Av. Brasil 4365, 21045-900 Rio de Janeiro, RJ, Brasil
The ecology of mosquitoes were studied (Diptera: Culicidae) in areas of Serra do Mar State Park, State of São Paulo, Brazil. Systematized monthly human bait collections were made three times a day, for periods of 2 or 3 h each, in sylvatic and rural areas for 24 consecutive months (January 1991 to December 1992). A total of 24,943 specimens of adult mosquitoes belonging to 57 species were collected during 622 collective periods. Coquillettidia chrysonotum was the most frequent collected mosquito (45.8%) followed by Aedes serratus (6.8%), Cq. venezuelensis (6.5%), Psorophora ferox (5.2) and Ps. albipes (3.1%). The monthly averages of temperature and relative humidity were inserted in the ten-year average limits of maximum and minimum of the previous ten-years. Rainfall accompanied the curve of the tenyear averages. Those climatic factors were influential in the incidence of some species; temperature: Anopheles cruzii, An. mediopunctatus, Ae. scapularis, Ae. fulvus, Cq. chrysonotum, Cq. venezuelensis, Runchomyia reversa, Wyeomyia dyari, Wy. confusa, Wy. shannoni, Wy. theobaldi and Limatus flavisetosus; relative humidity: Ae. serratus, Ae. scapularis, Cq. venezuelensis and Ru. reversa; rainfall: An. cruzii, Ae. scapularis, Ae. fulvus, Cq. venezuelensis Ru. reversa, Wy. theobaldi and Li. flavisetosus. Key words: mosquitoes - ecology - vectors - Serra do Mar - Brazil
The development of new rural communities in the states of São Paulo and Rio de Janeiro, Brazil, including the area of the present study, occurs where the ecology of mosquitoes species that may be potential vectors of etiologic agents of diseases still remain unknown. Frequently, mosquito species that typically occur in forest habitat (e.g. Aedes albopictus in various Brazilian cities) have become adapted to urban areas and to cohabitation with man. Our research studies focused on mosquitoes that are potentially vectors of etiologic agents of diseases to man or/and other animals in Atlantic Forest area of Serra do Mar State Park (PESM), Picinguaba Nucleus, city of Ubatuba, State of São Paulo, Brazil. We conducted studies in a preserved primitive forest with easy access and proximity to
This work is part of the main author’s PhD thesis and was accomplished with the help of CNPq, process no. 41.1613/88. +Corresponding author. Fax: +55-21-290.9339. E-mail:
[email protected] Received 24 November 1998 Accepted 4 November 1999
our laboratory (Oswaldo Cruz Foundation, Fiocruz, Rio de Janeiro). MATERIALS AND METHODS
Targeting the lack of knowledge of the biocenotic structure of the mosquito fauna in the Picinguaba Nucleus of PESM, we captured Culicidae in four locations of the park. Monthly human bait captures were conducted for three different daytime period for both forest and households environment for two years, from January 1991 to December 1992. Additionally climatic conditions were recorded. PESM includes a long extension of Atlantic Forest habitat alongside 13 cities (from Itariri, in the south, to the Vila de Picinguaba) along the shore of the State of São Paulo (Fig. 1). The park was created by the unification of nine Forest Reserves in the State of São Paulo, created in 30 August 1982, between the 23º12’ and 23º59’ South latitude and 44º44’and 47º17’ West longitude. It is the largest Brazilian state park, occupying 309,938 hectares. The natural boundaries of PESM reach the seashore in only one point in the vicinities of Vila de Picinguaba with elevations rarely exceeding 600 m. The geomorphological structure is characterized by cliffs with linear, subparallel, red-yel-
2
Ecology of Mosquitoes - I Anthony Érico Guimarães et al.
low latosolic soil and dense vegetation typical of Atlantic Forest, habitats of Evergreen Hygrophytic Seashore Forest (Allonso 1977). The site study is located at the Vila de Picinguaba Nucleus (47,000 ha), in Ubatuba, State of São Paulo, and 33 km from Paraty, State of Rio de Janeiro at km 10 of the BR-101 Route (Fig. 1). The nucleus offers a lodge for research groups and have been developing environmental education and preservation of the “caiçara” culture for the fishing community established in Vila de Picinguaba (fish refuge, in the “tupi-guarani” indigenous language) for the last 100 years. The vegetation is diverse and among the major representatives are acanthus, cinnamon, cedars, “ipês” (Caesalpinia, Bignonia and Boraginaceae families trees), “jacarandás” (tall trees of the
Bignoniacius family, genus Jacaranda), “jequetibás” (genus Cariniana), etc., that reaches an average of 15 to 20 m high. Generally, all present straight trunks with various orchid and bromeliad species. Ground flora includes palm trees, “quaresmeiras” (spiderflower), “samambaias” (a bromeliad) and various epiphytes. The vertebrate fauna, once rich and diverse, has been severely reduced by human exploitation. However, it is still possible to find “sagüi” (Callithrix aurita), “macaco-prego” (Cebus apella), “preguiça” (Bradypus tridactyla), “veado mateiro” (Mazama americana), “tamanduá-mirim” (Tamandua tetradactyla), “jaguatirica” (Felis pardalis), “paca” (Coelogenis paca), “tatu-bola” (Tolypentes tricinctus), “tatu-galinha” (Dasypus novemcintus), and others, as well as a variety of birds.
Rio de Janeiro Brazil · São Paulo
São Paulo Ilha Grande
Paraty ·
Atlantic Ocean
Picinguaba · Ubatuba ·
(a) Location in Brazil
Atlantic Ocean
São Sebastião·
Fazenda River C·
(b) Location in São Paulo PESM
BR-101 D· Fazenda Beach
B· A·
·X
(c) Location in PESM Atlantic Ocean
· Picinguaba Fig. 1: a: location in Brazil; b: State of São Paulo; c: Serra do Mar State Park and in the Picinguaba Nucleus, with distinction to the site of the nucleus (X) and collections sites A, B, C and D. BR-101, Federal Highway Rio-Santos.
3
Mem Inst Oswaldo Cruz, Rio de Janeiro, Vol. 95(1), Jan./Feb. 2000
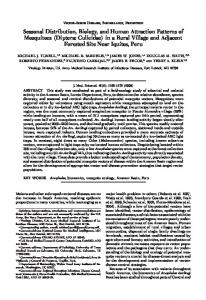
With annual temperature averages above 22ºC, the general climate is defined as superhumid tropical (tU) without a dry season. According to climatic data (Agricultural Research Center of the Campinas State University, Unicamp, State of São Paulo) in the ten preceding years of our observations studies, temperature, relative humidity and rainfall averages were 22.3ºC, 91.4% and 1,979.6 mm, respectively (Tables I, II). The monthly average temperatures varied from 27.4ºC to 14.4ºC from 1981 to 1990, with extreme temperatures of 33.5ºC (January 1988) and 11.6ºC (August 1983). The relative humidity was always high, sometimes reaching 100%. Even in cooler and drier months (June, July and August) the minimum relative humidity averages were never below 81% (Table I). The annual average rainfall was 1,980 mm from 1981 through 1990. During the traditionally drier months (June, July and August) rainfall averages of 91.2 mm, 90.6 mm and 66.2 mm, respectively, were observed. During our study, the greater and the lower precipitation were respectively 272.4 mm in February and 64.4 mm in August 1992 (Table II). Four collection sites with different biotopes of the Atlantic Maciço region were selected, sites A/ B/C/D, with the intention of study the influence of vegetation cover and climate variations on the mosquito fauna (Fig. 1). Collection sites are described below. Site A: located along the margins of the Fazenda River in the swampy area of the sandy lands through along the 3,500 m of Fazenda Beach, which is the only sea level point of the park. Aquatic vegetation partially covers the swamp and so influence the local mosquito fauna. Site B: outside the beach zone, approximately 1,500 m from the sea. It typically consists of shrub vegetation cover and is frequently subjected to floods during the rainy season, creating small swampy habitats. The soil is sandy with leaf material in edaphication process. Site C: this is the most representative of the region’s primitive forest, not only because of taller vegetation with orchids and bromeliads, but also for its humidity and temperature levels. Site D: this site, a clearing in a forested area, was chosen as a representative site of existing human activity in the interior of the park. One of the residences was selected to evaluate Culicidae cohabitation. Biweekly collections in sites A, B and C were conducted in three periods each day: daylight (10:00-12:00 h and 14:00-16:00 h) and nocturnal (18:00-21:00 h). In each sampling period two team members collected mosquitoes by mouth aspirators using themselves as attractant.
a
o
Temperature ( C) J 30 D
N
F
M
20
10
O
A
S
M
A
J J
b
Relative Humidity (% ) J 100 D
N
F
M
90
O
A
80
S
M
A
J J
10-year Maximum Average (1981-90) 10-year Minimum Average (1981-90) 10-year General Average (1981-90) Average of 1991 Average of 1992
Fig. 2: temperature (a) and relative humidity (b) measurements and monthly averages, verified during the samplings, in the Picinguaba Nucleus of the Serra do Mar State Park, State of São Paulo, from January 1991 to December 1992. Ten-year general, maximum and minimum averages for temperature and relative humidity averages, verified at the meteorological station of Campinas State University, in city of Ubatuba, State of São Paulo, from January 1981 to December 1990.
A
Year
1991 1992 1991 1992 1991 1992 1991 1992
B C D
Aver 1991 Aver1992 Max Aver 1981/90 Aver 1981/90 Min Aver 1981/90
January
February
March
April
August
September October
November December Average
oC
%
oC
%
oC
%
oC
%
oC
May %
oC
June %
oC
July %
oC
%
oC
%
oC
%
oC
%
oC
%
oC
%
27 26.1 26.6 26.8 27.7 26.9 23.5 24
92 91 93 91 92 93 89 91
26.3 26.2 26.1 26 25.8 25.7 25 24.6
94 92 95 94 95 93 91 90
25.7 25.1 25.3 25.9 25 25.2 23.1 23
93 92 94 95 94 96 90 89
25.2 25.5 24.1 25.2 24.7 25 23.9 23.3
91 90 92 94 92 93 89 90
22 22.3 21.6 22.1 21.5 22 21.9 22.3
90 91 91 92 91 91 90 90
21.2 21 20.9 20.3 21.1 20.3 21.3 21.1
89 90 92 90 92 91 91 90
19.9 19.2 18.8 19 18.9 19.7 21.4 21.3
88 87 91 90 91 91 90 90
18 18.4 18.2 18.3 17.9 17.3 21.5 21
86 87 90 89 91 90 90 91
19.3 18.9 19.2 19.4 18.9 19.2 21.1 21
91 92 93 91 93 91 90 90
22.7 22.1 20.9 21 20 19 22.6 22.1
91 90 92 92 91 92 91 90
23.5 22.9 20.4 21 22.1 22 23.4 22.9
93 91 94 92 93 92 90 90
26.2 26.1 24.1 25.6 24.4 26 24.2 23.9
92 93 94 92 93 92 91 91
23.1 22.8 22.2 22.5 22.3 22.3 22.7 22.5
90.8 90.5 92.6 91.8 92.3 92.1 90.2 90.2
26.2 25.9 27.4 25.8 23.8
91.5 91.5 94 91.4 86
25.8 25.6 26.6 26 24.9
93.7 92.2 94 92.2 88
24.8 24.8 26.4 25 23.3
92.7 93 95 92.7 90
24.5 24.7 25.8 23.2 18.9
91 91.7 94 92.7 90
21.7 22.2 22.7 21 18
90.5 91 95 91.9 90
21.1 20.7 21.5 19.6 15.3
91 90.2 94 91.7 86
19.7 19.8 21 18.9 14.7
90 89.5 94 89.3 81
18.9 18.7 21.1 19.4 14.4
89.2 89.2 94 89.9 85
19.6 19.6 20.8 19.5 16.2
91.7 91 96 92.1 88
21.5 21 22.6 21.5 19.9
91.2 91 93 91.4 89
22.3 22.2 24.6 23.3 22.4
92.5 91.2 95 90.5 88
24.7 25.4 26.2 24.3 23.1
92.5 92 94 92 91
22.6 22.5 23.2 22.3 20
91.5 91.1 94 91.4 90
Aver: averages; Max Aver: maximum averages; Min Aver: minimum averages
TABLE II Total monthly and annual cumulative rainfall measurements (mm), taken at the Picinguaba Nucleus in Serra do Mar State Park, State of São Paulo, from January 1991 to December 1992. Total monthly and annual cumulative rainfall averages, taken at the meteorological station at Campinas State University, City of Ubatuba, State of São Paulo, from January 1981, to December 1990 Year
January
February
March
April
May
June
July
August
September October
November December
Total
1991 1992
249.7 248.5
272.4 268.5
246.6 242.8
183.9 179.8
104.2 118.8
114.4 98.8
85.4 79.4
80.9 64.4
115.7 140.8
216.2 214.5
229.9 262.7
236.8 295.3
2136.1 2214.3
Average 1981/90
194.6
262.4
267.2
198.7
150.8
91.2
90.6
66.2
139.4
155.3
138.5
224.7
1979.6
Ecology of Mosquitoes - I Anthony Érico Guimarães et al.
Station
4
TABLE I Temperature (ºC) and relative humidity (%) monthly and annual averages, taken during the samplings, by capture station and general, at the Picinguaba Nucleus in Serra do Mar State Park, State of São Paulo, from January 1991 to December 1992. Temperature and relative humidity general averages and maximum and minimum averages, verified at the meteorological station of Campinas State University, City of Ubatuba, State of São Paulo, from January 1981 to December 1990
Mem Inst Oswaldo Cruz, Rio de Janeiro, Vol. 95(1), Jan./Feb. 2000
Human-bait collection was also conducted in site D biweekly and simultaneously in three different situations: inside the house, catching not only specimens attracted by man but also those resting on the internal walls; outside the house, catching mosquitoes attracted by human-bait and also those resting on the external walls of the house; and around the house, collecting specimens attracted by human-bait at the margins of the forest that surrounds the house, in distances never more than 50 m. However, collections were only conducted from 18:00-21:00 h. During collections, temperature and relative humidity were recorded hourly at each side using Incoterme maximum and minimum thermometers and Hugger pointer hygrometers located at each site and 1 m above ground level. Temperature and relative humidity were also recorded inside the domicile. Rainfall measurements were obtained from the Agriculture Research Center, Campinas State University, State of São Paulo. Collected mosquitoes were killed by chloroform and arranged in labeled small boxes. Mosquitoes were returned to the laboratory where they were identified according to classic literature and systematic proposals of Harbach and Kitching (1998) and Judd (1996, 1998) for the Sabethini tribe. Specimens were incorporated in the Entomological Collection, Entomology Department, IOC, Fiocruz, under the title of “Atlantic Forest Collection”. The relationships between the incidence of mosquito fauna and local climatic variables were established by the linear correlation coefficient. The significance of the measurements made during the period of the study, 1991 and 1992, was evaluated by its insertion in the ten-year climatic graphs: temperature and relative humidity polar graphic and rainfall curve for the previous ten-years. Graphical representation and statistical analysis were made for common species. No statistical evaluation was done for rare species, those species whose total number of individuals collected represented less than 1% of the total number collected in each subfamily or tribe. Then tolerance interval was calculated using the mean and the stand deviation of the number of collected mosquitoes of a species by month throughout the study. RESULTS
From January 1991 to December 1992, 622 collections were made. A total of 24,943 adult mosquitoes among 57 species were collected (Table III). Members of Culicinae (excluding Sabethini) were the most frequently collected (72.5%), followed by Sabethini (21.8%) and Anophelinae
5
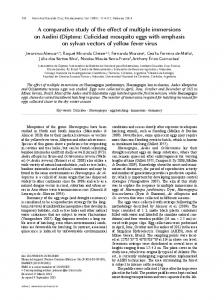
(5.7%). However, the Sabethini were responsible for the greatest species diversity with 34 among the 57 species collected during the study (Table III). We did not observe much variations in measurements regarding the temperature, relative humidity or rainfall between the corresponding months in the years of 1991 and 1992. The temperature and relative humidity averages in the period were, respectively, 22.6ºC and 91.5% in 1991 and 22.5ºC and 91.1% in 1992. The total of accumulated rainfall was 2,136 mm and 2,215 mm for 1991 and 1992 (Tables I, II). The analysis of temperature and relative humidity on the polar graph for the period of 1981 to 1990, shows that the averages for the same factors in 1991 and 1992 were within the maximum and minimum limits for the ten-year averages verified in the PESM (Fig. 2a, b). A similar correlation was observed for the rainfall in the same periods. The ten-year average curve obtained for the rainfall during the ten years, 1981 to 1990, is compared to the measurements along the 1991-1992 experiment (Fig. 3a). The linear correlation obtained from the years of 1991 and 1992 compared to the ten-year average show that the rainfall similarities of those two years are significant (Fig. 3b). For the majority of the species the greatest number of specimens were captured during the hottest, most humid and rainiest period, from November to March, and decrease during the coldest, driest and less rainy period, from May to August (Figs 4, 5). This data supports the existence of a direct relationship between the monthly capture frequency in the majority of the mosquito species and some aspects of the regional climate. Among the Anopheles, adult An. oswaldoi and An. cruzii were absent in the June and July biting collections, respectively. Their greatest abundances were registered in March and September for the first species and January, March and November for the second. The other two species captured were An. fluminensis, which presented their highest incidences in January and October and for An. mediopunctatus in January. These last two species were captured throughout the year (Table IV, Fig. 4). The two Culex species were absent in only one month during the year, Cx. nigripalpus in July and Cx. quinquefasciatus in August. Cx. nigripalpus was found exclusively in the samples taken in the forest environment and its highest incidence was observed in March. Cx. quinquefasciatus was not captured in sylvatic environments and its highest incidence occurred in November (Table IV, Fig. 4).
6
Ecology of Mosquitoes - I Anthony Érico Guimarães et al.
TABLE III Specific listing, absolute number (N) of the Culicidae captured at the Picinguaba Nucleus in Serra do Mar State Park, State of São Paulo, from January 1991 to December 1992, with the respective percentages to the total of specimens (%g) and to the subfamily or tribe (%p) Species
N
%p
%g
579 3 6 91 1 14 365 359
40.8 0.2 0.4 6.4 0.1 1 25.7 25.3
2.3 0 0 0.4 0 0.1 1.5 1.4
100
5.7
ANOPHELINAE Anopheles (Kerteszia) cruzii Dyar & Knab, 1909 Anopheles (Nyssorhynchus) albitarsis Lynch-Arribalzaga, 1878 Anopheles (Nyssorhynchus) argyritarsis Robineau-Desvoidy, 1827 Anopheles (Nyssorhynchus) oswaldoi (Peryassú, 1922) Anopheles (Nyssorhynchus) strodei Root, 1926 Anopheles (Anopheles) intermedius (Chagas, 1908) Anopheles (Anopheles) fluminensis Root, 1927 Anopheles (Anopheles) mediopunctatus (Theobald, 1903) Sub-total
1,418
C U L I C I N A E (excluding SABETHINI) Culex (Culex) nigripalpus Theobald, 1901 Culex (Culex) quinquefasciatus Say, 1823 Orthopodomyia albicosta (Lutz, 1905) Aedes (Ochlerotatus) serratus (Theobald, 1901) Aedes (Ochlerotatus) scapularis (Rondani, 1848) Aedes (Ochlerotatus) fluviatilis (Theobald, 1903) Aedes (Ochlerotatus) fulvus (Wiedemann, 1828) Aedes (Protomacleaya) terrens Walker, 1856 Coquillettidia (Rhynchotaenia) chrysonotum (Peryassú, 1922) Coquillettidia (Rhynchotaenia) venezuelensis (Theobald, 1912) Psorophora (Janthinosoma) ferox (Hunboldt, 1820) Psorophora (Janthinosoma) albipes (Theobald, 1907) Haemagogus (Conopostegus) leucocelaenus (Dyar & Shannon, 1924) Haemagogus (Haemagogus) capricornii Lutz, 1904 Uranotaenia geometrica Lutz, 1901
286 207 1 1,703 488 16 254 12 11,414 1,612 1,300 777 16 3 3
Sub-total
18,092
1.6 1.1 0 9.4 2.7 0.1 1.4 0.1 63.1 8.9 7.2 4.3 0.1 0 0 100
1.1 0.8 0 6.8 2 0.1 1 0 45.8 6.5 5.2 3.1 0.1 0 0 72.5
SABETHINI Shannoniana fluviatilis (Theobald, 1903) Trichoprosopon digitatum Rondani, 1848 Trichoprosopon pallidiventer (Lutz, 1905) Trichoprosopon simile Lane & Cerqueira, 1942 Runchomyia (Isostomyia) lunata (Theobald, 1901) Runchomyia (Runchomyia) reversa Lane & Cerqueira, 1942 Runchomyia (Runchomyia) theobaldi Lane & Cerqueira, 1942 Runchomyia (Runchomyia) frontosa (Theobald, 1903) Runchomyia (Runchomyia) humboldti Lane & Cerqueira, 1942 Wyeomyia (Cruzmyia) dyari Lane & Cerqueira, 1942 Wyeomyia (Dendromyia) confusa (Lutz, 1905) Wyeomyia (Dendromyia) mystes (Dyar, 1924) Wyeomyia (Dendromyia) aporonoma Dyar & Knab, 1906 Wyeomyia (Dendromyia) personata (Lutz, 1904) Wyeomyia (Dendromyia) shannoni Lane & Cerqueira, 1942 Wyeomyia (Wyeomyia) oblita (Lutz, 1905) Wyeomyia (Phoniomyia) theobaldi Lane & Cerqueira, 1942 Wyeomyia (Phoniomyia) flabelata Lane & Cerqueira, 1942 Wyeomyia (Phoniomyia) pilicauda (Root, 1928) Wyeomyia (Phoniomyia) splendida (Bonne-Wepster & Bonne, 1919)
1 76 151 6 7 91 38 179 6 553 134 534 558 12 109 1 246 394 11 350
0 1.4 2.8 0.1 0.1 1.7 0.7 3.3 0.1 10.2 2.5 9.8 10.3 0.2 2.0 0 4.5 7.3 0.2 6.4
0 0.3 0.6 0 0 0.4 0.2 0.7 0 2.2 0.5 2.1 2.2 0 0.4 0 1 1.6 0 1.4 cont.
7
Mem Inst Oswaldo Cruz, Rio de Janeiro, Vol. 95(1), Jan./Feb. 2000
Wyeomyia (Phoniomyia) palmata Lane & Cerqueira, 1942 Wyeomyia (Phoniomyia) longirostris (Theobald, 1901) Wyeomyia (Phoniomyia) quasilongirostris (Theobald, 1907) Wyeomyia (Phoniomyia) davisi Lane & Cerqueira, 1942 Wyeomyia (Phoniomyia) bonnei Lane & Cerqueira, 1942 Wyeomyia (Phoniomyia) lassalli (Bonne-Wepster & Bonne, 1921) Limatus flavisetosus Castro, 1935 Limatus durhami Theobald, 1901 Limatus pseudomethisticus (Bonne-Wepster & Bonne, 1919) Sabethes (Sabethes) quasicyaneus Peryassú, 1922 Sabethes (Sabethinus) intermedius (Lutz, 1904) Sabethes (Sabethinus) identicus Dyar & Knab, 1907 Sabethes (Sabethinus) fabricii Lane & Cerqueira, 1942 Sabethes (Sabethinus) soperi Lane & Cerqueira, 1942
63 325 178 71 335 56 499 130 290 3 1 19 3 3
Sub-total Total
a
1.2 6 3.3 1.3 6.2 1 9.2 2.4 5.3 0.1 0 0.3 0.1 0.1
5,433
100
24,943
100
0.3 1.3 0.7 0.3 1.3 0.2 2 0.5 1.2 0 0 0.1 0 0 21.8 100
R ainfall
mm 30 0 25 0 20 0 15 0 10 0 50 0 J
F
M
A
M
Average 1991
J
A
S
O
N
D
m onths
10-year Average (1981-90)
Average 1992
b
J
mm
Correlation - Rainfall
350 300
r = 0,815
250 200
r = 0,838
150 100 50 0 50
100
150
200
250
300
Rainfall 10 Year Averages 1981-90 (mm)
1991
1992
Linear (1991)
Linear (1992)
Fig. 3-a: pluvial precipitation monthly averages, measured at the Picinguaba Nucleus of the Serra do Mar State Park, State of São Paulo, in 1991 and 1992 and rainfall ten-year average in the meteorological station of Campinas State University, in City of Ubatuba, State of São Paulo, from 1982 to 1991; b: linear correlation (r) of monthly rainfall average. The measurements were made in the Picinguaba Nucleus at PESM, State of São Paulo, in 1991 and 1992 and rainfall ten-year average in the meteorological station of Campinas State University, in City of Ubatuba, State of São Paulo, from 1981 to 1990. r 0.01(2),10 = 0.708
8
Ecology of Mosquitoes - I Anthony Érico Guimarães et al.
TABLE IV Absolute number of Culicidae captured monthly at the Picinguaba Nucleus in Serra do Mar State Park Picinguaba Nucleus, State of São Paulo, from January 1991 to December 1992 Species Jan Fev Mar Abr ANOPHELINAE Anopheles cruzii 90 39 107 53 An. albitarsis 0 0 0 0 An. argyritarsis 0 2 0 0 An. oswaldoi 12 9 22 5 An. strodei 0 0 0 0 An. intermedius 2 0 3 4 An. fluminensis 70 5 19 8 An. mediopunctatus 133 22 52 14 Sub-total 307 77 203 84 C U L I C I N A E (excluding SABETHINI) Culex nigripalpus 32 14 86 12 Cx. quinquefasciatus 10 1 8 13 Orthopodomyia albicosta 0 1 0 0 Aedes serratus 184 90 152 96 Ae. scapularis 48 61 80 56 Ae. fluviatilis 0 0 1 0 Ae. fulvus 19 44 66 16 Ae. terrens 6 2 1 0 Coquillettidia chrysonotum 1,914 748 1,588 1,547 Cq. Venezuelensis 146 159 236 291 Psorophora ferox 138 48 105 120 Ps. albipes 161 37 67 88 Haemagogus leucocelaenus 2 1 2 1 Ha. capricornii 0 0 0 0 Uranothaenia geometrica 0 0 0 0 Sub-total 2,660 1,206 2,392 2,240 SABETHINI Shannoniana fluviatilis 0 0 0 0 Trichoprosopon digitatum 17 4 10 1 Tr. pallidiventer 1 1 1 24 Tr. simile 2 0 0 1 Runchomyia lunata 0 1 3 0 Ru. reversa 5 3 7 2 Ru. theobaldi 0 26 2 2 Ru. frontosa 15 11 24 13 Ru. humboldti 0 0 0 0 Wyeomyia dyari 140 55 78 39 Wy. confusa 41 6 21 16 Wy. mystes 37 10 51 53 Wy. aporonoma 32 50 80 79 Wy. personata 2 0 1 0 Wy. shannoni 27 11 18 4 Wy. oblita 0 0 0 0 Wy. theobaldi 80 46 42 34 Wy. flabelata 40 25 39 31 Wy. pilicauda 0 2 4 1 Wy. splendida 45 14 37 32 Wy. palmata 7 0 1 5 Wy. longirostris 38 39 45 21 Wy. quasilongirostris 37 4 5 10 Wy. davisi 9 5 6 1 Wy. bonnei 38 7 39 58 Wy. lassali 0 0 0 0 Limatus flavisetosus 95 54 59 72 Li. durhami 25 12 15 25
Mai
Jun
Jul Ago
Set
Out Nov
Dez Total
6 1 0 3 0 2 5 15 32
12 0 0 0 1 3 12 12 40
0 0 0 5 0 0 32 9 46
8 0 2 3 0 0 13 42 68
66 0 0 18 0 0 40 10 134
71 1 0 8 0 0 76 24 180
43 579 1 3 2 6 2 91 0 1 0 14 60 365 2 359 110 1,418
5 4 6 6 0 0 75 194 51 37 0 0 20 18 0 0 211 102 88 114 130 396 82 150 2 4 0 0 1 0 671 1,025
0 5 0 173 12 0 11 1 4 8 51 22 0 0 1 288
34 0 0 166 24 0 0 1 48 18 25 9 1 0 0 326
1 4 2 1 0 18 0 29 4 24 2 35 48 0 3 0 12 46 1 2 0 10 7 1 10 0 19 8
0 7 54 1 0 23 0 32 0 31 7 108 69 0 11 0 13 61 2 31 12 51 34 14 19 4 16 18
0 1 0 0 0 1 3 8 0 6 1 18 22 0 0 0 15 8 0 12 0 6 5 0 6 0 8 5
0 1 2 0 0 2 4 4 0 7 1 25 12 0 0 1 0 16 1 2 0 5 3 0 3 0 3 2
84 0 0 4 0 0 25 24 137
33 14 29 23 286 28 31 77 22 207 0 0 0 0 1 117 150 193 113 1,703 36 18 16 49 488 0 1 14 0 16 0 0 43 17 254 0 1 0 0 12 90 1,012 2,077 2,073 11,414 20 106 188 238 1,612 46 56 131 54 1,300 11 25 90 35 777 0 0 2 1 16 0 0 2 1 3 0 0 1 0 3 381 1,414 2,863 2,626 18,092 0 6 58 0 1 13 0 16 0 14 14 67 83 0 16 0 0 48 0 33 1 7 24 3 20 52 73 2
0 13 3 0 1 5 0 19 2 48 5 37 19 4 7 0 0 28 0 19 3 20 18 18 32 0 29 11
0 3 5 1 1 7 1 4 0 68 7 37 28 0 5 0 0 32 0 85 27 64 19 4 69 0 38 3
0 9 0 0 0 5 0 4 0 43 13 56 36 5 7 0 4 20 0 38 7 19 12 10 34 0 33 4
1 76 151 6 7 91 38 179 6 553 134 534 558 12 109 1 246 394 11 350 63 325 178 71 335 56 499 130 cont.
9
Mem Inst Oswaldo Cruz, Rio de Janeiro, Vol. 95(1), Jan./Feb. 2000
Li. pseudomethisticus Sabethes quasicyaneus Sa. intermedius Sa. identicus Sa. fabricii Sa. soperi Sub-total Total
39 18 20 44 0 0 1 0 0 0 0 0 3 14 0 1 0 0 0 0 0 0 0 0 775 418 609 569 3,742 1,701 3,204 2,893
4 2 0 0 0 1 1 0 0 0 1 0 131 97 834 1,162
%
Anopheles cruzii
%
19 20 55 19 20 30 290 0 0 0 1 1 0 3 0 0 0 0 0 0 1 0 0 0 0 0 0 19 0 1 0 0 1 1 3 0 0 0 1 0 1 3 306 639 606 362 530 391 5,433 640 1,033 1,121 1,956 3,530 3,127 24,943
Ae. fulvus
40
40 30 20 10 0
30 20 10 months J
F
M
A
M
J
J
A
S
O
N
months J
An. oswaldoi
%
months F
M
A
M
J
M
A
J
A
S
O
N
M
J
J
A
S
O
N
D
S
O
N
D
S
O
N
D
A
S
O
N
D
A
S
O
N
D
Coquillettidia chrysonotum
40 30 20 10 0
months
D
J
F
M
A
%
An. fluminensis
%
F
%
40 30 20 10 0 J
0
D
M
J
J
A
Cq. venezuelensis
40
40 30 20 10 0
30 20 10 months J
F
M
A
M
J
J
A
S
O
N
0 J
An. mediopunctatus
%
months
D
F
M
A
M
J
J
A
Psorophora ferox
% 40
40 30
30 20
20 10 0
10 months J
F
M
A
M
J
J
A
S
O
N
months
0
D
J
Culex. nigripalpus
%
F
M
A
M
%
40
J
J
Ps. albipes
40
20
20 months
0 J
F
M
A
%
M
J
J
A
S
O
N
months
0
D
J
Cx. quinquefasciatus
F
M
A
40
30
30
20
20
10
J
J
Trichoprosopon digitatum
%
40
M
10
0 J
F
M
A
M
%
J
J
A
S
O
N
months D
0
months J
Aedes serratus
F
M
A
M
J
A
S
O
N
D
A
S
O
N
D
A
S
O
N
D
Tr. pallidiventer
%
40
J
40
30
30
20
20
10
10
0
months J
F
M
A
M
%
J
J
A
S
O
N
0
months
D
J
Ae. scapularis
F
M
A
M
40
30
30
20
20
J
Ru. reversa
%
40
J
10
10 0
months J
F
M
A
%
M
J
J
A
S
O
N
0
months J
D
Runchomyia frontosa
F
M
A
M
J
J
monthly frequency percentage
40 30
distribution medium value
20 10 0
months J
F
M
A
M
J
J
A
S
O
N
D
tolerance interval expected
Fig. 4: relation between the monthly frequency percentage and the tolerance intervals expected for the Culicidae species at Picinguaba Nucleus in Serra do Mar State Park, State of São Paulo, from January, 1991 to December, 1992.
10
Ecology of Mosquitoes - I Anthony Érico Guimarães et al.
Ae. serratus and Ae. scapularis occurred in all months along the year with consistant incidences, especially the first species, which presented only a slight increase in January. In the case of Ae. scapularis, the greatest occurrences were observed from December to March, with its maximum incidence recorded in March. Ae. fulvus was absent in the samples taken in August, September and October, and was present at highest levels in March (Table IV, Fig. 4). Cq. chrysonotum, the species with the largest number of specimens (Table III), and Cq. venezuelensis occurred in all monthly samples. The highest incidences in Cq. venezuelensis happened in October and April. In Cq. chrysonotum there were incidence peaks in November and in April (Fig. 4). Ps. ferox and Ps. albipes have practically disappeared in August, besides being captured at all samples throughout the study (Table IV, Fig. 4). The Sabethini, responsible for 60% of the species found at the present study, were represented by the six genera identified in Brazil. Shannoniana and Sabethes were not analyzed for monthly prevalence because they represented less than 1% of the tribe specimens total collected. Tr. appeared in all months. Tr. pallidiventer, although more abundant than Tr. digitatum, was captured neither in May nor in December (Table IV, Fig. 4). Ru. reversa and Ru. frontosa showed similar distribution: they were captured throughout the year, with greatest peaks of incidence concentrated in July and August (Table IV, Fig. 4). Four subgenera of Wyeomyia were present. Wy. aporonoma occurred at maximal levels in January and the Wy. dyari in March, April and September (Table IV, Fig. 5). Wy. mystes, which was found throughout the year, was most abundant in August and September. Wy. confusa and Wy. shannoni were most abundant in January with population lowest in May, June and July (Table IV, Fig. 5). Of Wyeomyia, Phoniomyia had the greatest number of common species. From the eight species in this situation, Wy. flabelata, Wy. splendida, Wy. bonnei, Wy. longirostris and Wy. quasilongirostris were found throughout the year. Wy. splendida, Wy. longirostris and Wy. bonnei were most abundant in August and Wy. flabelata and Wy. quasilongirostris in November (Table IV, Fig. 5). Wy. theobaldi, Wy. palmata and Wy. davisi were not captured in May. In addition, Wy. theobaldi was not found in September, October or November, Wy. palmata not in February, June or July and Wy. davisi not in June (Table IV, Fig. 5). Among the four Limatus species that occur in Brazil, three were found in the studied area. Li. flavisetosus and Li. pseudomethisticus showed the
lowest number of specimens in May and June, with the greatest incidence in January and in September, respectively. Li. durhami was captured with two abundance peaks in January and April and two valleys in June and September (Table IV, Fig. 5). To prove the influence of the climatic factors in Culicidae fauna incidence in the Picinguaba Nucleus in PESM, the importance of this relationship was observed through the linear correlation coefficient, at a 0.1 level of significance. This analyses gave the critical value of “r” = 0.497. According to the analysis, temperature was the climatic variable with the greatest influence upon Culicidae fauna incidence. An. cruzii, An. mediopunctatus, Ae. scapularis, Ae. fulvus, Cq. chrysonotum, Cq. venezuelensis, Wy. dyari, Wy. confusa, Wy. shannoni, Wy. theobaldi and Li. flavisetosus responded positively to temperature, what means that a rise in the number of specimens was directly related to the rise in temperature (Table V). In Ru. reversa, this variable has influenced negatively: with an increase in temperature, a decrease in the number of specimens was observed (Table V). A correlation based on relative humidity variations was detected for four species. For Ae. scapularis and Cq. venezuelensis, it worked positively, with the rise of relative humidity causing an increase in the number of specimens collected (Table V). The negative correlation seen for Ae. serratus and Ru. reversa can not be easily explained but may relate to their bionomics. An. cruzii, Ae. scapularis, Ae. fulvus and Cq. venezuelensis were captured in greater numbers every time an increase in rainfall occurred (Table V). In Sabethini species for which this influence was observed, it acted positively upon Wy. theobaldi and Li. flavisetosus, and negatively upon Ru. reversa (Table V). According to the linear correlation coefficients, in some of the species more than one of the studied climatic factors influenced the population dynamics. For Ae. scapularis, Cq. venezuelensis and Ru. reversa, the three factors (temperature, relative humidity and rainfall) were significant. For the incidences of An. cruzii, Ae. fulvus, Wy. theobaldi and Li. flavisetosus the temperature and rainfall variations were conclusive. For the species under significant influence of just one of the climatic factors, it was observed for temperature An. mediopunctatus, Cq. chrysonotum, Wy. dyari, Wy. confusa and Wy. shannoni and for relative humidity Ae. serratus (Table V). DISCUSSION
The greatest number of Sabethini species in comparison to the other taxa is in agreement with
Mem Inst Oswaldo Cruz, Rio de Janeiro, Vol. 95(1), Jan./Feb. 2000
research made in other regions with similar configurations to those of the Picinguaba Nucleus of the PESM. Guimarães and Arlé (1984) in the National Park of Serra dos Órgãos - PNSO, State of Rio de Janeiro; Guimarães et al. (1991) in the National Park of Serra da Bocaina - PNSB, State of Rio de Janeiro and State of São Paulo; Guimarães et al. (1994a) in the National Park of Iguaçu - PNI, State of Paraná, and Lopes (1996) in the Biological Reserve of Tinguá - RBT, State of Rio de Janeiro. However, these studies found the greatest diversity of species but also the largest number of captured specimens belong to this tribe. In the present study, the highest number of specimens belonged to the Culicinae subfamily (exclude Sabethini), due mainly to the high incidence of Cq. chrysonotum, which comprised 46% of the total of mosquitoes captured (Table III). The environment where the captures took place
11
seemed to influence the incidence of the Culicidae fauna. Even with similar climatic conditions, such as PESM and PNSO, the slight differences in vegetation coverage and topography may offer significant differences in the ability to support the development of certain species immature phases. The vegetation age may also influence the overall number of specimens of certain species, by providing greater possibility for breeding sites in tree hollows; for example, many sabethines lay their eggs in the more ancient trees (Neves 1972). Considering the species captured in the Picinguaba Nucleus of the PESM, it is probable that the incidence of the Culicidae fauna is influenced by climatic factors, as observed by different authors in similar areas: Causey and Santos (1949), Galindo et al. (1950), Forattini et al. (1968, 1978 a, b), Neves (1972), Guimaraes and Arlé (1984), Guimarães et al. (1991, 1994a, b) and Lopes (1996).
TABLE V Linear correlation coefficients (r) between Culicidae and temperature, relative humidity and rainfall ten-year average verified at the meteorological station in Campinas State University, City of Ubatuba, State of São Paulo, from January 1981, to December 1990. r 0.1(2) 10 = 0.497 Species Anopheles cruzii An. oswaldoi An. fluminensis An. mediopunctatus Culex nigripalpus Cx. quinquefasciatus Aedes serratus Ae. scapularis Ae. fulvus Coquillettidia chrysonotum Cq. venezuelensis Psorophora ferox Ps. albipes Trichoprosopon digitatum Tr. pallidiventer Runchomyia reversa Ru. frontosa Wyeomyia dyari Wy. confusa Wy. luteoventralis Wy. aporonoma Wy. shannoni Wy. theobaldi Wy. flabelata Wy. splendida Wy. palmata Wy. longirostris Wy. quasilongirostris Wy. davisi Wy. bonnei Limatus flavisetosus Li. durhami Li. pseudomethisticus
Temperature (oC) Relative humidity (%) 0.634 NS NS NS NS NS NS 0.642 0.655 0.690 0.748 NS NS NS NS -0.537 NS 0.767 0.601 NS NS 0.504 0.704 NS NS NS NS NS NS NS 0.610 NS NS
NS NS NS NS NS NS -0.581 0.826 NS NS 0.639 NS NS NS NS -0.726 NS NS NS NS NS NS NS NS NS NS NS NS NS NS NS NS NS
Rainfall (mm) 0.585 NS NS NS NS NS NS 0.810 0.652 NS 0.732 NS NS NS NS -0.563 NS NS NS NS NS NS 0.556 NS NS NS NS NS NS NS 0.571 NS NS
12
Ecology of Mosquitoes - I Anthony Érico Guimarães et al.
Nimer (1979) considered that in some Brazilian regions, alternations in tropical and temperate climate characteristics occur. Bates (1949) defined that in the temperate climate mosquitoes incidence varies according to the season of the year and in the tropical climate exclusively controlled by the rainfall. Causey and Santos (1949), Galindo et al. (1950) and Forattini et al. (1968) reported that rainfall is determinant to the mosquito density in tropi-
%
%
Wyeomyia bonnei
40
cal forest areas. Forattini et al. (1968), Guimarães and Arlé (1984) and Guimarães et al. (1994b) reported that temperature and relative humidity variations directly influenced mosquitoes and that they may even disappear during the driest months of the year. These authors and Bates (1949) affirmed that some mosquito species grow proportionally to the local rainfall.
Wy. dyari
40
30
30
20
20
10
10 months
0 J
F
M
A
M
J
J
A
S
O
N
0
D
J
40
% 40
30
30
20 10
20
Wy. flabelata
%
F
M
A
M
J
J
A
S
O
N
months D
A
S
O
N
months D
A
S
O
N
D
A
S
O
N
months D
A
S
O
N
D
Wy. confusa
10
0
0 J
F
M
A
%
M
J
J
A
S
O
N
D months
J
F
M
A
M
%
Wy. quasilongirostris
40 30
40
20 10 0
20
J
J
Wy. mystes
30 10 months J
F
M
A
M
J
J
A
S
O
N
J
Wy. theobaldi
%
months
0
D
F
M
A
M
40
30
30
20
20
10
J
Wy. aporonoma
%
40
J
10
0 J
F
M
A
M
%
J
J
A
S
O
Wy. palmata
N
D
months
J
F
M
A
M
J
J
Wy. davisi
%
42,86
40
0
40
30
30
20
20
10
10 months
0 J
F
M
A
M
%
J
J
A
S
O
N
0
D
months J
Wy. shannoni
F
M
A
M
40
30
30
J
Limatus flavisetosus
%
40
J
20
20 10
10 months
0 J
F
M
A
M
J
J
A
S
O
N
0
D
Wy splendida
%
months J
F
M
A
M
%
40
J
J
A
S
O
N
D
A
S
O
N
D
S
O
N
D
Li. durhami
40
30
30
20
20
10
10
0 J
F
M
A
M
%
J
J
A
S
O
N
D
months
Wy. longirostris
0
months J
F
M
A
40
30
30
20
20
10
J
J
Li. pseudomethisticus
%
40
M
10
0
months J
F
M
A
M
J
J
A
S
O
monthly frequency percentage
N
D
0
months J
F
M
A
M
J
J
A
tolerance interval expected
distribution medium value Fig. 5: relation between the monthly frequency percentage and the tolerance intervals expected for the Culicidae species at Picinguaba Nucleus in Serra do Mar State Park, State of São Paulo, from January, 1991 to December, 1992.
Mem Inst Oswaldo Cruz, Rio de Janeiro, Vol. 95(1), Jan./Feb. 2000
Forattini et al. (1968) and Guimarães and Arlé (1984) observed that certain mosquito species, after a rise in density, decrease significantly in the subsequent month, and may even totally disappear. A similar phenomenon was observed after January sampling for An. fluminensis, An. mediopunctatus, Ps. ferox, Ps. albipes, Tr. digitatum and Wy. quasilongirostris, in March for An. oswaldoi, Cx. nigripalpus, Ae. fulvus and Tr. digitatum, in April for Tr. pallidiventer and Wy. bonnei, in June for Ps. ferox and Ps. albipes, in August for Wy. palmata, Wy. davisi and Li. durhami, in September for Li. flavisetosus, in October for Tr. digitatum, Wy. davisi and Li. durhami, and in November for Cx. quinquefasciatus, Ae. fulvus, Ps. ferox, Ps. albipes, Wy. splendida and Wy. palmata. After having incidence peaks in those months, they were practically absent in the following month (Table IV, Figs 4, 5). This kind of population behavior could be explained as an opportunistic reaction to some environmental factor that somehow favored the species leading to a population increase. When the environment conditions go back to normal, the population decreases. As an example, there is the increase of some mosquitoes populations due to the abundance of breeding sites provided by great amount of rain. In some species this incidence periodicity was observed for more than one month: Ae. fulvus in March and November, Ps. ferox and Ps. albipes in January, June and November, Tr. digitatum in January, March and October, Wy. palmata in August and November and Wy. davisi and Li. durhami in August and October (Table IV). We cannot include in this group Cq. chrysonotum and Cq. venezuelensis, among others. Although these species presented significant decrease in number of specimens in a certain month, these decreases occurred after at least two months of relatively stable high incidences. In those cases, the population levels seems to show a tendency to a determined period of the year related to a group of factors that favor the biological activity cycle of the species, for example the aquatic plants they use in their development. Concerning the two Coquillettidia species, the linear correlation coefficient indicates a significant influence of temperature, relative humidity and rainfall for Cq. venezuelensis and just temperature for Cq. chrysonotum (Table V). In the Mansoniini tribe, as the example of Cq. chrysonotum and Cq. venezuelensis, this distribution may also be linked to the kind of breeding sites. Species of this tribe differ from the other Culicidae by laying their eggs underneath the leaves of aquatic plants (Eichonia, Typha, etc.) and, after the eclosion in the water, the second stage
13
larvae fixes itself to these plants. In the present study, both species were captured from October to April (Fig. 4), period in which higher temperature and more rainfalls occurred. In this period, site A (swampy area) and site B (flooded area) were covered by those aquatic plants. Forattini et al. (1981) verified similar monthly frequency rates for both species. Most Sabethini are not exclusively conditioned to the existence of a special type of breeding site to lay their eggs. In the drier and cooler months there is a decrease of the breading sites, what favors Sabethini in detriment to other species that depend on breeding sites typical from hot and rainy months. This could be observed in the Sabethini population fluctuation from May to October (Table I, Fig. 4 and 5). Wy. (Phoniomyia) species, lay eggs exclusively in bromeliads. It was observed that some adults not only occurred in colder and drier periods, especially in July and August, but also had the highest population levels (Fig. 5). The maintenance of a central puddle of water in these plants permits the mosquito reproduction, especially in periods of low rainfall. Similar phenomenon may be observed for the other Sabethini studied: Wyeomyia [excluding Wy. (Phoniomyia)], Trichoprosopon, Runchomyia and Limatus, that, as well as bromeliads, have as breeding sites bamboo stems, tree hollows and leaf cavities in different plants. Guimarães et al. (1984) reported that immature forms of these genus are found at these breeding sites throughout the year. Comparing the species tolerance intervals in which would be expected the manifestation of monthly frequency with their incidence peaks it was observed that some were outside this range. The temporal distribution of An. cruzii was similar to that observed by Davis (1945) in the city of Teresópolis, State of Rio de Janeiro, in areas of PNSO that is, absent only in July. Guimarães and Arlé (1984) and Guimarães et al. (1994b), also in PNSO, and Azevedo (1997), in the vicinities of the city of Nova Friburgo, reported the presence of this species all year long. Comparing the incidence of the An. cruzii with its expected range, two population peaks above the maximum tolerance limits, and four below the minimum limit were highlighted (Fig. 4). These incidences occurred during opposite periods of temperature and rainfall. Comparing these data with the linear correlation coefficients of these two climatic factors (Table V), it was observed that both contributed significantly to the rise in the number of specimens in January, March and November and to the expressive decreases from May to August (Fig. 4).
14
Ecology of Mosquitoes - I Anthony Érico Guimarães et al.
An. oswaldoi and An. fluminensis presented population levels outside the maximum and minimum tolerance limits of the expected incidence range. However, the data available on the ecology of these species does not allow a greater evaluation of these indices. In the case of An. oswaldoi, the fact that this species lays its eggs in small collections of water in shadowy places in the forest may have contributed to its significant presence in March (Fig. 4). Guimarães and Arlé (1984), Guimarães et al. (1994b) and Forattini et al. (1995b) reported the same kind of monthly distribution found in our study for Cx. nigripalpus: decreased levels during the colder and drier months, and incidence peaks in March (Fig. 4). Guimarães and Arlé (1984), in a two-year observation in the PNSO, and Lourençode-Oliveira and Silva (1985) found population explosions of Cx. nigripalpus in the periods of the year which have the greatest amount of rain. Nayar (1983) stressed that this species incidence is completely controlled by the annual rainfall, which determines the number of lays and generations. Based on these studies, we associated the rainfall to the incidence above the maximum tolerance limit observed in March (Fig. 4), despite the fact that the direct influence of this climatic factor upon the frequency of this Culicidae was not verified by the linear correlation coefficient. Cx. quinquefasciatus, traditionally referred to as a totally domiciled mosquito, occurred in the site D with highest incidence in November, probably due to some environmental aspect directly related to human activities around the residence (Fig. 4). The monthly distribution observed for Ae. serratus and Ae. scapularis reinforces the hypothesis that temporary environmental conditions in the region environment significantly influenced the incidence of these mosquitoes. In the present study and as reported by Forattini et al. (1981) in the residual forest at Vale da Ribeira, State of São Paulo, Ae. scapularis was captured throughout the year. In Forattini et al. (1981), the greatest incidence peak occurred in June and in our case it was in March. (Fig. 4). Forattini et al. (1993), in a study performed in suburban areas with residual forest in the district of Pariquera Mirim, also in the Vale da Ribeira, did not find a significant correlation between the occurrence of this Culicidae and the annual rainfall, registering similar incidences in all months of the year. The same authors, in the same region but two years later, Forattini et al. (1995a), reported incidences comparable to those at PESM, including March peaks and decreases in the colder and drier months of June, July and August. Davis (1945) captured this species in higher percentages
during December to March, with an almost total absence from May to September. Guimarães and Arlé (1984) and Guimarães et al. (1994b) reported that the occurrence was concentrated from November to January, disappearing almost completely during winter. A similar distribution was observed by Neves (1972) in Parque das Mangabeiras, State of Minas Gerais. Causey and Santos (1949), in Passos, State of Minas Gerais, captured Ae. scapularis with relatively significant percentages in June and July, although they detected the greatest level from October to February. In the case of Ae. serratus, Causey and Santos (1949) and Forattini et al. (1981) reported incidence peaks in April. Davis (1945) and Guimarães and Arlé (1984) observed significant occurrences from November to February, while in our study the distribution was relatively constant during all months (Fig. 4). Forattini et al. (1993) demonstrated the existence of a significant correlation between rainfall and the incidence of this Culicinae. The small tolerance intervals found for Ae. serratus and Ae. scapularis conforms with the high sensitivity of these mosquitoes to the local climate. For Ae. scapularis, the linear correlation coefficient was significant for the three climatic variables analyzed (Table V). For Ae. serratus the most significant factor was relative humidity (Table V). References to the capture of Ae. fulvus in the Southern and Southeastern regions of Brazil are rare. Guimarães et al. (1994a) recorded the presence at PNI but did not mention its monthly frequency. In the Northern region, Luz (1994) in the State of Rondônia, refers to the species as being the most abundant, and directly influenced by the wet season. In our samplings Ae. fulvus followed this tendency, occurring above or below the expected tolerance limits due to temperature and rainfall variables (Fig. 4). By the linear correlation coefficient between these climatic factors and Ae. fulvus incidence, it can be observed that both variables were influential (Table V). Ps. ferox and Ps. albipes, presented the same kind of monthly frequency, maximum incidences above the tolerance interval in June and below that in August and September (Fig. 4). Forattini et al. (1981) encountered the same occurrences for Ps. ferox in March and in December, and referred to the existence of an incidence raise in June. Luz (1994) captured both species mainly in April. The disagreement between these two reports and the fact that these species correlation coefficient for climatic factors were not significant, does not allow for further consideration. Tr. digitatum, Tr. pallidiventer, Ru. reversa and Ru. frontosa, species with similar biological characteristics, presented similar monthly frequencies:
Mem Inst Oswaldo Cruz, Rio de Janeiro, Vol. 95(1), Jan./Feb. 2000
incidence below the minimum limit of the tolerance interval in June, followed by a rise in the number of specimens until it surpasses the maximum limit in October and September, for the Trichoprosopon, and in August for Runchomyia (Fig. 4). Guimarães and Arlé (1984) captured Tr. digitatum mainly in August. In the present study this preference was not observed. The great variety of natural breeding sites, that are available even in the colder and drier months, and the inexistence of a typically dry season in the studied area seem to favor the incidence of this species in this period from June to August. Comparing the monthly frequency of Ru. reversa and Ru. frontosa (Fig. 4) with the captures reported by Davis (1945) and Guimarães and Arlé (1984), every study shows the greatest incidences occurred through the colder and drier months. This tendency and the low incidences during the hot and rainy months, suggest that these species are specifically adapted to this periods of the year with more moderated temperatures. For Ru. reversa, statistical evaluation showed that the temperature variations, relative humidity and rainfall significantly influenced this species incidence throughout the year (Table V). Causey and Santos (1949) reported captures of the Wyeomyia species during the whole year, with significant decrease in the colder and drier season. The same was observed in our studies, with the exception of the absence of Wy. confusa in June and Wy. shannoni in May and June (Fig. 5). The Wy. confusa distribution in our studies is in accordance with Davis (1945). Forattini et al. (1968), Guimarães and Arlé (1984) and Guimarães et al. (1994b) reported that the distribution was concentrated mainly in months of greater rainfall and higher temperatures. For Wy. mystes Davis (1945) reported the existence of three annual peaks: February, May and October; Guimarães and Arlé (1984), only two peaks, in January and October; in our observations, this peak was restrict to August (Fig. 5). In the case of Wy. dyari, Wy. confusa and Wy. shannoni, representing one half of the studied Wyeomyia species studied, we found significant linear correlation coefficients between the population incidence and temperature variation (Fig. 6). If we consider the biological affinity existing among the Sabethini in a general way, previously highlighted for Trichoprosopon and Runchomyia, we may consider that, although significant linear correlation was not observed for the others, the temperature should have influenced the frequency of the Wyeomyia genus as a whole. The incidences of Wy. dyari, Wy. confusa and Wy. shannoni in January, which were all above the expected limits of
15
the tolerance intervals, may have been associated with temperature oscillation. Similarly, the decrease of these species as well as Wy. mystes and Wy. aporonoma in May, June and July might also have been related to this climatic variable (Fig. 5). For Wy. (Phoniomyia) in the Vale da Ribeira, Forattini et al. (1981) observed that they occurred every month and with three population peaks. In our study, similar distribution was found for Wy. splendida in January, March and November, Wy. longirostris in March, August and November, Wy. bonnei in January, April and November, Wy. flabelata in January, March and August and Wy. quasilongirostris in January and August (Fig. 5). The highest Wy. davisi incidences were in accordance with Lourenço-de-Oliveira (1984) who reported the capture of that species mainly in August and October. For Wy. theobaldi our observations were in accordance with Davis (1945) who stressed the occurrence in months of higher temperatures. Besides that, in our study few specimens were captured in July and August, the coldest and driest months (Fig. 5). Guimarães and Arlé (1984) captured this species throughout the year with a noticeable preference for February. Wy. theobaldi, Wy. palmata and Wy. davisi were captured with incidence peaks well above the expected maximum limit, although they had been the species with the widest tolerance intervals (Fig. 5). In Wy. theobaldi the linear correlation coefficient was significant for the temperature variations and rainfall (Table V). Wy. palmata and Wy. davisi were also captured in percentages that were above the tolerance interval maximum limit, especially the expressive occurrence in November for the first species. On the other hand, even though it should also be related to the local climatic factors, the low number of captured specimens diminishes the possibility of defining significant linear correlation coefficient (Fig. 5). The incidence of Li. flavisetosus, Li. durhami and Li. pseudomethisticus, in all months of capture, coincides with the observations of Guimarães and Arlé (1984) that referred to the genus as the most abundant and constant in PNSO. These three species occurred with similar incidence, but only Li. flavisetosus demonstrated significant correlation with temperature and rainfall (Table V). ACKNOWLEDGEMENTS To the Forest Institute of the State of São Paulo Environment Department, represented by the Director of Picinguaba Nucleus of the Serra do Mar State Park, for the logistic support to the accomplishments of the field works. To the colleagues Alessandro Sant’ana, Alexandre Jovita, Benjamin Rocha Neto, Karla Miranda, Márcia Garcia, Monique Motta and Roberto Machado for the collaboration in the field works.
16
Ecology of Mosquitoes - I Anthony Érico Guimarães et al.
REFERENCES Allonso MTA 1977. Vegetação. In C Goldenberg, Geografia do Brasil: Região Sudeste, Fundação Instituto Brasileiro de Geografia e Estatística, Rio de Janeiro, p. 91-118. Azevedo AL 1997. Aspectos da Epidemiologia da Malária e da Biologia de Anopheles (Kerteszia) cruzii Dyar & Knab em Vales Montanhosos do Sistema de Mata Atlântica, MSc Thesis, Instituto Oswaldo Cruz, Rio de Janeiro, 94 pp. Bates M 1949. The Natural History of Mosquitoes, The MacMillan Company, New York, 379 pp. Causey OR, Santos GV 1949. Diurnal mosquitoes in an area of small residual forests in Brazil. Ann Ent Soc Am 42: 471-482. Davis DE 1945. The annual cycle of plants, mosquitoes birds and mammals in two Brazilian forests. Ecological Monographs 15: 243-295. Forattini OP, Gomes AC, Galati EAB, Rabelo EX, Iversson LB 1978a. Estudos ecológicos sobre mosquitos Culicidae no Sistema Serra do Mar, Brasil. 1 Observações no ambiente extradomiciliar. Rev Saúde Pública 12: 297-325. Forattini OP, Gomes AC, Galati EAB, Rabelo EX, Iversson LB 1978b. Estudos ecológicos sobre mosquitos Culicidae no Sistema Serra do Mar, Brasil. 2 Observações no ambiente domiciliar. Rev Saúde Pública 12: 476-496. Forattini OP, Gomes AC, Santos JLF, Galati EAB, Rabelo EX, Natal D 1981. Observações sobre a atividade de mosquitos Culicidae, em mata residual do Vale da Ribeira, São Paulo, Brasil. Rev Saúde Pública 15: 557-586. Forattini OP, Kakitani I, Massad E, Marucci D 1993. Studies on mosquitos (Diptera: Culicidae) and anthropic and environment. 4 Survey of resting adult and synanthropic behaviour in Southeastern, Brazil. Rev Saúde Pública 27: 398-411. Forattini OP, Kakitani I, Massad E, Marucci D 1995a. Studies on mosquitoes (Diptera: Culicidae) and anthropic environment. 9 Synanthropy and epidemiological vector role of Aedes scapularis in Southeastern Brazil. Rev Saúde Pública 29: 199-207. Forattini OP, Kakitani I, Massad E, Marucci D 1995b. Studies on mosquitoes (Diptera: Culicidae) and anthropic environment. 10 Survey of adult behaviour of Culex nigripalpus and other species of Culex (Culex) in SouthEastern Brazil. Rev Saúde Pública 29: 271-278. Forattini OP, Lopes OS, Rabelo EX 1968. Investigações sobre o comportamento de formas adultas de mosquitos silvestres no Estado de São Paulo, Brasil. Rev Saúde Pública 2: 111-173. Galindo P, Trapido H, Carpenter SJ 1950. Observations on diurnal forest mosquitoes in relation to sylvian yellow fever in Panama. Am J Trop Med Hyg 30: 533-575. Guimarães AE, Aguiar GM, Mello RP, Ribeiro CL, Jesus EP 1994a. Ecologia de mosquitos no Parque
Nacional do Iguaçu, PR, Brasil. 1 Dinâmica populacional. In XX Congresso Brasileiro de Zoologia, UFRJ, Rio de Janeiro, p. 56. Guimarães AE, Arlé M 1984. Mosquitos no Parque Nacional da Serra dos Órgãos, Estado do Rio de Janeiro, Brasil. I Distribuição Estacional. Mem Inst Oswaldo Cruz 79: 309-323. Guimarães AE, Gentile C, Almeida JR 1994b. Ecologia de bioindicadores na Floresta Atlântica: I Influência dos fatores climáticos na dinâmica populacional de mosquitos (Diptera, Culicidae) da Serra dos Órgãos, Estado do Rio de Janeiro. Ann Brasil Ciências Ambientais 1: 332-344. Guimarães AE, Machado RNM, Neto B, Miranda KA 1991. Ecology of mosquitoes (Diptera-Culicidae) in the National Park of Serra da Bocaina and State Park of Serra do Mar, Rio de Janeiro and São Paulo, Brasil. I Seasonal Variation. In II Simposio Internacional de Zoologia, Ciudad la Habana, Cuba. Harbach RE, Kitching IJ 1998. Phylogeny and classification of the Culicidae (Diptera). Syst Entom 23: 327-370. Judd DD 1996. Review of the systematics and phylogenetic relationships of the Sabethini (Diptera: Culicidae). Syst Entom 21: 129-150. Judd DD 1998. Review a bromeliad-ovipositing lineage in Wyeomyia and the resurrection of Hystatomyia. Ent Soc Am 91: 572-589. Lopes CM 1996. Estudos Preliminares da Diversidade da Fauna de Mosquitos (Diptera-Culicidae) em Áreas da Reserva Biológica do Tinguá, Estado do Rio de Janeiro, Brasil, Monograph, Instituto Oswaldo Cruz, Rio de Janeiro, 32 pp. Lourenço-de-Oliveira R, Silva TF 1985. Alguns aspectos da ecologia dos mosquitos (Diptera: Culicidae) de uma área de planície (Granjas Calábria), em Jacarepaguá, Rio de Janeiro. III Preferência horária das fêmeas para o hematofagismo. Mem Inst Oswaldo Cruz 80: 195-202. Luz SLB 1994. Estudo sobre os Culicíneos (Diptera: Culicidae: Culicinae) Crepusculares e Noturnos, Vetores Potenciais de Patógenos de Importância Médica e Veterinária na Estação Ecológica de Samuel, Rondônia, MSc Thesis, Instituto Oswaldo Cruz, Rio de Janeiro, 96 pp. Nayar JK 1983. Bionomics and Physiology of Culex nigripalpus (Diptera-Culicidae) of Florida: An Important Vector of Diseases, Florida Medical Entomology Laboratory, Institute of Food and Agricultural Sciences, University of Florida, Vero Beach, 186 pp. Neves DP 1972. Alguns Aspectos da Ecologia dos Culicídeos no Parque das Mangabeiras, Belo Horizonte (MG), MSc Thesis, Universidade Federal de Minas Gerais, Minas Gerais, 75 pp. Nimer E 1979. Climatologia do Brasil, 4o Vol., Fundação Instituto Brasileiro de Geografia e Estatística, Rio de Janeiro, 556 pp.