Particulate Systems Analysis 2008, Stratford-upon-Avon, UK
Direct Calculation of the Volume Based Particle Size Distribution from PCS or PCCS Measurements 1
1
Helmut Geers , Wolfgang Witt 1
Sympatec GmbH, System Partikel Technik, Am Pulverhaus 1, 38678 Clausthal-Zellerfeld,
[email protected]
ABSTRACT Today Photon Cross Correlation Spectroscopy and Photon Correlation Spectroscopy (PCCS, PCS) is used on a routine basis to determine the particle size distribution of nano sized particles in liquids. Both methods estimate the particle size distribution from a measured correlation function. Ignoring the strong dependence between scattered light intensity and particle size the cumulants method standardised in ISO 13321 calculates only the mean particle size and the polydispersity index of the so-called intensity weighted particle size distribution. As a consequence this result can be compared with other particle sizing methods for very narrow distributions only. Other algorithms often calculate firstly the intensity weighted particle size distribution. In a second step this result is converted to a volume based result with help of the scattering cross sections calculated by Mie-theory. In order to solve the ill-conditioned system of equations the constraint that the particle size distribution is a smooth curve is used commonly. This constraint is only justifiable for the volume weighted particle size distribution with the result of numerical artefacts in the converted particle size distribution. The scattering cross sections calculated by Mie-theory can be included into a system of equations, that allows for the direct calculation of the volume based particle size distribution. The smoothness constraint is now valid and therefore numerical artefacts are avoided. However this system of equations is extremely ill-conditioned and therefore a challenge for the calculation algorithm. An iterative algorithm will be presented which is capable to calculate directly the volume based particle size distribution. It enables the direct comparison of PCS and PCCS results with other particle sizing methods. The results show good reproducibility and resolution even for multimodal particle size distributions.
Keywords: PCS, PSD calculation, volume based PSD, ill-conditioned
1
INTRODUCTION
Particle sizing by Photon Correlation Spectroscopy (PCS) is a commonly used method for characterising nano-sized particles in liquids. The strict concentration limitations of the classical set-up can be overcome by modern techniques like Photon Cross Correlation Spectroscopy (PCCS) (Aberle 1998). These techniques are often summarised under the name Dynamic Light Scattering (DLS). ISO 13321 standardises the cumulants method (Koppel 1972) for the calculation of the mean particle size and for the polydispersity index of the so called intensity weighted particle size distribution (PSD). ISO FDIS 22412 also mentions the calculation of a full particle size distribution from a linear system of equations. However, this is also restricted to the intensity weighted PSD. The intensity weighted PSD ignores the strong influence of particle size dependence on the amount of scattered light. Thus, the intensity weighted PSD cannot be compared directly with results from other particle sizing methods. Transforming the intensity weighted PSD QINT to a volume based PSD Q3 with help of Mie-theory often results in PSD influenced by numerical artefacts.
1
Particulate Systems Analysis 2005, Stratford-upon-Avon, UK Within this project the direct calculation of the volume based PSD from correlation functions measured by DLS was realised. The goal was to improve the comparability between PCS&PCCS results and other particle sizing methods like ultra centrifugation or TEM image analysis.
2
CLASSICAL PSD CALCULATION FOR DLS MEASUREMENTS
τ +) ti IB
N
ti IA
=
)( ⋅
( )( ⋅ +) τ ( ) ⋅( )
(1)
1 i
1 i
( ) ( ) ⋅∑ ∑ = =
=
t t IB IB t t IAIA
∑(
1N i
g2
() τ =
ti IB ti IA
N
1N1 2 N
With help of a PCS or PCCS device the scattered light intensity is measured with high temporal resolution, resulting in a time series of measured intensities of scattered light. The cross correlation function g2 of the scattered light intensities measured with two detectors A and B
is then calculated by a digital correlator. If only one detector is used, (1) results in the intensity autocorrelation function. The numerator in (1) is affected by the temporal correlation of the light scattered by the particles, whilst the denominator is proportional to the mean of the scattered light intensity. A link between the intensity correlation function and the PSD is given by m
(
)
g 2 (τ ) − 1 = g1 (τ ) ≈ ∑ IScat , j ( x j ) ⋅ ∆Q 0 ( x j ) ⋅ exp − Γ( x j ) ⋅ τ .
(2)
j=1
With: I t τ N kB x m
: scattered light intensity Θ : time n : lag time λ : number of samples T : Boltzmann Constant η : particle size ∆Q0 : number of elements in particle size vector
Abbreviations: Decay rate
: scattering angle : refractive index : wavelength : absolute temperature : dynamic viscosity : number related fraction of particles
r2 : Γ ( x ) = D( x ) ⋅ q
r 4π n θ : q = sin λ 2 k T : D( x ) = B 3πηx
Scattering vector Diffusion coefficient
The Brownian motion of the particles results in an exponential decay of the correlation function. The contribution of each particle size fraction is weighted by its scattering efficiency. ISO 13 321 recommends the methods of cumulants (Koppel 1972) for the evaluation. A series expansion of (2) serves for the moments of the intensity weighted PSD. For the sake of practicability st the series is truncated after the second term and the result is a mean particle size (1 moment) and a nd polydispersity index derived from the 2 moment of the intensity weighted PSD. ISO FDIS 22412 also mentions the calculation of a full PSD. Starting with a correlation function estimated for n different lag times, a linear system of equations is set up by rearranging (2):
g1 (τ 1 ) exp(−Γ( x1 ) ⋅ τ 1 ) ⋅ ⋅ ⋅ ≈ ⋅ g (τ ) exp(−Γ( x ) ⋅ τ ) 1 n 1 n
2
⋅
⋅
⋅ ⋅ ⋅
⋅
exp(−Γ( x m ) ⋅ τ 1 ) IScat ( x1 ) ⋅ ∆Q 0 ( x1 ) ⋅ ⋅ ⋅ ⋅ ⋅ exp(−Γ( x m ) ⋅ τ n ) IScat ( x m ) ⋅ ∆Q 0 ( x m )
(3)
Particulate Systems Analysis 2008, Stratford-upon-Avon, UK
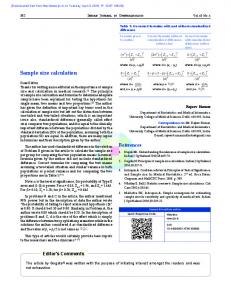
Within the PSD vector on the left hand side of (3) the fraction of particles in a certain size class ∆Q0(xi) is weighted by the scattering efficiency of particle size xi. Thus Eqn. (3) defines the so called intensity weighted PSD. The matrix in Eqn. (3) is ill-conditioned and must be inverted by special regularisation algorithms not standardized by ISO FDIS 22412. With help of a regularisation matrix the requirement that the PSD has to be a smooth curve, is added to the calculation procedure. The resulting smooth intensity weighted PSD must be converted in order to be compared directly with other particle sizing methods. By using the Mie-theory, the weighing factors to be applied can be calculated. 1.E+04
1.E+03
scattering efficiency / a.u.
1.E+02
1.E+01
1.E+00
1.E-01
1.E-02
1.E-03
1.E-04 10
100
1000
particle size / nm
fig. 1: weighing factors for the conversion qint to q0
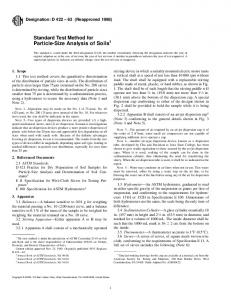
The steep increase of the weighing factors and the distinct minima of the curve shown in fig. 1 often leads to distortions of the conversion result (fig. 2). q3*
qINT*
fig. 2: a smooth qint PSD leads to a distorted q3-PSD
From this behaviour it becomes obvious, that the smoothness constraint is not justifiable for the qINT* distribution.
3
Particulate Systems Analysis 2005, Stratford-upon-Avon, UK
3
Direct calculation of Q3-distribution
Some simple algebraic transformations change the calculation result of (3) to a Q3-PSD:
g1 (τ 1 ) exp(−Γ( x 1 ) ⋅τ 1 ) ⋅ I Scat ( x1 ) x13 ⋅ ⋅ ⋅ ≈ ⋅ ⋅ I (x ) exp(−Γ( x1 ) ⋅τ n ) ⋅ Scat 3 1 g1 (τ n ) x1
⋅
⋅
⋅ ⋅ ⋅
⋅
I Scat ( x m ) ∆Q ( x ) 3 1 x 3m . ⋅ . ⋅ ⋅ . I (x ) exp(−Γ( x m ) ⋅τ n ) ⋅ Scat 3 m ∆Q ( x ) xm 3 m exp(−Γ( x m ) ⋅τ 1 ) ⋅
(4)
In eqn. (4) also included is the transformation of the number based PSD Q0 to the volume based distribution Q3. It has to be pointed out, that this new system of equations (4) is equal to (3) in a mathematical point of view as long as no regularisation is applied. Many physical mechanism are known, which influence the volume based PSD in a way, that the resulting PSD is a smooth curve. But there is no process known to influence directly the light scattering behaviour in a way, that the resulting intensity weighted PSD is a smooth curve. Only for this system of equations (4) the smoothness constrained is justifiable. Unfortunately the condition of the matrix becomes worse due to the high dynamic of the weighing factors and is a challenge for the inversion algorithm. For the inversion of the Q3-related matrix in (4) a new inversion algorithm has been developed. During the measurement a mean correlation function is calculated by a special method based on robust statistics (Huber 1981) and the statistical fluctuations of estimated correlation values are recorded, providing additional information for the estimation of the PSD. The reliable part of the measured mean correlation function is selected automatically at the end of the measurement. An iterative method is used for the inversion. Each interim result is calculated from a regularised matrix using the NNLS-algorithm (Lawson 1987). The measured correlations are weighted with respect to their statistical reliability. Thus an effective suppression of numerical artefacts is achieved. The new evaluation method has been tested using certified latices:
fig. 3: measurement results of repeated measurements on certified latices
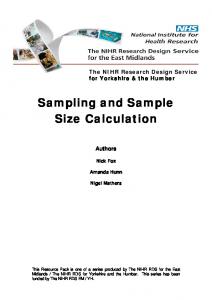
The calculated mean particle size agrees very well with the certified values. The measurement results are highly reproducible. The next example demonstrates (fig. 4a+b) the resolution ability of the new algorithm. A bimodal distribution was produced by mixing two single samples each giving the same scattered light intensity. Fig. 4a shows the q3-results of 10 repetitive measurements.
4
Particulate Systems Analysis 2008, Stratford-upon-Avon, UK 4.6
100
4.4
95
4.2
90
4.0
85
3.8
80
3.4
75
3.2
70
3.0
65
Cumulative distribution Qint / %
Density distribution q3*
3.6
2.8 2.6 2.4 2.2 2.0 1.8 1.6 1.4
60 55 50 45 40 35 30
1.2
25
1.0
20
0.8
15
0.6
10
0.4
5
0.2 0.0 0.5
1.0
5
10
50
100 X / nm
500
1000
5000
fig. 4a: q3*-results of repeated measurements on a bimodal mixture
10000
0 0.5
1.0
5
10
50
100 X / nm
500
1000
5000
10000
fig. 4b: QINT results of repeated measurements on a bimodal mixture
In order to check the mixing ratio of the two fractions, the QINT-PSD was calculated from the Q3results. Fig. 4b demonstrates that the mixing ratio of the two samples is reproduced quite good.
Conclusions Following ISO 13321 the result of a DLS measurements is an intensity weighted PSD. This kind of PSD can not be compared directly with other particle sizing methods. A conversion to number or volume based distribution often results in numerical artefacts. The reason can be found in the distinct minima an the steep increase of curve weighing factors vs. particle size (fig. 1) leading to a distortion of the conversion result. The commonly used smoothness constrained for the regularisation is not justifiable for intensity weighted PSD. A simple algebraic conversion of the calculation matrix makes the direct calculation of a volume based PSD possible. However the converted matrix is badly conditioned and therefore a challenge for the inversion algorithm. Within this project a new inversion algorithm has been developed. It directly calculates a volume based PSD from measured correlation functions. It combines in an iterative procedure robust statistics, smoothing regularisation with the well known NNLS algorithm. As a result very stable and reproducible PSD-results with a high resolution are obtained. The results can be compared directly with other particle sizing methods like TEM or ultra centrifuge.
3
REFERENCES
ABERLE, L. B. WIEGAND, S. SCHRÖER, W. and STAUDE, W.,(1998), Effective Suppression of Multiply Scattered Light in Static and Dynamic Light Scattering, Applied Optics 37, pp. 6511- 6524.
HUBER, P.J., (1981) Robust Statistics, John Wiley and Sons, New York.
KOPPEL, D., (1972), Analysis of macromolecular polydispersity in intensity correlation spectroscopy: The method of cumulants, J. Chem. Phys., 57, pp. 4814-4820.
LAWSON + HANSON, (1987), Solving Least Square Problems, Society for Industrial Mathematics, ISBN: 0898713560.
5