The Astrophysical Journal Letters, 856:L35 (6pp), 2018 April 1
https://doi.org/10.3847/2041-8213/aab894
© 2018. The American Astronomical Society.
Direct Evidence for Maser Emission from the 36.2 GHz Class I Transition of Methanol in NGC253 Xi Chen1,2,4 1
2
, Simon P. Ellingsen3
, Zhi-Qiang Shen2,4, Tiege P McCarthy3
, Wei-Ye Zhong2,4, and Hui Deng1
Center for Astrophysics, GuangZhou University, Guangzhou 510006, Peopleʼs Republic of China;
[email protected] Shanghai Astronomical Observatory, Chinese Academy of Sciences, Shanghai 200030, Peopleʼs Republic of China;
[email protected] 3 School of Natural Sciences, University of Tasmania, Hobart TAS 7001, Australia 4 Key Laboratory of Radio Astronomy, Chinese Academy of Sciences, Nanjing, JiangSu 210008, Peopleʼs Republic of China Received 2018 February 11; revised 2018 March 19; accepted 2018 March 19; published 2018 April 2
Abstract Observations made with the Jansky Very large Array (JVLA) at an angular resolution of ∼0 1 have detected class I methanol maser emission from the 36.2 GHz transition toward the starburst galaxy NGC 253. The methanol emission is detected toward four sites which lie within the regions of extended methanol emission detected in previous lower angular resolution (a few arcseconds) observations. The peak flux densities of the detected compact components are in the range 3–9 mJy beam−1. Combining the JVLA data with single-dish observations from the Shanghai Tianma Radio Telescope (TMRT) and previous interferometric observations with the Australia Telescope Compact Array (ATCA), we show that the 36.2 GHz class I methanol emission consists of both extended and compact structures, with typical scales of ∼6″ (0.1 kpc) and ∼0 05 (1 pc), respectively. The strongest components have a brightness temperature of >103 K, much higher than the maximum kinetic temperature (∼100 K) of the thermal methanol emission from NGC 253. Therefore, these observations conclusively demonstrate for the first time the presence of maser emission from a classI methanol transition in an external galaxy. Key words: galaxies: starburst – ISM: molecules – masers – stars: formation has been no direct evidence as to whether or not the detected 36.2 GHz methanol emission represents maser emission. NGC 253 is one of the closest galaxies with a nuclear starburst at a distance of 3.4 Mpc (Dalcanton et al. 2009). It shows significant 36.2 GHz methanol emission (Ellingsen et al. 2014), along with molecular emission from a wide range of species (e.g., Martín et al. 2006; Lebrón et al. 2011; Meier et al. 2015; Walter et al. 2017). The proximity of NGC 253 makes it the best testbed for studying the relationship between the 36.2 GHz methanol emission and the nuclear starburst with a high angular resolution and sensitivity. Recently, follow-up observations of the 36.2 GHz methanol in NGC 253 were undertaken using the ATCA in the EW367 and 1.5A array configurations (Ellingsen et al. 2017a). Combining the earlier ATCA H168 array data with the new higher-resolution data reveals that at an angular resolution of ∼1″, there are seven 36.2 GHz methanol emission sites in the central region of NGC 253 (labeled MM1–MM7; see Ellingsen et al. 2017a). Recent Jansky Very Large Array (JVLA) observations with a similar angular resolution and sensitivity confirm the ATCA findings (Gorski et al. 2017). At the angular resolution of the combined ATCA array data, the lower limit on the brightness temperature of the 36.2 GHz methanol emission of the brightest components is only a few K (or 220 K km s−1) from the peak flux density (or the integrated intensity; Ellingsen et al. 2017a). These values are in the range of the rotational and kinetic temperatures observed for molecular emission under thermal conditions in the central region of NGC253 (e.g., Martín et al. 2006; Meier et al. 2015). Hence, they do not in themselves imply maser emission. Obviously, higher-resolution observations of the methanol emission in NGC 253 are required to clarify whether or not extragalactic 36.2 GHz class I methanol masers exist. In this Letter, we report the first direct observational evidence for the
1. Introduction Methanol masers are very common in star-forming regions within our Galaxy. More than 1000 sources have been found to show methanol maser emission from either class I or class II transitions, or both (e.g., Green et al. 2009; Chen et al. 2014; Yang et al. 2017). Mild shocks driven into molecular clouds by outflows or expanding H II regions can excite the class I methanol masers, which are collisionally pumped (e.g., Voronkov et al. 2010; Chen et al. 2011), while infrared radiation from young high-mass stars pumps the class II masers (e.g., Ellingsen 2006; Caswell et al. 2010). In contrast to the widespread methanol masers in our Galaxy, to date extragalactic methanol maser emission from the most common class II transitions at 6.7 or 12.2 GHz has only been detected toward star formation regions in two local-group galaxies, the Large Magellanic Cloud (LMC) and M31 (Green et al. 2008; Ellingsen et al. 2010; Sjouwerman et al. 2010). And it is only recently that a search for 41–30 E (36.2 GHz) class I methanol masers toward a sample of nearby galaxies, using the Australia Telescope Compact Array (ATCA), has produced the first detections of this transition toward NGC253 (Ellingsen et al. 2014), NGC 4945 (McCarthy et al. 2017), and tentatively also toward Arp220 (Chen et al. 2015). For these three galaxies, comparison of the 36.2 GHz methanol emission with that seen in other methanol transitions and with the 36.2 GHz masers in Galactic sources suggests that the detected emission from this transition is likely a maser (see Ellingsen et al. 2014; Chen et al. 2015; McCarthy et al. 2017). However, to date there Original content from this work may be used under the terms of the Creative Commons Attribution 3.0 licence. Any further distribution of this work must maintain attribution to the author(s) and the title of the work, journal citation and DOI.
1
The Astrophysical Journal Letters, 856:L35 (6pp), 2018 April 1
Chen et al.
existence of the class I methanol masers in NGC253 using the JVLA A-array observations at an angular resolution of ∼0 1.
every 2 hr and the pointing accuracy is estimated to be better than 5″. The system temperature was in the range 70–100 K. We utilized the active surface system to correct for the effects of gravitational deformation during the observations (Dong et al. 2016). This yielded an average aperture efficiency of approximately 50%, giving a conversion factor of 1.6 Jy K−1. The data reduction was undertaken with the GILDAS/CLASS package. The spectrum was binned and smoothed to a velocity resolution of ∼8 km s−1. The rms noise level in the final TMRT spectra is about 3 mJy.
2. Observations To investigate the most compact components of the 36.2 GHz methanol emission toward NGC 253, we made JVLA observations in the A-array configuration on 2015 August 13. Two 1-GHz widebands (8-bit samplers) with the frequencies centered around 36.1 and 37.1 GHz were adopted. Eight 128 MHz dual polarization subbands were included in each band, each with 128 channels and a width of 1 MHz (corresponding to a channel separation of 8.3 km s−1). One subband was centered at 36.14 GHz covering the 41–30 E (36.2 GHz) methanol transition. The time-dependent antenna gains were calibrated by frequent observations of the quasar J0025–2602. The bandpass response was calibrated with the standard calibrator quasar J2253+1608 (3C454.3) and an observation of 3C48 was used to obtain absolute flux density calibration. The pointing center for NGC 253 was the same as our previous ATCA observations (see Ellingsen et al. 2014, 2017a). The on-source integration time for NGC 253 was approximately one hour. The visibility data were calibrated using the standard Very Large Array (VLA) Calibration Pipeline with the Common Astronomy Software Applications (CASA) package. The imaging and analysis were carried out in MIRIAD. The resulting synthesized beam size was 0 16×0 07, with a position angle of −28°. Self-calibration of the data using the central continuum emission from NGC 253 was performed prior to continuum subtraction. In order to compare the methanol emission at different angular resolutions, we combined the current JVLA A-array observations with the previously published ATCA observations (see Ellingsen et al. 2014, 2017a). The observations were made using the ATCA on 2014 March 29 with the H168 array configuration, on 2014 October 10 and 11 with the EW367 array configuration, and on 2014 November 27 and 28 with the 1.5A array configuration (project code C2879). The synthesized beam width at 36 GHz was approximately 8 0×4 2, 16 6×3 1, and 3 5×0 8 for the H168, EW367, and 1.5A array configurations, respectively. Because the channel resolutions are different for the three ATCA configuration observations and the JVLA A-array observations, we resampled the ATCA data of Ellingsen et al. (2014, 2017a) to the same channel separation (i.e., 8.3 km s−1) as the JVLA observations. Using the Shanghai 65 m Tianma Radio Telescope (TMRT), we obtained a single-dish spectrum of the 36.2 GHz methanol toward NGC 253. The TMRT observations were made on 2017 December 18–20 with a Q-band dual-beam receiver covering the frequency range 35–50 GHz (see Zhong et al. 2018). We use one spectrometer with a bandwidth of 500MHz and a channel separation of 31 kHz (corresponding to ∼0.25 km s−1) for each beam. Two positions were observed, centered on the strongest 36.2 GHz methanol emission northeast (α= 00h47m33 65 and δ=−25°17′13 2 (J2000), i.e., the MM4 position given by Ellingsen et al. (2017a), and southwest (α=00h47m31 93 and δ=−25°17′29 1 (J2000), i.e., the MM1 position given by Ellingsen et al. 2017a) of the center of NGC 253. The observations were made in a switching mode, nodding between the two beams with a switching time of 1 minute. The total effective on-source integration time was about 8 hr for each of the target positions (obtained from the sum of the two beams). The antenna pointing was checked
3. Results 3.1. JVLA Observations Both the 36.2 GHz methanol transition and continuum emission toward NGC 253 were detected from our JVLA A-array observations. Figure 1 shows the overall distribution of the detected methanol and continuum emission. The continuum emission obtained from line-free channels of the 128 MHz subband covering the methanol transition shows multiple (more than 10) locations above 10σrms distributed along a line of length 9″ roughly projected southwest to northeast around the dynamical center of NGC 253. The peak flux density of the brightest continuum component is 18.1 mJy beam−1. Methanol emission was detected toward four locations, labeled as components A–D. These are all significantly offset from the center of the galaxy and continuum emission. The integrated intensity maps for each component are shown in Figure 1, and the velocity ranges over which emission has been integrated are given in Table 1. The corresponding spectrum at the peak position of each component is presented in the right panel of Figure 2. The parameters of the four methanol components, including position, velocity range, and flux density, are summarized in Table 1. All four methanol components have a compact structure, comparable to the JVLA’s synthesized beam size and shape, suggesting that these detected components are still unresolved at an angular resolution of ∼0 1. The peak flux densities of the four components are in the range 3.3–9.2 mJy, with the strongest emission from component B. If we assume that all of the detected methanol emission originates from a region with an angular size less than 0 1 (corresponding to the beam size of the JVLA A-array observations), then we can put a lower limit on the brightness temperature of the four components in the range of 440–1200 K considering only their peak flux density, and 1.2×10⁴–2.8×10⁴ K km s−1 when integrated over the velocity range (see Table 1). These values are significantly higher than the reported range of kinetic temperatures (∼100 K for the warmer gas; e.g., Gorski et al. 2017) observed for molecular emission in NGC 253, demonstrating that the detected compact methanol emission is masing, and not of thermal origin. 3.2. TMRT Observations Significant methanol emission (>10σ) was detected in the TMRT observations toward the two target positions, northeast and southwest of the center of NGC 253 (see Section 2). The spectra are presented in the top-right corner of the left panel of Figure 2. The methanol detected from the northeast position shows emission over the barycentric velocity range 140–260 km s−1, while that from the southwest position shows emission over the velocity range 270–370 km s−1. The velocity range of the emission from each targeted position covered by 2
The Astrophysical Journal Letters, 856:L35 (6pp), 2018 April 1
Chen et al.
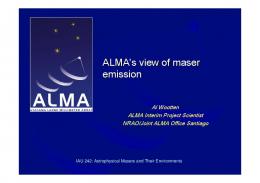
Figure 1. Continuum and integrated methanol emission toward NGC 253 from JVLA A-array observations. The center-left panel displays the 36 GHz continuum emission (black contours), and the integrated methanol emission from the 36.2 GHz transition for the four compact components (blue contours for components A and B; red contours for components C and D; see Section 3.1). The contour levels in the continuum image are at 5, 10, 20, 40, 80, and 160 times the rms in the image (0.1 mJy beam−1). The contour levels in the integrated methanol image are at 3, 4, 5, 6, 7, 8, and 9 times the rms in the image (20 mJy beam−1 km s−1). The zoomedin views of the continuum emission and integrated methanol emission for the four methanol components are displayed in the center-right panel, upper two panels, and lower two panels, respectively. The synthesized beam of the JVLA A-array observations (0 16×0 07 with a position angle of −28°) is shown in the bottom-right corner of each panel.
the TMRT is in a good agreement with that previously detected in ATCA observations (see Ellingsen et al. 2017a) toward the northeast region, MM4–MM6 (140–254 km s−1), and the southwest region, MM1-MM3 (272–362 km s−1). The components MM4–MM6 in the northeast and MM1-MM3 in the southwest have spatial distributions covering less than 8″, smaller than the beam size of the TMRT. Therefore, the TMRT observations are likely to cover all emission of the 36.2 GHz methanol components toward NGC253 using the two targeted positions. We marked the velocity of the four compact
components that were detected in the current JVLA observations in the TMRT methanol spectra in Figure 2. They each correspond to peaks in the TMRT methanol spectra, suggesting that the single-dish spectra contain significant contributions from these four components and their surroundings. 4. Discussion The four compact class I methanol masers detected in the JVLA observations are distributed northeast and southwest of the center of NGC 253. It can clearly be seen that the four 3
The Astrophysical Journal Letters, 856:L35 (6pp), 2018 April 1
Chen et al.
Table 1 Summary of the Four 36.2 GHz Methanol Maser Components in NGC253 from the JVLA Observations
(1)
α (J2000) (2)
δ (J2000) (3)
Offset (arcsec) (4)
vBar (km s−1) (5)
vRange (km s−1) (6)
P (mJy beam−1) (7)
S (mJy km s−1) (8)
A B C D
00:47:33.915 00:47:33.675 00:47:31.953 00:47:31.946
−25:17:10.47 −25:17:13.55 −25:17:28.15 −25:17:30.10
+11.05, +7.53 +7.80, +4.45 −15.55, −10.15 −16.65, −12.10
215 202 346 306
188–232 182–224 330–360 294–346
3.3 9.2 5.4 4.4
91.2 208.1 88.8 119.6
Label
Ellingsen et al. Label (arcsec) (9) MM6 MM4 MM2 MM1
(0.55) (0.48) (0.95) (1.02)
Note. Column (1): label for the compact methanol components detected by our JVLA observations; Columns (2)–(4): the location of each methanol component in right ascension (R.A.) and declination (decl.), and its relative R.A., decl. offset from the pointing center (α=00h47m33 1 and δ=−25°17′18″; J2000) of the JVLA observations; Columns (5)–(8): the barycentric peak velocity vBar, the velocity range vRange, the peak flux density P, and the velocity integrated intensity S of each methanol component. Column (9): the corresponding methanol components detected with the ATCA by Ellingsen et al. (2017a); the values in parentheses are the offsets of the compact maser locations from the positions given by Ellingsen et al. (2017a).
Figure 2. Comparison of the ATCA 1.5A array, JVLA A-array, and TMRT observations of the 36.2 GHz methanol emission in NGC 253. The left panel shows the integrated methanol emission (black contours) detected by the ATCA in the 1.5A array; the contour levels start at 3σ and have increments of 3σ(1σ=25 mJy beam−1 km s−1). Red stars denote the peak positions of the four compact methanol components detected by the JVLA A-array observations. The two methanol spectra detected by the TMRT are presented in the top-right corner. The right panel shows the corresponding methanol spectra of the four components at the peak positions detected by the JVLA.
compact methanol components are all located within the regions of extended emission detected in previous ATCA observations. The left-hand panel of Figure 2 shows an example using the ATCA 1.5A configuration data (see Ellingsen et al. 2017a). Comparing the spatial locations and velocity ranges of the components detected with the JVLA and ATCA, the components A, B, C, and D are well matched to the components MM6, MM4, MM2, and MM1 detected by the ATCA (see Ellingsen et al. 2017a) within 0 5–1″, respectively. The spatial separations of the components detected by the JVLA and ATCA are reasonable, because the ATCA observations have a lower angular resolution of 0 9×3 4 and contain emission from both compact and more extended methanol emission, which may result in differences in the
measured locations on scales comparable to the synthesized beam. Toward the component D region, the detection of a J=4−3 HC3N (36.4 GHz) maser has also been reported (Ellingsen et al. 2017b). To investigate the spatial structure of the 36.2 GHz extragalactic class I methanol masers, we have used the NGC 253 data obtained from the single-dish TMRT observations and the interferometric observations with the ATCA and JVLA over a range of angular resolutions. We extracted the methanol spectra for the four components from these data sets at the peak locations deduced from the JVLA observations. The spectra from the five different resolution data sets are shown overlaid in the left-hand panel of Figure 3. The change in peak flux density of the four components as a function of the inverse 4
The Astrophysical Journal Letters, 856:L35 (6pp), 2018 April 1
Chen et al.
Figure 3. Spectra and peak flux densities of the 36.2 GHz methanol emission of four components detected in the ATCA, JVLA, and TMRT observations. Left panel: the spectra of the four components at five different angular resolutions. These are TMRT (magenta), ATCA H168 array (black), ATCA EW367 array (red), ATCA 1.5A array (blue), and JVLA A-Array (green). Middle panel: the change in the peak flux density as a function of the inverse of the beam size. The red and blue solid lines represent the half-Gaussian profiles of the extended and compact components. For components A and C, the angular scales of the extended and compact components are 6 6 and 0 05, respectively; for components B and D, the angular scales of the extended and compact components are 5″ and 0 05, respectively. A zoomed-in version of the red profile for the extended components is shown in the right panel.
of the beam size is presented in the middle and right-hand panels of Figure 3. The beam size is taken to be the geometric mean of the major and minor axes of the synthesized beam. We can see that the flux density of the methanol emission rapidly decreases as the angular scale decreases from a few arcseconds to 2 arcsec (i.e., 1/beamsize 0.5 arcsec−1). This indicates that the detected methanol emission has contributions from both extended and compact regions. We used a half-Gaussian profile consisting of both extended and compact components to model the observed distribution of the peak flux density versus the inverse of the beam size for each component. For components A and C, Gaussian profiles using angular scales of 6 6 and 0 05 for the extended and compact components are consistent with the observations, while for components B and D angular scales of 5″ and 0 05 provide the best match. The Gaussian profiles of the extended (red curve) and compact (blue curve) components are also plotted over the distributions in the middle and righthand panel of Figure 3. The right-hand panel gives a zoomed-in view to better show the Gaussian profile of the extended component. If we assume an angular scale of 0 05 for the most compact 36.2 GHz methanol emission, the derived lower limit on the
brightness temperature for the four components covers the range 1800–5000 K from the peak flux density. When integrated over the observed velocity range (see Table 1), the brightness temperature range is 0.5×10⁵–1.1×10⁵ K km s−1. Therefore, considering both the JVLA observations alone and modeling the emission with extended and compact components, we reach the same conclusion: that the compact emission is masing. For the extended emission with a scale size of ∼6″, the derived brightness temperature is ∼30 K km s−1 when integrated over the velocity range from the TMRT spectrum. Although this extended emission has a low brightness temperature, it appears that the extended emission components are likely predominantly due to low-gain masers, perhaps amplifying weak background emission from star formation. In conclusion, the extragalactic 36.2 GHz class I methanol maser emission likely has a core-halo structure, where the maser brightness distribution has contributions from the superposition of two Gaussian components, a compact (∼50 mas) and saturated core that is detected by the JVLA observations (Tb>∼103 K), and an extended (a few arcseconds) and unsaturated halo that is resolved by the JVLA observations. For NGC 253 at a distance of 3.4 Mpc, the projected linear scales of the extended and compact methanol emission are ∼100 pc and ∼1 pc, respectively. However, in general we would expect the spatial dimensions of extragalactic 36.2 GHz methanol masers will depend on the local physical environment 5
The Astrophysical Journal Letters, 856:L35 (6pp), 2018 April 1
Chen et al.
within the host galaxy. For Arp 220, Chen et al. (2015) likely detected extended 36.2 GHz methanol maser emission with an angular size of ∼10″, corresponding to a projected linear size of ∼4 kpc at a distance of 77.6 Mpc. The extended 36.2 GHz methanol emission in Arp 220 may be the result of the superposition of many smaller extended components with a physical scale (0.1 kpc) similar to that in NGC 253. Optical Hα emission shows that the active region of Arp 220 extends ∼20″ (∼10 kpc) from the center (Taniguchi et al. 2012), which allows for a much larger volume to acquire the physical conditions to host low-gain methanol maser emission.
Xi Chen https://orcid.org/0000-0002-5435-925X Simon P. Ellingsen https://orcid.org/0000-0002-1363-5457 Tiege P McCarthy https://orcid.org/0000-0001-9525-7981
5. Summary
References
Chinese Academy of Sciences (CAS; grant No. XDA04060701), Key Laboratory for Radio Astronomy, CAS; Guangdong innovation Group for Astrophysics (2014KCXTD014), and support for Key Subjects (Astrophysics) of Guangdong Province and Guangzhou City. ORCID iDs
JVLA observations with an angular resolution of ∼0 1 reveal the presence of compact 36.2 GHz class I methanol maser emission with a characteristic spatial scale of 1pc toward four sites near the edges of the central molecular zone of NGC 253. Comparing the JVLA data with observational results at lower angular resolutions from single-dish (TMRT) and previous interferometric (ATCA) observations, we find that in NGC 253 the 36.2 GHz class I methanol maser consists of both an extended (∼6″ or 0.1 kpc) and compact (∼0 05 or 1 pc) component with characteristic brightness temperatures of ∼30 K and ∼103 K, respectively. The latter provides the first direct evidence for the existence of extragalactic class I methanol maser emission. Considering the detection of extended methanol maser emission from NCG 253 and (likely) Arp220, it appears that relatively low angular resolutions (a few arcseconds), such as obtained from the ATCA H168 array, or JVLA D-array, may be the most sensitive observing mode for future searches for classI methanol masers in other extragalactic sources.
Caswell, J. L., Fuller, G. A., Green, J. A., et al. 2010, MNRAS, 404, 1029 Chen, X., Ellingsen, S. P., Gan, C. G., et al. 2014, ChSBu, 59, 1066 Chen, X., Ellingsen, S. P., Qiao, H. Q., et al. 2015, ApJL, 800, 2 Chen, X., Ellingsen, S. P., Shen, Z. Q., et al. 2011, ApJS, 196, 9 Dalcanton, J. J., Williams, B. F., Seth, A. C., et al. 2009, ApJS, 183, 67 Dong, J., Jin, H.-L., Ye, Q., et al. 2016, Proc. SPIE, 9913, 06 Ellingsen, S. P. 2006, ApJ, 638, 241 Ellingsen, S. P., Breen, S. L., Caswell, J. L., Quinn, L. J., & Fuller, G. A. 2010, MNRAS, 404, 779 Ellingsen, S. P., Chen, X., Breen, S. L., & Qiao, H.-H. 2017a, MNRAS, 472, 604 Ellingsen, S. P., Chen, X., Breen, S. L., & Qiao, H.-H. 2017b, ApJL, 841, 14 Ellingsen, S. P., Chen, X., Qiao, H. Q., et al. 2014, ApJL, 790, 28 Gorski, M., Ott, J., Rand, R., et al. 2017, ApJ, 842, 124 Green, J. A., Caswell, J. L., Fuller, G. A., et al. 2008, MNRAS, 385, 948 Green, J. A., Caswell, J. L., Fuller, G. A., et al. 2009, MNRAS, 392, 783 Lebrón, M., Mangum, J. G., Mauersberger, R., et al. 2011, A&A, 534, 56 Martín, S., Mauersberger, R., Martín-Pintado, J., Henkel, C., & García-Burillo, S. 2006, ApJS, 164, 450 McCarthy, T. P., Ellingsen, S. P., Chen, X., et al. 2017, ApJ, 846, 156 Meier, D. S., Walter, F., Bolatto, A. D., et al. 2015, ApJ, 801, 63 Sjouwerman, L. O., Murray, C. E., Pihlström, Y. M., Fish, V. L., & Araya, E. D. 2010, ApJ, 724, L158 Taniguchi, Y., Matsubayashi, K., Kajisawa, M., et al. 2012, ApJ, 753, 78 Voronkov, M. A., Caswell, J. L., Ellingsen, S. P., & Sobolev, A. M. 2010, MNRAS, 405, 2471 Walter, F., Bolatto, A. D., Leroy, A. K., et al. 2017, ApJ, 835, 265 Yang, W.-J., Xu, Y., Chen, X., et al. 2017, ApJS, 231, 20 Zhong, W.-Y., Dong, J., Gou, W., et al. 2018, RAA, 18, 44
We thank the anonymous referee for helpful comments that improved the manuscript. This work was supported by the National Natural Science Foundation of China (11590781, 11590784); the Strategic Priority Research Program of the
6