Mar 20, 1978 - J. Schlessinger, Y. Shechter, P. Cuatrecasas,and I. Pastan, unpublished data. 2659. The costs of publication of this article were defrayed in part ...
Proc. Nati. Acad. Sci. USA Vol. 75, No. 6, pp. 2659-2663, June 1978
Biochemistry
Direct visualization of binding, aggregation, and internalization of insulin and epidermal growth factor on living fibroblastic cells (hormone receptors/fluorescent hormones/lateral diffusion/patching/endocytosis)
JOSEPH SCHLESSINGER*, YORAM SHECHTERt, MARK C.
WILLINGHAMt, AND IRA PASTANt
* Immunology Branch and * Laboratory of Molecular Biology, National Cancer Institute, National Institutes of Health, Bethesda, Maryland 20014; * Department of Applied Physics, Cornell University, Ithaca, New York 14853; and t Burroughs Wellcome Co., Research Triangle Park, North Carolina 27709
Communicated by Gordon C. Hammes, March 20,1978
We have studied in detail the binding of fluoABSTRACT rescent derivatives of insulin and epidermal gowth factor to 3T3 fibroblasts. We have used two types of fluorescent analogues of insulin and epidermal growth factor: highly fluorescent derivatives which have seven to eight rhodamine molecules or fluorescent derivatives which have a single rhodamine molecule per one molecule of insulin or epidermal growth factor. Both types of analogue retained substantial binding affinity as determined by radioreceptor assays and biological activity. The cells labeled with the fluorescent analogues were visualized with a sensitive video intensification microscopic system that enabled us to directly observe the location of the fluorescent hormone on the surface and within the living fibroblasts. We found that both insulin and epidermal growth factor initially bound diffusely to the cell surface and, at 40, remained dispersed. Within a few minutes at 230 or 370 the hormone-receptor complexes aggregated into patches that could be readily removed by trypsin but not by excess native hormone. The hormone-receptor complexes, which were initially mobile in the plane of the membrane, become immobilized later as the consequence of the receptor aggregation or internalization. Within "30 min at 370, much of the labeled hormone was found within the cell in endocytic vesicles that moved about in the cytoplasm in a saltatory manner. The aggregation and immobilization of the hormone-receptor complexes could be due to either hormone-hormone interactions on the cell membrane or a hormone-induced conformational change in the hormone-receptor complex. Aggregation and internalization of hormone-receptor complexes could be associated with certain aspects of hormone action, hormone degradation, down regulation of receptors, or negative cooperativity of hormone binding.
The first step in the action of polypeptide hormones is binding to a specific receptor site on the plasma membrane of the cell (1, 2). For insulin, this binding is rapid and saturable. Epidermal growth factor (EGF), which is a small polypeptide hormone that exhibits growth-stimulating activity in vivo and in vitro (3-5), also binds to cell membrane receptors in a specific and saturable manner (6). We have been particularly interested in studying the binding of hormones to cultured fibroblastic cells, in which this process can be studied in detail. Both insulin and EGF bind to target cells and at 370 appear to enter such cells, where the hormones are ultimately degraded (2, 6). In order to study the binding, lateral motion,§ and putative internalization of sinulin and EGF on cells we have developed two types of fluorescently labeled analogue. The first type is highly fluorescent; both insulin and EGF have seven to eight rhodamine molecules per molecule of hormone. Insulin was coupled at lysine B-29 with a-lactalbumin that was initially labeled with seven to eight rhodamine molecules (R-lact-in-
sulin). Similarly, the a-amino group of EGF was coupled with the same rhodamine-labeled lactalbumin to form R-lact-EGF. The other type of fluorescent derivative of insulin and EGF has a single rhodamine group per molecule (7). Insulin was coupled at lysine B-29 with one rhodamine molecule (R-insulin), and EGF was similarly coupled at the a-amino group with a single rhodamine molecule (R-EGF). Both types of analogue retain considerable binding affinity, as determined by radioreceptor assays (7),§ and biological activity (7). Full details of the synthesis, purification, and biological activity of the derivatives are reported elsewhere (7). We have previously used these derivatives for studying the mobility of EGF-receptor complexes or insulin-receptor complexes on 3T3 fibroblasts. We found that shortly after the cells were exposed to the fluorescent hormones at 23°, most hormone-receptor complexes were mobile, with a diffusion coefficient D - 3-5 X 10⁻¹ cm2/sec. When the temperature was raised to 370, the hormone-receptor complexes became immobile. § In this paper we describe the distribution of these hormone derivatives on 3T3 fibroblasts. The fluorescent derivatives were localized by fluorescence microscopy with a sensitive imageintensified video camera (8). This camera can detect extremely low levels of light so that fluorescent molecules can be visualized without bleaching of the fluorophore or damage to cellular organelles. Our data show that the hormone-receptor complexes are initially homogeneously distributed on the cell surface, but at 230 or 370 they rapidly aggregate into patches on the cell membrane. The fluorescent patches soon internalize and the labeled hormones appear in endocytic vesicles within the cell. The internalization step is sensitive to temperature and requires metabolic energy. MATERIALS AND METHODS Reagents. Pork insulin was a product of Eli Lilly. EGF was purified from male mouse submaxillary glands by the procedure of Savage and Cohen (9). R-Lact-EGF was prepared by coupling R-lact to the a-amino group of EGF. R-lact-insulin was prepared by coupling R-lact to the lysine B-29 of insulin. In R-EGF, the a-amino group was coupled to a single rhodamine molecule; in R-insulin, lysine B-29 was labeled with a single rhodamine molecule. Full details about the synthesis, Abbreviations: EGF, epidermal growth factor; R-lact, a-lactalbumin labeled with seven to eight rhodamine molecules; R-insulin, insulin labeled with rhodamine at lysine B-29; R-lact-insulin, insulin labeled at lysine B-29 with a-lactalbumin which is labeled with seven to eight rhodamine molecules; R-EGF, EGF labeled with rhodamine at the a amino group; R-lact-EGF, EGF labeled at the a-amino group with a-lactalbumin which is labeled with seven to eight rhodamine molecules. § J. Schlessinger, Y. Shechter, P. Cuatrecasas, and I. Pastan, unpublished data.
The costs of publication of this article were defrayed in part by the payment of page charges. This article must therefore be hereby marked "advertisement" in accordance with 18 U.S.C. §1734 solely to indicate this fact. 2659
2660
Biochemistry: Schlessinger et al.
purification, and activity of all the hormone derivatives are reported elsewhere (7). Cells. The cells studied were BALB 3T3 clone C/3 and Swiss 3T3. All studies were performed on stationary confluent cells, which have more receptor sites for insulin and EGF than growing cells (10, 11). The cells were planted at 105 cells per dish in 2 ml of Dulbecco-Vogt's modified Eagle's medium with 10% fetal calf serum in 35-mm plastic tissue culture dishes under 95% air/5% CO2 humidified atmosphere at 370. The cells were fed after 24 hr and used after 96 hr. To obtain maximal fluorescence from specific labeling over background fluorescence, we used a high enough concentration of fluorescent hormone to occupy most of the receptor sites on the cells (2, 10). Prior to labeling, the cells were washed twice with 2 ml of medium with 1% calf serum and then the cells were incubated with the fluorescent hormone analogues at different temperatures. The concentrations of hormone were 20-0 ng/ml. The incubations were in 1 ml of medium with 1% calf serum for (a) 15 min at 230 or 370, (b) 60 min at 15°, or (c) 90 min at 40. In some experiments the cells were incubated with the hormone analogues dissolved in Hanks' balanced salt solution with 1 mg of bovine serum albumin per ml. After the incubation, the cells were washed three times with Hanks' solution and observed directly or after fixation with 1% formaldehyde for 10 min at 23°. In some experiments the cells were grown in a Dvorak chamber (8) in medium with 10% calf serum in a 95% air/5% CO2 atmosphere at 370. Image-Intensified Video Fluorescence Microscopy. The locations of the fluorescent hormone analogs were observed with a Silicon Intensified Target (SIT) camera (RCA TC/ 1030H), which can detect very low levels of light and allows low excitation intensities to be used. Thus the rate of photobleaching, which is a serious problem in conventional fluorescence microscopy, was markedly decreased. The phase and fluorescence micrographs were taken with a Polaroid camera from a television screen that projects the intensified image. Full details about the system and its application for studying the cellular localization of concanavalin A and aC2-macroglobulin is published elsewhere (8). RESULTS The goal of this study was to determine the location at which insulin and EGF first bind to fibroblasts and what happened to these hormones after binding. Since the results with insulin and EGF are similar, they are presented together. Insulin and EGF Initially Bind to the Cell in a Diffuse Pattern. When 3T3 cells were incubated with R-lact-insulin (50 ng/ml) for 90 min at 40, the hormone was diffusely distributed over the cell surface (Fig. 1 A and B). When these cells were subsequently treated with typsin (0.25% for 5 min at 370) or with 0.35 1g of native insulin per ml for 30 min at 370, most of the fluorescent label was removed. Furthermore, no significant fluorescence was observed if 0.35 Mg of native insulin was added per ml with R-lact-insulin, and no fluorescence was observed if 0.015-15 Mg of R-lact per ml§ was used in place of R-lact-insulin. These results suggest that the insulin receptors are spread homogeneously over the cell membrane prior to the addition of R-lact-insulin and that at 40 they remain in that pattern after the hormone binds to its receptors. To confirm this suggestion, we quickly washed cells maintained in complete medium at 370 with phosphate-buffered saline and prefixed them with 1% formaldehyde before performing the binding studies. When the prefixed cells were incubated with R-lactinsulin at 23" for 60 min, a diffuse homogeneous distribution of hormone was again observed. Therefore, we conclude that
Proc. Nati. Acad. Sci. USA 75 (1978)
in7'
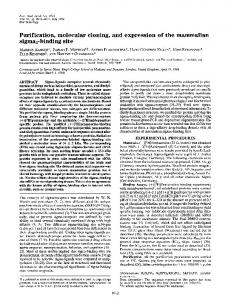
FIG. 1. Diffuse distribution of insulin and EGF. 3T3 cells were incubated for 90 min at 40 with either 50 ng of R-lact-insulin per ml (A and B) or 30 ng of R-lact-EGF per ml (C and D). Then the cells were washed with phosphate-buffered saline and fixed with 1% formaldehyde for 10 min. (A) Phase and (B) fluorescence micrographs of the same field; (C) phase and (D) fluorescence micrographs of the same field. Arrows denote the portions of outline of the cells. C and D contain an arbitrary reference point (star) to show alignment of the two fields. (X1240.)
the insulin receptors are diffusely distributed on the cell surface prior to hormone binding. R-lact-EGF, like R-lact-insulin, also binds to cells in a diffuse manner when incubated with 3T3 cells for 90 min at 40 (Fig. 1 C and D) or to cells prefixed with formaldehyde. Further, the diffuse fluorescence due R-lact-EGF was removed by trypsin treatment or by incubation with excess native EGF subsequent to or along with R-lact-EGF. Thus, we conclude that the EGF receptors, like insulin receptors, are diffusely distributed over the surface of 3T3 cells. In order to evaluate the ratio of the specific to nonspecific fluorescence of the labeled cells we measured the fluorescence intensity from a small area of the cell by the fluorescence photobleaching apparatus (12, 13). The level of the nonspecific fluorescence was measured after the cells were pretreated with 0.35 Ag of insulin or EGF per ml (20 min at 230) and then incubated with 50 ng of the corresponding fluorescent derivative per ml for 20 min along with the native hormones. The nonspecific fluorescence was approximately 30-40% of the total fluorescence intensity. Approximately a third of the nonspecific fluorescence is due to the background fluorescence emitted from nonlabeled cells under the same experimental conditions. Note that the nonspecific fluorescence includes the background fluorescence. Cells treated with R-lact alone (1-1000 nM) showed slightly higher fluorescence values than the background fluorescence but less than the nonspecific fluorescence. When R-insulin or R-EGF was used instead of the highly fluorescent derivatives, the surface fluorescence was very weak and could not be reliably distinguished from background fluorescence. Occupied Receptors for Insulin and EGF Aggregate into Patches at 23° and 370. When cells labeled at 40 with either R-lact-insulin or R-lact-EGF were incubated at 230 or 370, the
hormone-receptor complexes rapidly aggregated into patches on the cell surface. Similar patches were observed when cells were directly incubated with R-lact-insulin or R-lact-EGF at
23" or 37". Patch formation was much more rapid at 37" than at 230. Fig. 2 shows the distribution of R-lact-insulin on two cells incubated with the analog for 15 min at 37". The nonspecific
fluorescence did not show patches under these conditions; it
Biochemistry: Schlessinger et al.
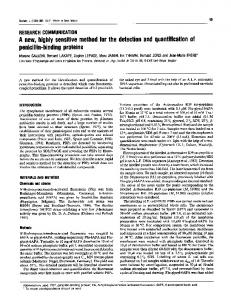
FIG. 2. Patching of insulin-receptor complexes on cell surfaces. 3T3 cells were incubated for 15 min at 370 with 50 ng of R-lact-insulin per ml, washed with phosphate-buffered saline, and fixed with formaldehyde. (A) Phase micrograph and (B) fluorescence micrograph of the same field. (X1240.) Fluorescence micrograph of another labeled fibroblast with the objective focused at the bottom (C) and the top (D) of the cell. (X780.)
appeared diffuse over the cell image. At this stage, most of the fluorescence is located on or near the membrane and most of the patches can be removed by trypsin treatment but not by the subsequent addition of unlabeled insulin (0.35 14g/ml for 30 min). The patching of both hormone derivatives was not affected by preincubating the cells for 30 min at 37° with the following compounds: 10 mM 2-deoxyglucose; 10 mM sodium azide; 10 mM sodium azide together with 10 mM 2-deoxyglucose; 5 ,uM colchicine; or 5 Aig of cytochalasin B per ml and 10 mM chloroquine. In all these experiments the cells were preincubated with each drug for 30 min, washed, and then incubated with either R-lact-EGF or R-lact-insulin for 15 min at 370 without the inhibitor. Although the diffuse binding stage could not be observed with R-insulin and R-EGF, the formation of patches was clearly observed with these derivatives (results not shown). This is because the ratio of specific to nonspecific fluorescence is greatly increased when the fluorescent molecules cluster into small patches.' Hormone-Receptor Complexes Become Internalized into Endocytic Vesicles.1 When the cells labeled with R-insulin or R-EGF were incubated for more than 30 min at 370 in complete medium with 10% fetal calf serum, the fluorescent hormone derivatives appeared in endocytic vesicles (Fig. 3 C and D) that moved about in the cytoplasm in a saltatory manner (8). At this time the fluorescent hormone derivatives could not be removed by trypsin treatment and could not be displaced by subsequent addition of excess native hormone. A similar result was observed when the cells were labeled with the highly fluorescent derivatives, R-lact-EGF or R-lact-insulin (Fig. 3 A and B). Fig. 4 shows fluorescence micrographs taken from cells that were grown in a Dvorak chamber; a video tape was made at 15 frames per sec. The position of the fluorescent vesicles at 45 min after hormone addition and 18 and 90 sec later is shown. Positions of two groups of vesicles (a and b) are shown by the arrows. The movement of the two groups is summarized in Fig. 4D. ¶ The fraction of the hormone-receptor complexes on the cell surface
that are subsequently internalized is not known. It is possible to estimate from the work of others that under the conditions in which our experiments were performed -50% of the bound insulin (14) and -80% of the bound EGF (6) are bound to the cell irreversibly.
Proc. Natl. Acad. Sci. USA 75 (1978)
2661
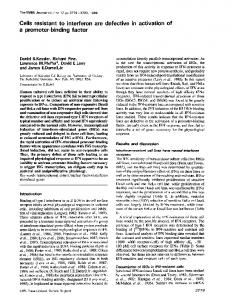
FIG. 3. Endocytic vesicles containing fluorescent insulin derivatives. 3T3 cells were incubated for 15 min at 370 with 50 ng of Rlact-insulin per ml, washed, and incubated for 40 min more with complete medium with 10% fetal calf serum; they were then washed and fixed with formaldehyde. (A) Phase micrograph and (B) fluorescence micrograph of the same field. (X1240.) 3T3 cells were incubated for 15 min at 370 with 50 ng of R-insulin per ml, washed, and incubated for 45 min more with complete medium with 10% fetal calf serum; they were then washed and fixed with formaldehyde. (C) Phase and (D) fluorescence micrographs of the same field. (X620.)
When the cells were preincubated with 10 mM sodium azide and 10 mM 2-deoxyglucose for 30 min at 370 and then incubated with either R-EGF or R-insulin for 30 min at 370, internalization of the fluorescent analogues was prevented but the surface aggregation process (patching) was still observed. In addition, it was possible to remove most of the fluorescence on these poisoned cells by treatment with trypsin. While most of the remaining fluorescence appeared diffuse, few patches were observed. The existence of a few patches after trypsinization might be the consequence of the failure of the treatment with sodium azide and 2-deoxyglucose to completely block the internalization. Even 12 hr after hormone addition the cells still contained fluorescence within the vesicles. By 12 hr some vesicles containing fluorescent hormone seem to have fused with phase dense structures, which are probably lysosomes.
FIG. 4. 3T3 cells were incubated with R-lact-insulin for 15 min at 370 and then washed and incubated for 30 min at 370 in complete medium with 10% serum. The cells were grown in a Dvorak chamber. (A, B, and C) Saltatory motion of the fluorescent vesicles in a living cell over 90 sec. (D) Trace of the moving vesicles in which the top trace
describes the original (solid line) and the final (dashed line) position of vesicles a and the bottom trace describes the original and final positions of vesicles b. (X1240.)
2662
Biochemistry: Schlessinger et al.
DISCUSSION The major conclusions of this study and another study,§ in which the mobilities of the receptors for insulin and EGF on the cell membrane were measured, are as follows: (i) Unoccupied insulin and EGF receptors are homogeneously distributed over the cell surface. (ii) Hormone binds to these diffusely distributed receptors and the hormone-receptor complexes remain diffusely distributed for at least 90 min at 4°. (iii) When the temperature of the cell is raised to 230 and the mobility of the fluorescent hormone is quickly measured (within -15 min), the hormone-receptor complexes are highly mobile (D 4 X 1-10 cm2/sec).§ (iv) When the temperature of the cell is maintained at 23° or 370, the hormone-receptor complexes aggregate on the cell membrane to form patches; this aggregation is much more rapid at 370 than at 23'. The aggregation does not require metabolic energy and it seems to depend on the rate of diffusion of the occupied receptors. (v) The aggregated hormone complexes (patches) become internalized into endocytic vesicles.II The internalization requires metabolic energy since it is inhibited by drugs that block oxidative phosphorylation and glycolysis. It seems likely that the hormone and its receptor enter the endocytic vesicles together, but this has not been established. (vi) Surface aggregation and internalization accounts for immobilization of the occupied hormone-receptor complexes that have been observed by the fluorescence photobleaching method.§ In the following section we try to relate the results and conclusions presented in this paper to the known biological responses to insulin and EGF. Is Patching and Endocytosis Related to Hormone Action? Within a few minutes after insulin binds to cells many of its actions are evident. These include increased glucose oxidation and the transport of glucose, amino acids, and some ions (2, 17). Clearly, these actions of insulin precede the onset of large patches. However, the formation of small microaggregates not visible by these methods containing a few insulin-receptor complexes could occur on the time scale of the rapid actions of insulin. We estimate that two receptors can encounter each other within 50 msec (unpublished data), assuming that the receptors are initially homogeneously distributed and that they move in a random walk with D = 4 X 101o cm2/sec.§ Other responses to insulin, such as increased DNA and RNA synthesis, are delayed and could be subsequent to the internalization of the insulin molecules. Indeed, it has been suggested by others that the entry of insulin or its fragments into the cell interior (18) could be required for such processes (19) and that the nucleus of human lymphocytes has receptors for insulin (19). We have not observed the binding of fluorescent insulin analogues (or EGF analogues) to the nucleus of fibroblasts. Much less is known about the biological response to EGF. It is known that EGF is a potent mitogen which binds in a specific saturable manner to fibroblasts (6). At 370 the surface-bound EGF is internalized and degraded (6). Our results clearly show that the internalization of the EGF-receptor complexes is a consequence of endocytosis. The mitogenic response of EGF could be the consequence of the entry of EGF or a fragment of EGF into the cell's interior. 11 If we assume that cultured cells possess "100,000 receptors for EGF (15) and that at least 50% are occupied and internalized into 100-200 endocytic vesicles, then each vesicle contains 250-500 molecules of
fluorescent EGF. Similarly for insulin using 20,000 receptors per cell (16), we obtain approximately 100 molecules per vesicle.
Proc. Natl. Acad. Sci. USA 75 (1978)
Is Surface Aggregation Related to Negative Cooperativity? It was suggested by De Meyts et al. (20) that insulin bound to cell membrane receptors exhibits negative cooperativity. The major evidence for the negative cooperativity was the increased rate of dissociation of 125I-labeled insulin from lymphocytes induced by the presence of unlabeled insulin and the nonlinear Scatchard plots obtained for insulin's binding to various cells. The basis for the negatively'cooperative binding has been interpreted to be due to site-site interactions among multivalent insulin receptors. Our observation that both insulin-receptor and EGF-receptor complexes can aggregate is consistent with the idea that the occupied hormone receptors are multivalent toward their hormones or are oligomers of monovalent receptors. The mechanism by which the bound hormone triggers the patch formation is unknown. For insulin one simple mechanism would be hormone self-aggregation on the cell membrane. Insulin dimerizes and aggregates in solution at concentrations above 10-6 M (21). When insulin binds to the cell membrane its local concentration is about 10-6 M (unpublished data).* This, together with the fact that association rates in two dimensions are larger than in three dimensions (22), makes this a feasible mechanism for insulin-receptor aggregation. Another possibility is that the bound hormone introduces a conformational transition in the receptors that increases the binding affinity between mobile receptors. In both mechanisms the multivalency of the occupied receptors is a necessary condition for obtaining visual patches. Indeed, recent electron microscopic data suggest that the unoccupied receptors for insulin appear in clusters of two to six molecules (23). How is Cell-Bound Insulin or EGF Degraded? Our results suggest that the pathway by which insulin and EGF are degraded in fibroblasts is the consequence of endocytic internalization, probably followed by degradation by lysosomal enzymes. This mechanism has been previously proposed (6, 18). Is Insulin and EGF Entry Related to Down Regulation of Receptors? When IM9 lymphocytes are exposed to large amounts of insulin, their capacity to bind insulin falls. This phenomenon, denoted "down regulation," is dependent on time, temperature, and insulin concentration (24). The normal level of receptors can be restored by returning the cells to insulin-free medium for 5-16 hr. Similarly, the capacity of fibroblasts to bind EGF falls after the cells are exposed to EGF (6). Cohen and his coworkers have suggested that the EGF receptors are internalized subsequent to EGF exposure. The internalization of the hormone-receptor complexes is dependent on time, temperature, and hormone concentration. Therefore, the internalization of hormone-receptor complexes could cause the receptor down regulation. This hypothesis suggests a possible mechanism for hormone down regulation and raises a few interesting but as yet unanswered questions: Are the internalized fluorescent hormones still associated with their receptors? How are these results related to receptor synthesis, existence of pools of receptors, and receptor turnover? In a recent publication Anderson et al. (25) proposed a mechanism for the regulation of the receptor for low density lipoprotein on fibroblasts. They proposed that newly synthesized receptors for low density lipoproteins are inserted at random sites along the plasma membrane and then cluster together independent of the binding of low density lipoprotein in regions of the membrane containing "coated pits." The ** The mean distance between neighboring hormone receptors at a concentration of 50 receptors/Mm2 equals 0.07 Am. Such a mean distance between neighbors corresponds to -500 molecules/Mm3. This
corresponds
to
(500
X
1012
X
103)/(6.3 1023) X
10-6 M.
Biochemistry: Schlessinger et al. coated pits internalize to form coated vesicles (25). Anderson et al. (25) suggested that the same mechanism might exist for the internalization and degradation of EGF on fibroblasts. Our data for the internalization of insulin or EGF are clearly inconsistent with their proposal, for we find that EGF and insulin receptors are diffusely distributed before the hormone is bound and that patching and internalization are triggered by hormone binding. We do not know if EGF and insulin enter the cell via "coated pits" or by other structures. We thank P. Cuatrecasas, P. Henkart, J. Roth, R. Kahn, and E. L. Elson for their very stimulating discussions. We also thank E. Lovelace and S. Yamada for their help with cell culture. 1. Pastan, I., Roth, J. & Macchia, V. (1966) Proc. Natl. Acad. Sci. USA 56, 1802-1809. 2. Kahn, R. (1976) J. Cell. Biol. 70, 261-286. 3. Cohen, S. (1964) Natl. Cancer Inst. Monogr. 13, 13-21. 4. Carpenter, G. & Cohen, S. (1976) J. Cell. Physiol. 88, 227238. 5. Armelin, H. A. (1973) Proc. Natl. Acad. Sci. USA 70, 27022706. 6. Carpenter, G. & Cohen, S. (1976) J. Cell. Biol. 71,159-171. 7. Schechter, Y., Schlessinger, J., Jacobs, S., Chang, K. J. & Cuatrecasas, P. (1978) Proc. Natl. Acad. Sci. USA 75, 2135-2139. 8. Willingham, M. C. & Pastan, I. (1978) Cell 13,501-507. 9. Savage, C. R. & Cohen, S. (1972) J. Biol. Chem. 247, 76097611. 10. Pratt, R. M. & Pastan, I. (1978) Nature 272,68-70.
Proc. Natl. Acad. Sci. USA 75 (1978)
2663
11. Hollenberg, M. D. & Cuatrecasas, P. (1975). J. Biol. Chem. 250, 3845-3853. 12. Koppel, D. E., Axelrod, D., Schlessinger, J., Elson, E. L. & Webb, W. W. (1976). Biophys. J. 16, 1315-1329. 13. Schlessinger, J., Koppel, D. E., Axelrod, D., Jacobson, K., Webb, W. W. & Elson, E. L. (1976) Proc. NatI. Acad. Sci. USA 73, 2409-2413. 14. Kahn, C. R. & Baird, K. L. (1977) Diabetes 26,354-355. 15. Carpenter, G., Lembach, K. J., Morrison, M. M. & Cohen, S. (1975) J. Biol. Chem. 250,4297-4309. 16. Thomopoulos, P., Roth, J., Lovelace, E. & Pastan, I. (1976) Cell 8,417-423. 17. Fain, J. N. (1974) Biochemistry Series One, MTP International Review of Science, ed., Rickenberg, H. V. (Park Press, Baltimore, MD), Vol. 8, pp. 1-23. 18. Terris, S. & Steiner, D. F., (1976) J. Clin. Invest. 57, 885-896. 19. Goldfine, I. D., Smith, G. J., Wong, K. Y. & Jones, A. L. (1977) Proc. Natl. Acad. Sci. USA 74, 1368-1372. 20. De Meyts, P., Bianco, A. R. & Roth, J. (1976) J. Biol. Chem. 251, 1877-1888. 21. Blundell, T., Dodson, G., Hodgkin, D. & Mercola, D. (1972) Adv. Protein Chem. 26,279-402. 22. Richter, P. H. & Eigen, M. (1974) Biophys. Chem. 2,255-263. 23. Jarett, L. & Smith, R. M. (1977) J. Supramol. Struct. 6,45-59. 24. Gavin, J. R., Roth, J., Neville, D. M., De Meyts, P. & Buell, D. N. (1974) Proc. Natl. Acad. Sci. USA 71,84-88. 25. Anderson, R. G. W., Goldstein, J. L. & Brown, M. S. (1977) Nature
270,695-699.