DISASTERS MAPPING IN ALGERIA AND MANAGEMENT USING G.I.S AND REMOTE SENSING TECHNOLOGIES Y. SMARA, A.BELHADJ-AISSA & M. BELHADJ-AISSA Laboratoire de Traitement d’Images et Rayonnements, Faculté d’Electronique et d’Informatique / USTHB, BP 32 El-Alia, Bab Ezzouar, Alger, Algeria Fax: 213 21 24 71 87 ; Email:
[email protected]
Abstract Algeria is affected by fourteen major risks and the means for the management of these disasters are limited and often inadequate. The major risks can be divided into two categories: (i) The first concerns natural disasters and includes earthquakes, landslides, floods, forest fires, storms and violent winds, drought and acridian invasions, (ii) The second is related to technological disasters. It includes radiological emanations, fires-explosions, pollution, and biologic risks as well as air, sea, railway and road accidents. These risks are managed by highly regulated and technical means, generally conventional, likely to eliminate risks endangering people, property and the environment. These natural disasters are inevitable, but it is possible to minimise the potential risk by developing disaster early warning strategies using Remote sensing and GIS technologies, by preparing and implementing plans to provide resilience to such disasters and to facilitate rehabilitation and minimise the after effects of the disaster. In fact, space technologies play a crucial role in efficient mitigation and management of disasters. This communication describes the role of remote sensing and Geographical Information System (GIS) in evolving a suitable strategy for disaster management in Algeria and evolving an occupational framework for the monitoring, assessment and mitigation these disasters. This communication also identifies gap areas and recommends appropriate strategies for disaster management using these technologies.
Introduction Among risks described above and according to the available statistics a part of the north of Algeria is liable to seismic activity of varying intensities (Alger-Boumerdes 2003, Chlef (ex-ElAsnam) 1980, Tipaza, 1989,etc) The central and the southern parts of Algeria are drought prone. Coastal areas of Algeria are exposed to marine pollution and of all the disasters occurring in the country, forest fires (in northern Algeria) are the most frequent and often the most devastating. Remote Sensing and GIS can be a very useful tool to complement conventional methods involved in Disaster Management Mitigation of natural disaster management can be successful only when detailed knowledge is obtained about the expected frequency, character, and magnitude of hazard events in an area. Although, natural disasters have shown in the last few decades a drastic increase in magnitude and frequency, it can as be observed that there has been a dramatic improvement in technical capabilities to mitigate them. The use of remote sensing data, such as satellite imageries and aerial photos, allows us to map the variabilities of terrain properties, such as vegetation, water, geology, both in space and time. Satellite images give a synoptic overview and provide very useful environmental information, for a wide range of scales, from entire continents to detail of a few meters. Many types of disaster, such as floods, droughts, earthquakes, etc. will have certain precursors that
1
satellite can detect. Remote sensing also allows monitoring the event as it occurs. From the vantage point of satellite we can consider, plan for and operationally monitor the event. Finally, the impact and departure of the disaster event leaves behind an area of immense devastation. Remote Sensing can assist in damage assessment monitoring, providing a quantitative base for relief operations. After that it can be used to map the new situation and update the database used for the reconstruction of an area. It can help to prevent the occurrence of such disasters again in the future. Indeed, a complete strategy for disaster management is required to effectively reduce the impact of natural disaster, which is as referred to as the disaster management cycle. Disaster management consists of two phases taking place before the disaster occurs, which are disaster prevention and disaster preparedness, a three phases taking place after the disaster occurs, which are disaster relief, rehabilitation and reconstruction: - In the disaster prevention phase, GIS is used to manage the large volume of data needed for the hazard and risk assessment. - In the disaster preparedness phase, it is a tool for the planning of evacuation routes, for the design of centres for emergency operations, and for the integration of satellite data with other relevant data in the design of disaster warning systems. - In the disaster relief phase, GIS is extremely useful in combination with Global Positioning System in search and rescue operations in areas that have been devastated and where it is difficult to find ones bearings. - In the disaster rehabilitation phase, GIS is used to organise the damage information and the post-disaster census information, and in the evaluation of sites for reconstruction. Hence, GIS is a useful tool in disaster management if it is used effectively and efficiently.
Disaster Management and new technologies in Algeria In recent years, Remote Sensing and Geographical Information System (GIS) technologies have been the object of considerable interest to all bodies concerned with space and in particular emergency services and disaster management in Algeria, in collaboration with all other bodies responsible for prevention and management of all major risks in Algeria. Among these risks we can mention the most preoccupying as being the forest fires that ravage thousands of hectares every year, earthquakes that have a devastating effect every time, the industrial risks that are real considering the numerous complex petrochemical and industrial existing in Algeria, coastal and marine pollution at present little recognised but very real considering the 1200 kilometre Algerian coast line, near which many ships empty their tanks offshore as well as the oil industry activity in many Algerian ports. There are other less frequent hazards but which are always as devastating, the most recent being the sea of mud which engulfed the district of Bab-El-Oued in the city of Algiers following torrential rain with considerable loss of life property. These risks are often efficiently and carefully managed by administrators of this vital sector feel a growing need for information particularly to be able to count on prevention to avoid disasters or at least to minimise the damage. For the reason, the implication of this new technology is necessary and for the first time the means of communication have been improved sufficiently to make them very efficient. Much work has already been done collecting data by conventional methods, without any real implication of Geographical Information Systems in every type of risk or in all regional units. This has been done in collaboration with bodies such as the forestry services for the management of the 2
forest fires, the centre for astronomical, astrophysical and geophysical research for the monitoring of earthquakes and so on. The use of remote sensing and GIS has become an integrated, well developed and successful tool in disaster management. A very powerful tool in combination with these different types of data is GIS. It is defined as a "powerful set of tools for collecting, storing, retrieving at will, transforming and displaying spatial data from a real world for a particular set of purposes". GIS allows the combination of different kinds of data using models. GIS allows for the combination of the different kinds of spatial data, with non-spatial data, attribute data and use them as useful information in the various stages of disaster management. For our part, we will be interested in the presentation of the use of remote sensing and GIS technologies for the management of risks and we hope to contribute directly or indirectly to putting these new technologies in place in Algeria.
Desertification The study, carried out with the collaboration of a French laboratory between 1991-1995 and later with specialists in Earth sciences, shows that remote sensing is and will remain a useful tool for environmental monitoring purposes. The methodology has been applied in arid and semi-arid region of southern Algeria and consists of the localisation of the degradation due to natural and human phenomena. This study was carried out with Landsat MSS, TM, Spot and SAR ERS-1 images acquired respectively in May 1977, January 1989, february 1986 and November 1993. The obtained results allowed us to establish a degradation inventory. With the complementarity of the topographic and geological maps, a maximum of information is derived from satellite images from different approaches allowing us to complete several maps: - Cartography the area in terms of surface state. - Cartography in terms of morphodynamic units The combination of these documents updated by ground data and informations obtained by specialised bodies, will allow us to map the dersertification sensibility. Problems associated with the detection of remotely-sensed land-cover changes are identified and suggestions for improvements are offered.
Marine pollution The problem of the marine pollution is probably one of the most worrying aspects of the deterioration of the environment. This type of pollution is a major risk that would seriously affect the Biosphere-Geosphere balance. Hydrocarbons are the most noted pollutants and the Mediterranean Sea contain 18% of the world’s pollution. Algeria is affected by the risk of marine pollution considering the 1200 kilometre coastline near which many ships empty their tanks offshore as well as the oil industry activity in many Algerian ports. In fact, the ports of ARZEW (Western Algeria), ALGIERS, BEJAIA (Central Algeria) and SKIKDA (Eastern Algeria) have considerable maritime traffic, linked to industrial zones particularly at risk of pollution. Among the remote sensing technologies, SAR (Synthetic Aperture Radar) is very promising because it can provide images both day and night, even when clouds are present. The visual effect of an oil slick on a SAR image is a dark area. The presence of oil reduces the water surface roughness and consequently also reduces the electromagnetic backscatter. There are a certain number of image features that can be considered as slick signatures.
3
In this context, we have implemented measurements for some of these, looking for those more useful in discriminating between oil spills and other phenomena that cause backscattering attenuation. For each selected dark area, first its border is identified then other measurements such as the perimeter (P), the area (A), the position of the oil spill in the image (x,y), etc. In conclusion, the potential for the detection and characterisation of oil spills using ERSSAR imagery has been studied. The methodology is easy to apply and is able to determine the identification probability in an automated way. We expect this to be a useful tool for the monitoring services.
Seisms and earthquakes The work achieved at the CRAAG (Algerian Centre of Research in Astromomy, Astrophysics and Geopgysics) concerns a methodology used to develop the seismic data base in Algeria to be implemented in the GIS in the framework of natural disaster management. Several data bases, relative to various hazards, vulnerability, elements at risk, secondary effects, etc., must be developed in order to assess the risk as precisely as possible and consequently enable the disaster to be managed efficiently. Supported by the GIS, seismic risk reduction is related : a) determining local risks factors (landslide, liquefaction of soils). b) zoning of built up urban areas. c) assessing the vulnerability of buildings. d) taking preventive action and creating awareness in the local population.
At the CRAAG (Algerian Center of Research in Astronomy, Astrophysical and Geophysical), experience of the GIS is recent. Nevertheless, the CRAAG, conscious of the importance of the use of such a tool, undertook the creation of this system, because we consider that to reduce the seismic risk, we need to have the appropriate tools. In fact, a collation of a certain number of data treated beforehand can shorten the thinking time and speed up intervention in the management of a disaster. These notable improvements in the managing of a disaster or of its after-effects will certainly contribute to a reduction in the seismic risk in Algeria.
4
For our part, the collaboration with the CRAAG is focused on the use satellite data such as interferometric products to detect displacement field resulting from a major earthquake by differential SAR intereferometry and to achieve results comparable in magnitude to those obtained by conventional field survey techniques. The use of differential SAR interferometry allows to capture the extent of the displacement field. In effect, Three interferograms constructed from ESR1/2 SAR data can be used to analyse the earthquake mechanism by three-pass method and the digital elevation model elimination. This method can reveal the behaviour of the landslide that could not be observed with discrete GPS measurements. For these studies, the methodologies have been developed thanks to the collaboration of a French laboratory for the first project (desertification) and the collaboration of the European Space Agency (ESA) for providing radar SAR images and training for the second and third projects (marine pollution and differential interferometry for seisms). In 2003, our laboratory had the great opportunity de contact the National Agency of Emergency services and disasters management which is directly concerned by our subject. After discussions, we elaborate a training program in Remote Sensing and GIS and their practical application in two pilot projects concerning forest fires and industrial disasters. At present, basic knowledge and training in Remote sensing and GIS are given to certain members of the National Agency and both pilot projects are being studied.
Forest fires Every year about 30 000 hectares of forests are destroyed by fires in Algeria, fires also take a heavy toll in lives and property and our major preoccupation is to reduce forest fires in the country, thanks to inventory, prevention, management and follow-up. Prevention and early warning systems constitute the only means to limit the cost of damage. In huge fires, options are often limited to the bravery of the firemen attempting to fight the fire. The essential indicators of fires are the starting point (heat, absence of precipitation, etc), the speed of propagation (nature of the land, of vegetation, humidity), wind direction and absence of natural obstacles (mountains), etc. The geographical parameters of the region, that guide the setting up of intervention plans are topography (damaged land or no), access (road networks, tracks,), and built up areas (inhabitants and strategic sites) In the last few years, the data acquired by Earth observation satellites associated with different types of linked information integrated in a Geographical Information System has proved to 5
constitute a viable option for the follow-up of disasters, the identification of areas at risk, and the mapping out of the extent of fire. The mapping out of fire zones can be done by techniques of change detection and the regression of values of vegetation indications (NDVI) before and after the fire. The goal of our pilot project is to set up of a GIS integrating remote sensing data for the prevention, management and follow-up of the fires. The methodology adopted is as follows: I) to process and to structure data, to determine and to establish indicators and parameters that start the forest fires: The first approach is based on the analysis of the temporal evolution of the vegetation indication (NDVI). A fall of the NDVI should be in direct proportion to the increase in the fire risk. The second fire indicator the correlation between the surface temperature and the NDVI. II) to present to decision makers of the sectors concerned, in real time on screen: Maps of the state of the surface at any given moment in time ‘t ' (maps of plant surface cover, maps of access roads, maps showing altitudes, etc..) Maps of zoning indicators integrated with meteorological data integration. Etc.
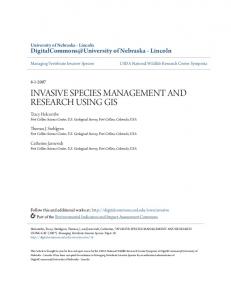
Industrial risk The identification of possible industrial risks and the study of impacts on the environment generally allow us to take preventive measures, but early warning systems and planning restrictions around industrial sites are the only means of reducing the cost of damage. In order to carry out this task however all the information must be collated. Our preoccupation in this pilot project is to create an inventory of possible industrial risk and study the impact on the staff, resident, property and the environment. The management and follow-up in real time of a possible accident and the prevention. The goal of the project is to set up a GIS integrating data from different sources (satellite, maps, figures, etc) for the follow-up and for industrial risk prevention. The adopted methodology concerns essentially: Creation of a descriptive data base of all relevant information. Development of analytical tools enabling us to point out the correlation between different data and to assess their suitability to the terms of reference of the Emergency services. Drawing up of maps showing different preventive measures. Etc. For the two pilots projects, the general adopted methology is given by the following synoptic:
6
DONNEES : Images, Cartes, Photographies, Données statistiques
PPhhoottooggrraapphhiieess aaéérriieennnneess
Cartes thématiques et topographiques
Données alphanumérique
Numérisation et mosaïquage de photographies aériennes
Vectorisation des thèmes d’intérêt au projet
Saisie des données
Images satellitaire Correction géométriques et radiométriques
Géocodage de toute l’information
( avec vérification par des points d’appui sur le terrain) INFORMATIONS GÉORÉFÉRENCÉES
Images
Exemples de traitements
Classifications Avant et après monodate et multidate Carte d’état de surfaces Carte des changements
TRAITEMENTS QUALITATIFS POUR L’INTERPRÉTATION THÉMATIQUE Traitements statistiques
Etablissement des couches vectorielles Définition des différents attributs
CALCUL D’INDICES DE VÉGÉTATIONS
VÉRIFICATION IN –SITU
CARTE D’INDICE DE VÉGÉTATION
S.I.G
- Présentation des résultats sous différents formats, - Mise à jours par de nouvelles données, - Intégration des données pour la prévention - etc
Conclusion Analysis of hazard is a complex task, as many factors can play important role in the occurrence of the disastrous event. Therefore, analysis requires a large number of input parameters, and techniques of analysis may be very costly and time consuming. The increased availability of Remote Sensing data and GIS during recent decades has created opportunities for a more detailed and rapid analysis of natural hazards. The proper structure of information system for disaster management should be present to tackle the disaster and to manage it. In this communication, we present our contribution of the Algerian experience in the use of Space technologies for disaster management. In effect, Remote Sensing and GIS can provide useful information, and create disaster awareness with politicians, concerned decision makers and the public, so that on a national level decisions are taken to set up disaster management organisations. At such a general level, the objective is to give an inventory of disasters and the areas affected or threatened for an entire country. The following types of information should be included: Hazard free regions for development. Regions with severe hazards where most development should be avoided. 7
Regions with hazards where development has already taken place and where measures are needed to reduce the venerability. The remote sensing and GIS database can be used to create elaborate and effective Disaster Management Information System (DMIS). An integrated approach using scientific and technological advances should be adopted to mitigate and to manage natural hazards. Moreover there should be a national policy for natural disaster management.
References
F.G. ALONSO & J.L. CASANOVA ROQ, 1997. Application of NOAA-AVHRR images for the validation and risk assessment of natural disasters in Spain. Remote Sensing’96, Spiteri editors, Balkema, Rotterdam,1997. J. HARMS, G. PIERRE & J.C. CAZAUX, 1997. Use of space technologies for majors risks management. Remote Sensing’96, Spiteri editors, Balkema, Rotterdam,1997. HALLUM, C., 1993. A change detection strategy for monitoring vegetative and land-use cover types using remotely-sensed,satellite-based data. Remote Sensing Environment, 43, 171-177 SMARA, Y., BELHADJ-AISSA, A., TAIBI, N. & MAHROUR, M. 1995, Methodology for degradation monitoring in arid and semi arid region of southern Algeria using multidate remotely sensed data in Proceedings of EARSeL Advances in Remote Sensing. Brandys-nad-Labem, Czech republic. pp 30-39. ALEXANDER, D., 1993. Natural Disasters. UCl Press ltd. University College London. pp 632. COVA, T.J., 1999. GIS in emergency management. In: Geographical Information Systems, management and applications. Longley, P.A.; Goodchild, M.F.; Maguire, D.J. and Rhind, D.V. PEARSON, E, WADGE, G, AND WISCOSKI, A P, 1991. An integrated expert system/GIS approach to modeling and mapping hazards. Proc European conference on GIS, session 26, pp 763-771. M. BELHADJ-AISSA, A. BELHADJ-AISSA & Y. SMARA. Télédétection et système d'information géographique régional pour la caractérisation d'une région aride et semi-aride du sud algérien. Journées de la recherche CASSINI, 13-14 Octobre 1994, Lyon, France.
Y.BOUTABA, A.BOUZENOUNE & Y.SMARA. Inventory of ressources of arid region by aerial photographs and Landsat TM satellite images. International symposium of International Space University. Preserving Earth and Improving Life.5-7 février, Strasbourg, France. Y. SMARA, A. BELHADJ-AISSA et N. TAIBI. Remote sensing techniques for desertification monitoring in semi arid region of southern Algeria. International Workshop on Geo-spatial Knowledge processing for Natural Resource Management. 28-29 June 2001, Varese (Italy). Y. SMARA. Détection et caractérisation de nappes d’hydrocarbures par imagerie satellitaire radar RSO. IXèmes journées scientifiques du réseau de Télédétection de l'AUF, 29 novembre au 02 décembre 2001, YAOUNDE (CAMEROUN). A.M. GRAÏNE, A. KHELIL, K. DAOUD & Y. SMARA. Cartographie des sols sales par l’imagerie satellitaire. IXèmes journées scientifiques du réseau de Télédétection de l'AUF, 29 novembre au 02 décembre 2001, YAOUNDE (CAMEROUN).
BELHADJ-AISSA, A. BELHADJ-AISSA & Y. SMARA, 1999. Système d’information géographique et Télédétection. Gestion de l’espace urbanisé. Exemple d’application sur la capitale Alger. ALSIG’99, 15-18 Novembre 1999, Alger. Y. SMARA. Imagerie satellitaire pour la détection de la pollution côtière. Conférence IMPAC-2000, 2324 Octobre 2000, Boumerdes, Algérie. Y. SMARA, M.BELHADJ-AISSA & A.BELHADJ-AISSA. Application des nouvelles technologies pour la prévention et la gestion des feux de forets.Séminaire national sur la prévention et la lutte contre les incendies de forets,11-13 MAI 2002, Batna, ALGERIE.
8